Food Price Inflation is on the Rise Globally but Steady at Home
December 18, 2019
PAER-2019-15
Author: Jayson L. Lusk, Department Head & Distinguished Professor of Agricultural Economics


After a steady decline in global food prices throughout most of 2017 and 2018, this summer in 2019, prices began to rise. In October 2019, the last date data are available, global food prices rose 6% relative to the same month a year earlier. It has been more than two years since prices rose at this pace. The recent global food price spike is primarily caused by rising meat prices, which have increased more than 10% in each of the last two moths relative to the same months in 2018. Reductions to the supply of pork in China, due to African Swine Fever, have played a major rule in contributing to the upswing in global food prices. Reports of rising prices of onions in India and supply disruptions in Turkey and Nigeria are additional contributors. Still, the 6% year-over-year monthly increase in global food prices is modest in historical terms. From March 2007 to March 2008, global food prices rose 58%, and after falling more than 30%, rose again by almost 40% in mid-2011.
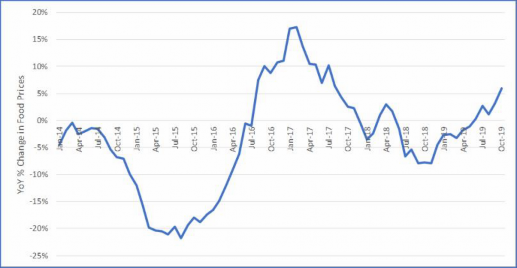
Figure 1. Year-over-Year Percent Change in Global Food Prices (source: United Nations Food and Agricultural Organization)
In the United States, retail food price inflation has remained modest over the past year. From October 2018 to October 2019, prices of food away from home increased 3.3% and prices for food bought for at home consumption increased only about 1%. The USDA Economic Research Service is projecting an overall annual inflation rate for food consumed away from home of between 2% and 3% for both 2019 and 2020. More modest annual inflation of 0.5% to 1.5% is projected for food bought in grocery outlets for at home consumption. These figures are low in historical terms, but are slightly higher than the annual retail food inflation experienced over the past three to four years. Annual inflation rates for food away from home were 2.9%, 2.6%, and 2.3% and for food at home were -1.3%, -0.2% and 0.4% in 2016, 2017, and 2018, respectively. Helped by lower commodity prices, food at home prices have risen at a rate slower than overall non-food price inflation, which averaged about 2.1% per year from 2016-18.