Comparing Crop Costs and Returns Across the Globe
June 5, 2019
PAER-2019-03
Authors: Rachel Purdy, Ph.D. Candidate and Research Associate and Michael Langemeier, Professor of Agricultural Economics and Associate Director for the Center for Commercial Agriculture
![]()
![]()
![]()
![]()
![]()
Examining the competitiveness of crop production in different regions of the world is difficult due to lack of comparable data and agreement regarding what needs to be measured. To be useful, international data needs to be expressed in common production units and converted to a common currency. Also, production and cost measures need to be consistently defined across production regions.
This paper examines the competitiveness of crop production from 2013 to 2017 using data from the agri benchmark network. The agri benchmark network collects data on beef, cash crops, dairy, pigs and poultry, horticulture, and organic products. There are 40 countries represented in the cash crop network. The agri benchmark concept of typical farms was developed to understand and compare current farm production systems around the world. Participant countries follow a standard procedure to create typical farms that are representative of national farm output shares and categorized by production systems or a combination of enterprises and structural features.
Eight farms in the dataset produced corn, soybeans, and wheat every year between 2013 and 2017. These farms are listed in Table 1 and are typical farms used in the agri benchmark network. Two of the eight farms are from the United States (a southern Indiana farm and a North Dakota farm). Purdy (2019) provides a more detailed analysis of international crop production using agri benchmark data.
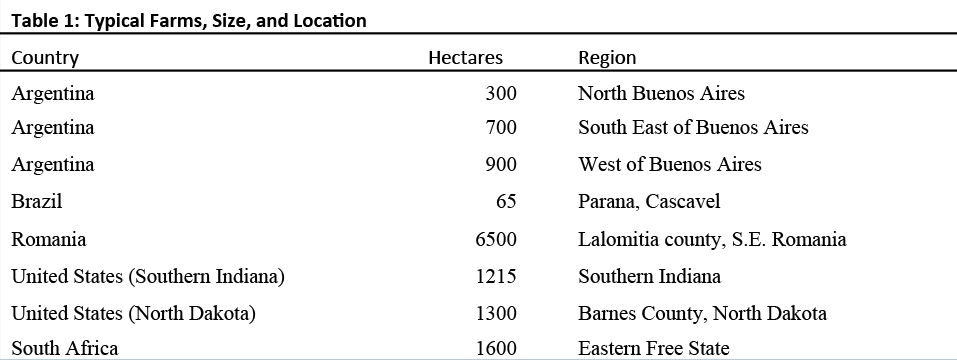
Table 1: Typical Farms, Size, and Location
Due to differences in technology adoption, input prices, land fertility levels, efficiency of farm operators, trade policy restrictions, exchange rate effects, and labor and capital market constraints input use varies across farms. In addition to presenting information pertaining to gross revenue and cost per ton, this paper discusses input cost shares.
Costs were broken down into three major categories: direct costs, operating costs, and overhead costs. Direct costs included seed, fertilizer, crop protection, crop insurance, and interest on these cost items. Operating cost included labor, machinery depreciation and interest, fuel, and repairs. Overhead cost included land, building depreciation and interest, property taxes, general insurance, and miscellaneous cost.
Corn: Argentina Farms Had Low Costs
Figure 1 presents average gross revenue and cost per ton for each typical farm for the 2013 to 2017 period. Gross revenue and cost are reported in U.S. dollars for each typical farm. Gross revenue was highest for the South African farm, and lowest for the large Argentinian farm ($178 and $103 per ton, respectively). Gross revenue and cost per ton for the southern Indiana farm were $158 and $163 per ton, resulting in an economic loss of $5 per ton.
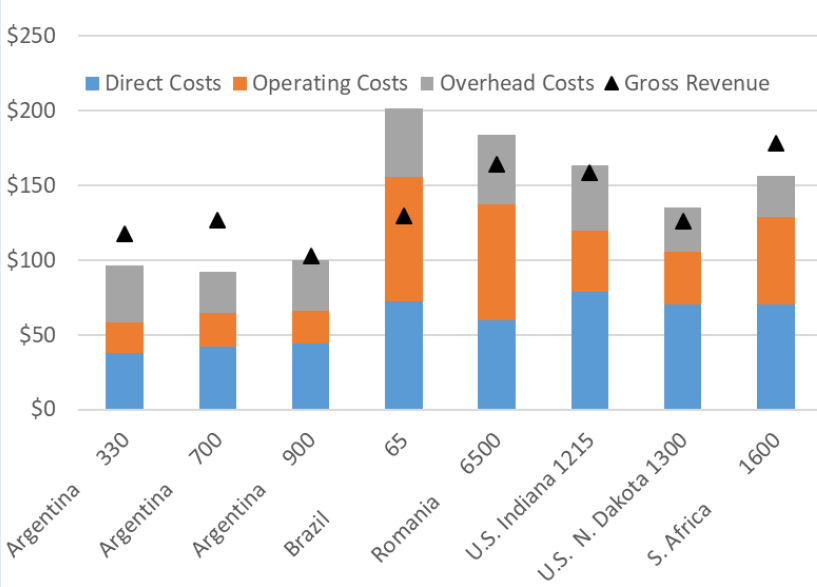
Figure 1. Average Gross Revenue and Cost for Corn ($ per ton)
The typical farms from South Africa and Argentina exhibited economic profits during the five-year period, earning an average of $20 per ton. Average losses for the remaining typical farms were $27 per ton, during the five-year period. On average, economic loss per ton was $3 per ton.
The average input cost shares were 42.8% for direct cost, 29.9% for operating cost, and 27.3 % for overhead cost. The North Dakota farm had the largest cost share for average direct cost, at 52.2%. The Romanian farm had the lowest cost share for average direct cost at 32.5%. Operating cost shares ranged from 21.0% on the smallest Argentinian farm to 42.0% on the Romanian farm. Overhead costs ranged from 17.2% on the South African farm to 39.9% on the smallest Argentinian farm. The average cost shares for the southern Indiana farm were 48.0%, 25.1%, and 26.9% for direct, operating, and overhead costs, respectively.
Soybeans: U.S. Farms had Positive Margins
Figure 2 presents average gross revenue and cost per ton for each typical farm. Gross revenue and cost are reported as U.S. dollars per ton. Total cost of soybean production was lowest for the typical farms in Argentina, and highest for the South African farm. Gross revenue and cost per ton for the southern Indiana farm were $385 and $368 per ton, resulting in an economic profit of $17 per ton. The Brazilian and South African farms did not earn an economic profit producing soybeans during the 2013 to 2017 period. Losses per ton were $13 per ton for the Brazilian farm and $139 per ton for the South African farm. On average, economic profit was less than $1 per ton for the eight farms examined in this study.
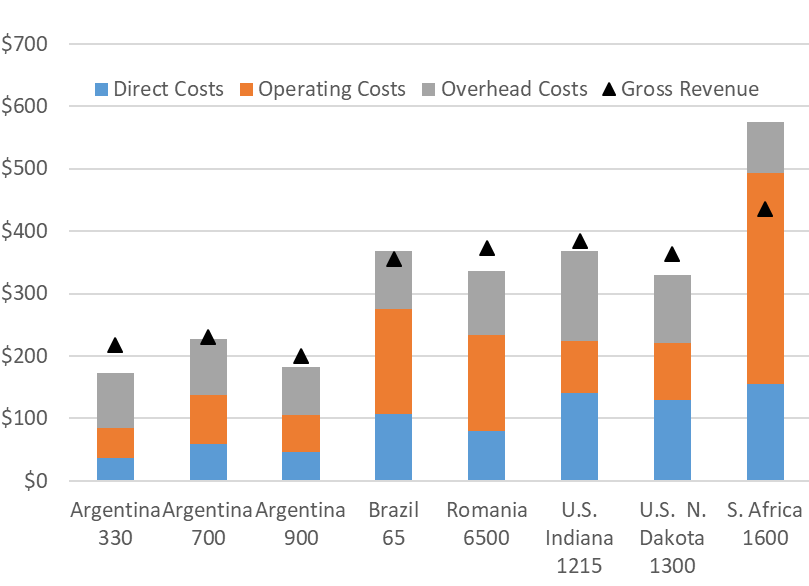
Figure 2. Average Gross Revenue and Cost for Soybeans ($ per ton)
The average input cost shares were 28.6% for direct cost, 37.0% for operating cost, and 34.3% for overhead cost. The North Dakota farm had the highest cost share for direct costs, at 39.6%. The smallest Argentinian farm had the lowest cost share for direct costs at 20.9%. Operating costs ranged from 22.9% on the Southern Indiana farm to 58.8% on the South African farm. Overhead costs ranged from 14.2% on the South African farm to 51.3% on the smallest Argentinian farm. The average cost shares for the southern Indiana farm were 38.1%, 22.9%, and 39.0% for direct, operating, and overhead costs, respectively.
Wheat: Wide Differences by Country
Figure 3 presents average gross revenue and cost per ton for each typical farm. Gross revenue and cost are reported as U.S. dollars per ton. Wheat was a minor enterprise for the southern Indiana farm. The primary reason for growing wheat on this farm was to facilitate the production of double-crop soybeans. The total cost of wheat production, on a per ton basis,was highest on the Brazilian typical farm. The Brazilian typical farm also had the highest economic loss during this time period, at $220 per ton.
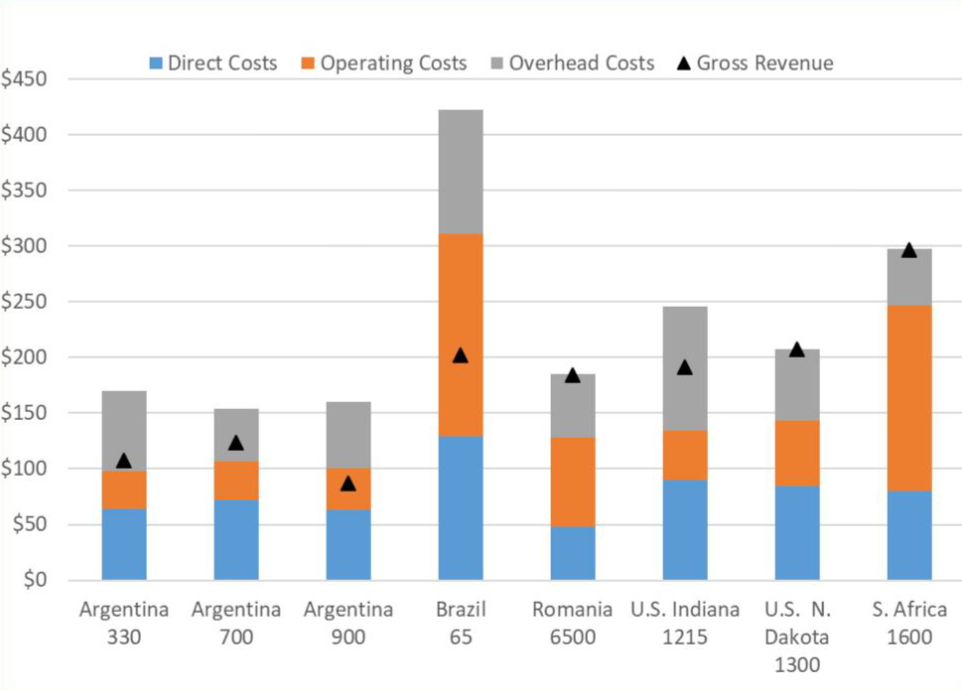
Figure 3. Average Gross Revenue and Cost for Wheat ($ per ton)
The only typical farm in this sample to earn a positive economic profit in wheat production was the North Dakota farm, earning less than $1 per ton over the five-year period. The average economic loss was $55 per ton for the eight farms in the sample. Given that the average gross revenue was only $175 per ton, the average loss for the eight farms included in this paper was extremely large. Many of the primary wheat producing countries were not included in this paper. For more information pertaining to the efficiency of typical farms with wheat from Australia, Canada, the European Union, Ukraine, and Russia see Purdy (2019).
The average input cost shares were 35.5% for direct cost, 31.8% for operating cost, and 32.7% for overhead cost. Average direct cost share ranged from 26.0% on the Romanian farm to 46.9% on Argentina 700. The southern Indiana farm had the lowest operating cost share, at 18.2%. The South African farm had the highest operating cost share at 56.0%. Due to relatively high land costs, the southern Indiana farm had the highest overhead cost share at 45.3%. The lowest overhead cost share was 17.3% on the South African farm.
Conclusions
This paper examined gross revenue and cost for eight corn, soybean, and wheat producing farms in the agri benchmark network from Argentina, Brazil, Romania, the United States, and South Africa for the years 2013 to 2017. The average economic profit was -$3, $0, and -$55 per ton for corn, soybeans, and wheat, respectively. The range of economic profits was highest for wheat production ($221 per ton, compared to $184 per ton for soybeans and $107 per ton for corn). Only one of the wheat farms and four of the corn farms exhibited a positive economic profit over the study period. In contrast, six of the soybean farms had a positive economic profit.
In addition to examining gross revenue and cost per ton, Purdy (2019) examined the cost efficiency of corn, soybean, and wheat production during the 2013 to 2017 period. Of the farms that had corn, soybeans, and wheat, the farms in Argentina and the United States tended to have the highest levels of cost efficiency. In terms of just corn and soybeans, the farms in Argentina, Brazil, and the United States tended to have the highest levels of efficiency.
References:
Agri benchmark. http://www.agribenchmark.org/ home.html. Retrieved on 5/1/19.
Purdy, R. (2019). A Cost Efficiency Comparison of International Corn, Soybean, and Wheat Production. Available from Dissertations & Theses @ CIC Institutions; ProQuest Dissertations & Theses Global.
![]()
![]()
![]()
![]()
![]()