Anything but Overprediction: USDA Milk Price Forecasts
April 26, 2022
PAER-2022-20
Chad Fiechter, Doctoral Student
![]()
![]()
![]()
![]()
![]()
The forecasting problem
Economics has many classic `problems’, like the consumer problem, the firm problem, or the social planner problem. In each problem, the agent of interest is expected to use scarce resources optimally. Another classic economic problem is the `forecaster problem’. Like consumers trying to maximize utility from income, or the firm trying to maximize profit from a fixed budget, the forecaster tries to use all available information to minimize the difference between forecasted and realized values, or forecast errors (Elliott and Timmermann 2008). Economic theory suggests that a hypothetical consumer systematically values the consumption of goods and services according to a `utility function’. The analog for a forecaster is the `loss function’, instead of maximizing utility, the forecaster tries to the minimize the losses from forecast error.
The rational expectations hypothesis proposed by Muth (1961) is the most commonly used theoretical formalization of the forecaster’s problem. The rational expectations hypothesis implies that rational forecasts will exhibit two properties. First, the forecast will be neither too high or too low consistently, which is labeled unbiased. Second, the forecast will use all available information, which is labeled efficient. There is a common test for both bias and efficiency (Mincer and Zarnowitz 1969). The forecast errors from an unbiased forecast should be too-high just as often as they are too low. An efficient forecast will not have predictable forecast errors. If a forecast is both unbiased and efficient, then it can be considered rational. However, when real forecasts are tested, rationality is commonly rejected. Examples include ag banker’s farmland value forecasts (Kuethe and Oppedahl 2021), USDA price and production forecasts of wheat, corn, and soybeans (Bora, Katchova, and Kuethe 2021), and USDA production forecasts of beef and pork (Von Bailey and Brorsen 1998).
A criticism of the traditional test of the rational expectation hypothesis, is that the forecaster is assumed to experience the same amount of loss for being equally too high (over-prediction) or too low (under-prediction). In other words, the forecaster has a symmetric loss function. However, famous psychologist/economist duo Amos Tversky and Daniel Kahneman (2013) showed that individuals often prefer to avoid losses. Consider a loss or gain of $10, if the negative feelings experienced from losing $10, are more than the positive feelings experienced from finding $10, a person is considered loss averse (Tversky and Kahneman 2013). When a forecaster does not equally experience loss from over-prediction or under-prediction, then their loss function is asymmetric. An asymmetric loss function implies that the forecaster may choose to under-predict or over-predict `rationally’. However, the traditional test would suggest the forecast is irrational. A good example of this scenario is Indiana farmland values. When using the traditional test, Indiana farmland value forecasts appear irrational. However, when Indiana farmland forecasters are assumed to experience more loss from an over prediction than under prediction, the forecasts are rational (Kuethe, Brewer, and Fiechter 2021).
USDA livestock price forecasts
Previously, when the USDA livestock price forecasts were tested for rationality, assuming the forecaster has a symmetric loss function, they were found to be irrational (Sanders and Manfredo 2003; 2007). Our goal is to see if the rejections of rationality were due to theoretically restricting the USDA forecasters to a symmetric loss function. We test the rationality of price forecasts for steers, barrow and gilts, broilers, turkeys, and milk from the USDA World Agricultural Supply and Demand Estimates (WASDE). We use the January, April, July and October WASDE reports from 1995 Q1 to 2020 Q3. In our analysis, we use the mid-point of each forecasted price range.
Using the traditional test with symmetric loss functions, the price forecasts for milk appear irrational. The price forecast for steers, barrows and gilts, broilers and turkeys, on the other hand, appear rational. This result would suggest that USDA forecasters are minimizing symmetric loss functions for steers, barrows and gilts, broilers and turkeys. For milk, we strongly rejected rationality. Therefore, the price forecasts for milk provides an opportunity to see if the rejection of rationality is due to assuming a symmetric loss function. There are two tests for accomplishing our task, the first provides a point estimate for the degree of asymmetry of the loss function (Elliott, Timmermann, and Komunjer 2005). According to this test USDA forecasters find over prediction by 1% to be approximately three times as costly as under prediction. Once the asymmetry parameter is incorporated, the milk price forecast appears rational.
The second test of forecast rationality with asymmetric loss estimates a range of asymmetric loss where the forecast can be considered rational (Guler, Ng, and Xiao 2017). Prior to our results, the reader should understand the most common theorized forecaster loss functions. A forecaster may be minimizing mean absolute forecast error or mean squared forecast error. Mean absolute error considers large and small forecast errors with the same weight. This metric does not penalize a large forecast error more severely than a small error. For example, a 10% forecast error generates only four times more loss than a 2% error. If our hypothetical forecaster uses the mean absolute error framework, we consider their loss function linear. The other metric, mean square error, places an exponential (square or quadratic) weighting on forecast errors. Under mean squared error, a 10% forecast error would generate 24 times more loss than a 2% error. If our hypothetical forecaster uses mean squared error, we consider their loss function quadratic.
Under the assumption of both linear and quadratic loss functions, we find that the USDA milk price forecasters consider over prediction more costly than under prediction. Under linear loss, we find that a 1% over prediction is 1.49 – 3.12 times as costly as a 1% under prediction. With quadratic loss, a 1% over prediction is 1.08 – 4.35 times as costly as a 1% under prediction. Hence, the USDA milk price forecasters are rationally choosing to under-predict, to minimize their loss function.
Figure 1 provides a visual for the estimated range of asymmetry for the milk price forecast. The horizontal dotted lines indicate the extreme values where the milk price forecast can be considered rational. The bolded line below the, 5% significance level dotted line, indicates the range of asymmetry, where the forecast can be considered rational. The center point of the graph (0.50), in either linear or quadratic loss, is the point where the forecast would be considered rational with symmetric loss. To the left of the center point, forecasters would experience more loss from over-prediction than under-prediction. To the right of the center point, forecasters would experience more loss from under-prediction than over prediction. For both linear and quadratic loss, the center point (0.50) is not included in the estimated range where a forecast could be considered rational. Regardless, if we assume that the USDA milk price forecasters use a linear or quadratic loss function, we estimate the forecasters experience more loss from an over prediction than an under prediction.
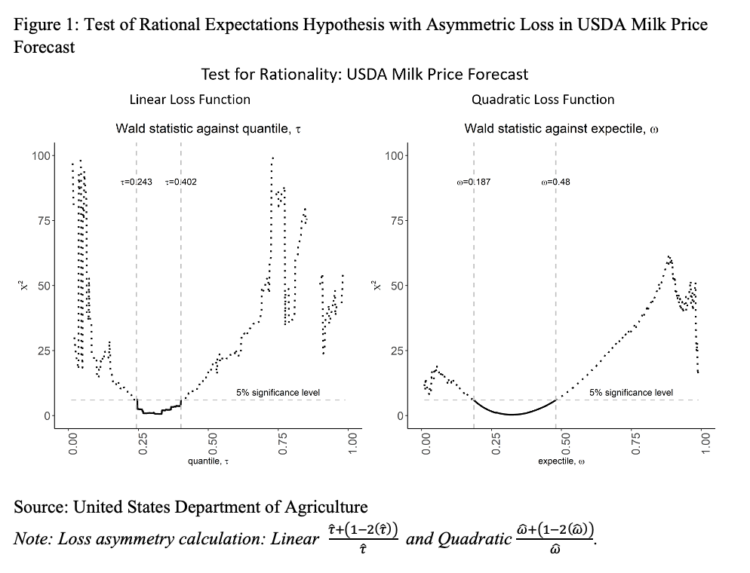
Figure 1: Test of Rational Expectations Hypothesis with Asymmetric Loss in USDA Milk Price Forecast
Source: United States Department of Agriculture
In conclusion, the WASDE price forecasts of steers, barrows and gilts, broilers and turkeys from 1995 Q1 to 2020 Q3 are both unbiased and efficient, or considered rational. However, the USDA milk price forecast, can only be considered rational if we assume that the forecaster’s loss function is asymmetric. If milk is a commodity of lower value, Sims (2003) suggests that a rational forecaster may choose to devote less time to forecasting. However, of the commodities evaluated, milk is the second most valuable. The USDA reports that beef was the most valuable in 2020 at $63.1 billion, followed by milk ($40.7 billion), then broilers ($21.7 billion), barrows and gilts ($18.1 billion), and turkeys ($5.2 billion). Another possible reason for under-predicting milk price could be to protect a large number of dairy farms. However, many more farms are involved in beef production than milk. The only discernable difference between the group of commodities with rational price forecasts and milk, is that the first group are involved in meat production, whereas milk is not a meat product. The reason for the asymmetry in USDA milk price forecaster’s loss function is beyond the intent of our analysis. However, farmers, food manufacturers, and policy makers using the WASDE price forecasts for milk should be aware of this tendency to not over-predict. Specifically, anyone budgeting for milk production or food manufacturing, will be affected by the asymmetry in the USDA forecaster’s loss function. They should expect milk price forecasts to be intentionally low.
Further Reading
Bora, Siddhartha S., Ani L. Katchova, and Todd H. Kuethe. “The rationality of usda forecasts under multivariate asymmetric loss.” American Journal of Agricultural Economics 103, no. 3 (2021): 1006-1033.
Sims, Christopher A. “Implications of rational inattention.” Journal of monetary Economics 50, no. 3 (2003): 665-690.
Elliott, Graham, and Allan Timmermann. “Economic forecasting.” Journal of Economic Literature 46, no. 1 (2008): 3-56.
Elliott, Graham, Allan Timmermann, and Ivana Komunjer. “Estimation and testing of forecast rationality under flexible loss.” The Review of Economic Studies 72, no. 4 (2005): 1107-1125.
Guler, Kemal, Pin T. Ng, and Zhijie Xiao. “Mincer–Zarnowitz quantile and expectile regressions for forecast evaluations under aysmmetric loss functions.” Journal of Forecasting 36, no. 6 (2017): 651-679.
Kuethe, Todd H., Brady Brewer, and Chad Fiechter. “Loss Aversion in Farmland Price Expectations.” Land Economics 98, no. 1 (2022): 98-114.
Kuethe, Todd H., and David Oppedahl. “Agricultural bankers’ farmland price expectations.” European Review of Agricultural Economics 48, no. 1 (2021): 42-59.
Mincer, Jacob A., and Victor Zarnowitz. “The evaluation of economic forecasts.” In Economic forecasts and expectations: Analysis of forecasting behavior and performance, pp. 3-46. NBER, 1969.
Muth, John F. “Rational expectations and the theory of price movements.” Econometrica: Journal of the Econometric Society (1961): 315-335.
U.S. National Agricultural Statistics Service NASS. United States, 2020. Web Archive.
Sanders, Dwight R., and Mark R. Manfredo. “USDA livestock price forecasts: A comprehensive evaluation.” Journal of Agricultural and Resource Economics (2003): 316-334.
Sanders, Dwight R., and Mark R. Manfredo. “Rationality of US Department of Agriculture livestock price forecasts: A unified approach.” Journal of Agricultural and Applied Economics 39, no. 1 (2007): 75-85.
Kahneman, Daniel, and Amos Tversky. “Prospect theory: An analysis of decision under risk.” In Handbook of the fundamentals of financial decision making: Part I, pp. 99-127. 2013.
Von Bailey, Dee, and B. Wade Brorsen. “Trends in the accuracy of USDA production forecasts for beef and pork.” Journal of Agricultural and Resource Economics (1998): 515-525.
![]()
![]()
![]()
![]()
![]()