Consumer Demand for Innovative Healthy Snack in the US
May 10, 2023
PAER-2023-19
Laxmi D. Adhikari, Yizhou Hua, and Yifei Wang, agricultural economics graduate students, and H. Holly Wang, agricultural economics professor
![]()
![]()
![]()
![]()
![]()
- Introduction
Overweight and obesity are growing problems in the world. Among important contributors including diet and eating behaviors, snacking, has become a major component of modern eating behavior (McGill & Appleton, 2009). The US market experienced $135.7 billion in sales of snacks in 2020 (Statista, 2022). Snacks often have low positive nutrients such as protein, vitamins and fiber, and more negative nutrients than regular meals, such as salt, sugar, acrylamide (a possible carcinogen in fried foods) or carbohydrate with empty calories (Baskar & Aiswarya, 2018). Healthier snacks are being developed, such as freeze-dried tofu chips. In this study, we use a choice experiment to find consumer preference for certain attributes of freeze-dried tofu chips, a new, healthy snacking alternative. Literature has reported many benefits of freeze drying, including maximum retention of the original food structure, color, flavor, and nutritional value, not needing to add preservatives to retain freshness, and no acrylamide (Chen et al., 2022).
There is a vast amount of literature about consumer food choice including snacks. Many have examined attributes such as taste, nutrients, satiety, convenience, and country of origin (COO) in making snack purchase decisions (Zbib et al., 2010; Bilman et al., 2010). However, studies show that consumers are more likely to focus on the absence of negative nutrients, such as additives, trans fats, sugar, and genetically modified organisms. Further, these studies also study each attribute independently as if they can be separated. Aside from food attributes, consumers’ own characteristics such as health attitude and social status are also found relevant (Lacy & Huffman, 2016). In contrast, not enough attention has been paid to the presence of positive attributes in snacks, such as freeze drying, new processing technology, nor to consumers’ preference for a healthy lifestyle. Despite the fact that snack product attributes coexist, this factor has been omitted in previous analysis. There is also a lack of analysis on the attribute package approach although some attributes only coexist. To fill these gaps, the objective of this study is to 1) study consumer snack preferences focusing on the positive attributes, like freeze drying; 2) build a model with attribute packages; and 3) include the consumer lifestyle as a characteristic to explain their preference.
- Method
We use a choice experiment to find consumer preference for certain attributes for a new healthy snack product, tofu chips, measured by willingness-to-pay (WTP). Choice experiments are a state-of-the-art method to investigate the stated preference of consumers for hypothetical, new, and/or non-market goods, when the revealed preferences are not available. Based on Lancaster’s random utility theory, an individual obtains a utility, U, through consuming a good from two parts, a deterministic part, V, which is derived from the attributes consumed, and a random part, , determined by unobserved factors.
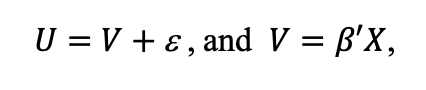 where X is the vector of product attributes and is the associated marginal utility parameters.
Using the mixed logit model, we estimate the coefficients of each attribute of the snack, allowing each consumer to have their own coefficient estimate to account for preference heterogeneity. Then we calculate the WTP for attribute k using the formula, .

Consumers’ WTP for attribute k may be influenced by many factors, such as their demographics, lifestyle and snacking frequency. We conduct a regression analysis on the WTPs.

Using this method, we will be able to quantify how much more or less a consumer would be willing to pay for the freeze-dried tofu chip. This information can be used by companies or policy makers to guide the pricing or regulation of future snacking.
- Data and descriptions
Data for this study were collected in June 2022 through online survey by a global survey company, Dynata. The sample includes 1000 respondents from two major metropolitans, New York and Chicago. Unlabeled choice experiments for Tofu chips are administered to the respondents. They are offered two alternative Tofu chips for them to either buy one or not buy either.
Each alternative product is labeled with a price, a healthiness package, a COO, and a taste level. The particular levels are determined by an optimal efficiency experiment design from the preset levels. The healthiness package attribute has four levels, namely 1) Fried (120 calories, non-keto or vegan); 2) Freeze dried (50 calories, non-keto or vegan); 3) Vegan (freeze dried, 50 calories, non-keto, vegan); and 4) Keto (freeze dried, 50 calories, keto, non-vegan). The taste attribute has three levels, not crunchy, crunchy and very crunchy, and the COO is either imported or domestic. Prices of $ 6.5, $ 8 and $9.9 per bag are considered. The imported, fried and not crunchy product is used as the base and the WTP premium for each attribute is calculated.
Demographic and economic information including consumer’s gender, age, household size, education level, employment status, and annual income is collected. How active a respondent’s lifestyle is measured by the categories of athletic, active, medium and low, as well as the snacking frequency have also been collected. Descriptive statistics is presented in Table 1. The mean age of respondents in our sample is 45.54 years and the mean years of schooling is 15.09, almost with a college degree. There is an almost equal percentage of males and females. Nearly half of the respondents lead a medium active lifestyle, about a third consider themselves active, while nearly one fifth are not active. The average snacking frequency is 1.77 times a day.
Table 1: Descriptive statistics
| Variables | Mean/Percentage |
| Age (years) | 45.54 |
| Gender (%) | |
| Male | 48.20 |
| Female | 51.80 |
| Education (years of schooling) | 15.09 |
| Income ($1000) | 87.15 |
| Lifestyle (%) | |
| Athletic (e.g., CrossFit, body build, training for Marathon etc.) | 5.70 |
| Active (e.g., regular gym visits, hiking trips, having physical job) | 29.70 |
| Medium (e.g., walking chores, gardening, dog walking, frequent walks) | 45.30 |
| Not active (minimal activities) | 19.30 |
| Snack consumption frequency in a day | 1.7662 |
- Results
4.1 Willingness to pay estimation
We estimate a mixed logit model in Stata version 17 and calculate mean WTP. Our results are presented in Table 2. All the coefficients are statistically significant and in line with consumer theory. With the increase in price of snack, consumer utility is decreasing. Similarly, the choice to not consume tofu chips (optout) has a negative and significant effect on the utility. However, the utility increases if the chips are:, freeze dried, vegan, keto, crunchy, or very crunchy and produced domestically.
Table 2: Parameter estimates from the mixed logit model and willingness to pay
| Variables | Mean Coefficients | Standard Deviation Coefficients | Mean WTP ($) |
| Price | -.1714***
(.0323) |
NA | |
| Optout | -3.0524***
(.2948) |
NA | |
| Freeze dried | 1.6657***
(.1249) |
1.033575***
(.0741163) |
19.70 |
| Vegan | 1.8536***
(.1324) |
1.120123***
(.0754144) |
21.90 |
| Keto | 1.7153***
(.1232) |
-.5205058***
(.0827037) |
20.25 |
| Crunchy | .9249***
(.1013) |
.7088535***
(.0698975) |
10.80 |
| Very crunchy | .9667***
(.0971) |
.6294685***
(.0782844) |
11.42 |
| US origin | .3846***
(.0493 ) |
.590675***
(.083168) |
4.40 |
| Number of observations | 12000 | ||
Standard errors in parentheses, *** p<0.01, ** p<0.05, * p<0.1
We have estimated WTP for six different attributes of tofu chips. An average respondent is willing to pay $19.70 more for a bag of tofu chips that is freeze dried with 50 calories than for a bag of chips that is fried with 120 calories. The WTP premium becomes $21.90 for vegan and $20.25 for keto, both of which are freeze dried with 50 calories. This means the freeze dry attribute has a value much higher than fry, while the additional keto or vegan only brings a small premium. We also find that crunchiness is an important sensory attribute to consumers, as they are willing to pay $10.80 higher than the not crunchy ones, while this value has a small increase to $11.42 for extra crunchiness. These results confirm that consumers value the health features brought by freeze drying and the sensory feature of crunchiness. COO is also an important factor for consumers of tofu chips, as they show a $4.40 price premium for domestic above imported products.
In additional to the means, the density curves of all six WTPs are represented Figure 1. Vegan, freeze dried, and keto WTPs have similar distributions. They all have a wide range, suggesting that consumer preferences are highly variable or are willing to pay different prices for the same attributes. Values range from negative $40 to positive $60. The negative values show some respondents prefer fried over freeze dried. The WTP for the US origin curve shows bimodal distribution with one peak at zero and the other at around ten. It shows one group of consumers is indifferent to the COO, whereas the other group prefers domestic products. Similarly, crunchy and very crunchy show dichotomized preferences on this sensory attribute, with one group caring more than the other. These attributes have less heterogeneity.
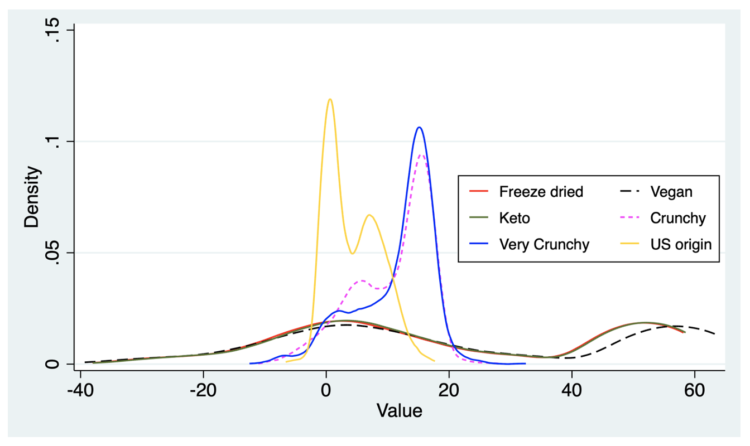
Figure 1 Density plot of willingness to pay
4.2 Factors Influencing Willingness to Pay
In order to better understand the consumer characteristics driving our WTP results, we utilized regression analysis. Our estimated results of WTP for four different attributes, namely freeze dried, crunchy, very crunchy, and US origin are presented in Table 3 (as the keto and vegan WTPs are very similar to freeze dried). All four models include the same explanatory variables, and the consistent results are that the WTP heterogeneity comes only from the lifestyle variables. Interestingly, our results show that consumers who engage in vigorous exercise (athletic) are willing to pay $12 less for a freeze dried than the medium active group people, while both groups are willing to pay more for freeze dried than fried. This indicates they accept snacks with higher calorie content compared to those who do not exercise much. One possible reason for this could be that individuals who engage in vigorous exercise may perceive that they burn a large amount of energy and need the calories. The not active group has the highest WTP, $9 more than the base group, for freeze dry for the same reason but in the opposite way. Snack frequency contributes to WTP for freeze dry positively, $1 for each more time snacking in a day, which can be explained that those who consume more snacks know they need to eat more healthily.
For the sensory attributes crunchy and non-crunchy, the less active the consumers are, the higher WTP premiums they have, indicating sensory enjoyment is more important to the less active consumers. While the WTP for US origin, a sign of quality, shows a different pattern. The most active people care most, about $1.8 higher than the base group, while the least active people pay $1.2 lower than the base group.
Table 3: Willingness to pay regression results
| Model 1 | Model 2 | Model 3 | Model 4 | |
| Variables | Freeze dry | Crunchy | Very Crunchy | US origin |
| Gender | -1.1128 | 0.0567 | -0.0332 | 0.2513 |
| (1.6030) | (0.3953) | (0.3929) | (0.2744) | |
| Age | -0.0126 | -0.0055 | -0.0007 | -0.0012 |
| (0.0485) | (0.0120) | (0.0119) | (0.0083) | |
| Education | 0.0239 | 0.0405 | -0.0189 | -0.0381 |
| (0.3949) | (0.0974) | (0.0968) | (0.0676) | |
| Income | -.0089 | -.0034 | -.0026 | .0018 |
| (.0140) | (.0034) | (.0034) | (.0024) | |
| Lifestyle | ||||
| Athletic | -12.7469*** | -3.1480*** | -4.2120*** | 1.8086*** |
| (3.5191) | (0.8678) | (0.8625) | (0.6024) | |
| Active | -7.4307*** | -2.1796*** | -2.3501*** | 1.0123*** |
| (1.8744) | (0.4622) | (0.4594) | (0.3209) | |
| Not active | 8.9722*** | 1.0467** | 0.6598 | -1.1690*** |
| (2.1610) | (0.5329) | (0.5296) | (0.3699) | |
| Snack frequency in a day | 1.4733* | 0.0570 | 0.0084 | -0.0313 |
| (0.7993) | (0.1971) | (0.1959) | (0.1368) | |
| Constant | 19.8229*** | 11.2316*** | 12.7758*** | 4.6073*** |
| (6.3048) | (1.5547) | (1.5452) | (1.0792) | |
| Observations | 1,000 | 1,000 | 1,000 | 1,000 |
| R-squared | 0.0650 | 0.0472 | 0.0547 | 0.0399 |
Standard errors in parentheses, *** p<0.01, ** p<0.05, * p<0.1
- Conclusion
Snacks are convenient foods that supplement meals for the special needs of today’s busy professionals, people engaging in vigorous exercises, and raising children. Consumers’ welfare can be improved by having the option of healthier snacks that have long shelf life and good sensory attributes. This study provides empirical evidence on the preference of US consumers for these new, healthy snacks. Overall, results show that, on average, there exists a high willingness to pay for freeze dried tofu chips that have lower calories and higher protein than their fried counterparts, with a large variance. US consumers value the crunchiness sensory attribute and snacks that are produced domestically, potentially due to this factor being a quality indicator. Consumers leading an active lifestyle care more about quality, while those consumers leading an inactive lifestyle care more about calories and tastes. For tofu chips, a single plant-based snack, keto and vegan make a small difference. Professionals in the food processing industry, health societies, and health-conscious consumers should benefit from these findings.
References
Baskar, G., & Aiswarya, R. (2018). Overview on mitigation of acrylamide in starchy fried and baked foods. Journal of the Science of Food and Agriculture, 98(12), 4385–4394. https://doi.org/10.1002/jsfa.9013
Bilman, E. M., Trijp, J. C. M., & Renes, R. J. (2010). Consumer perceptions of satiety-related snack food decision making. Appetite, 55, 639–647.
Chen, K., Zhang, M., Bhandari, B., Sun, J., & Chen, J. (2022). Novel freeze drying based technologies for production and development of healthy snacks and meal replacement products with special nutrition and function: A review. Drying Technology, 40(8), 1582–1597. https://doi.org/10.1080/07373937.2021.1967375
Lacy, K., & Huffman, W. E. (2016). Consumer Demand for Potato Products and Willingness-to-Pay for Low-Acrylamide, Sulfite-Free Fresh Potatoes and Dices: Evidence from Lab Auctions. Journal of Agricultural and Resource Economics, 41(1), 116–137.
McGill, R., & Appleton, K. M. (2009). Reasons for snack food choice and the prevalence of fruit snacking in Northern Ireland. The Proceedings of the Nutrition Society, 68(OCE3). https://doi.org/10.1017/S0029665109991005
Statista. (2022). Topic: U.S. snack foods industry. Statista. https://www.statista.com/topics/1496/snack-foods/
Zbib, I. J., Wooldridge, B. R., Ahmed, Z. U., & Benlian, S. (2010). Selection criteria of Lebanese consumers in the global snack food industry: Country of origin perceptions. Journal of Consumer Marketing, 27(2), 139–156. https://doi.org/10.1108/07363761011027240
![]()
![]()
![]()
![]()
![]()