The Iran Conflict and Global Food Security: Why the Burden Falls Hardest on the World’s Most Vulnerable
March 31, 2026
PAEPB-2026-03
Ken Foster, Professor of Agricultural Economics and Director, Purdue Farm Policy Study Group; Bernhard Dalheimer, Assistant Professor of Macroeconomics and Trade
![]()
![]()
![]()
![]()
![]()
Key Takeaways
-The Iran conflict’s energy shock is fundamentally regressive: it falls hardest on the countries and consumers least equipped to absorb it, while wealthier buyers can outbid poorer ones for scarce food commodities.
-Because transport costs are a large portion of producer costs in low- and middle-income countries, oil-supply shocks raise farm-to-consumer prices in these regions much more severely than in high-income countries
-Low-income country households spend roughly 52 percent of income on food — meaning a 10 percent food price increase costs the equivalent of a 5 percent income cut. High-income households face a fraction of that burden.
-Global grain markets are “thin”: only 25 percent of wheat, 14 percent of corn, and 10 percent of rice production crosses international borders. Small supply or demand disruptions produce outsized price swings that fall disproportionately on import-dependent developing countries.
-A dangerous dollar double-whammy hits low-income food importers: commodity prices rise in U.S. dollar terms while geopolitical crisis simultaneously strengthens the dollar — amplifying the real cost in local currency.
-Export restrictions by major producing countries — a reflexive self-protective response that historically follows food price shocks — further thin global markets and accelerate price spikes, hitting the most import-dependent countries hardest.
-The humanitarian pipeline is directly strained: WFP warns that at least 318 million people at immediate risk of hunger face worse outcomes as rising fuel and commodity prices reduce the volume of food aid the same dollar budget can deliver.
A Shock That Is Felt Unequally Around the World
When an energy shock ripples out from the Persian Gulf, the headlines focus on oil prices, gasoline costs, implications for value chains and the profit margins of U.S. producers. While these are all important concerns, there is also a larger distributional story at work. For consumers and farmers in wealthy countries, the Iran shock represents a meaningful but relatively manageable cost increase, cushioned by high incomes, diversified supply chains, strong currencies, and institutional safety nets. For their counterparts in low-income countries, the same shock arrives as a potentially more severe blow to food security, delivered through multiple compounding channels simultaneously and with little cushion to absorb it.
Critically, the Iran conflict is an oil-supply shock driven by shipping-lane disruptions, production risks, and precautionary withdrawals from the Strait of Hormuz. In contrast to oil demand shocks, for instance, driven by accelerating global growth, oil supply shocks affect low-income countries’ food supply much more strongly than high-income countries’, with far-reaching implications for food security. In low- and middle-income countries, transportation costs constitute a far larger share of final food prices than in high-income countries. In such markets, food travels long distances over poor infrastructure, where cold chains are absent and intermediation costs are high; consequently, a fuel price spike raises the farm-to-consumer margin more severely than in integrated, logistics-efficient food systems. Oil supply shocks, therefore, arrive with a structural bias in that they hit the food systems of low-income countries through a cost channel that is disproportionately large relative to their incomes, independent of the commodity price increase itself.
The economic mechanism driving this inequality is straightforward: food markets are global, but the ability to pay for food is local. When an energy shock tightens supplies and raises commodity prices on world markets, the commodity goes to whoever bids highest. Wealthy buyers — whether nations or individual consumers — can afford to bid more. Poorer buyers are systematically outcompeted. The result is that the same supply shock redistributes food access from low-income to high-income market participants. The
Food as Income: Why Price Increases Hit Harder at the Bottom
On the consumer side, the most fundamental difference between how a food price shock affects a low-income household in sub-Saharan Africa and an upper-middle-income household in a European or North American city is the share of total income that must be spent on food. FAO and World Bank data document this gradient with stark clarity.
In low-income countries, households spend approximately 52 percent of their income on food — a figure consistent with the international benchmark used by FAO, which requires that a household earn at least twice the cost of a healthy diet to also meet basic non-food needs. In high-income countries, food expenditures average around 10 to 12 percent of household income, and in the United States specifically, approximately 8 to 9 percent.
The welfare arithmetic of a food price shock flows directly from this disparity. A 10 percent increase in food prices costs a low-income country household the equivalent of a 5.2 percent reduction in total real income — before any consideration of whether substitute foods exist or whether the household has savings to draw on. The same 10 percent food price increase costs a high-income household roughly 1 percent of real income. What constitutes an inconvenience for one household is experienced as a serious nutritional and economic crisis in the other. As noted in the 2024 State of Food Security and Nutrition report, in low-income countries, 71.5 percent of the population already cannot afford a healthy diet at prevailing prices. This shock arrives on top of that structural deficit.
Figure 1
Food as Share of Household Income by Country Income Group
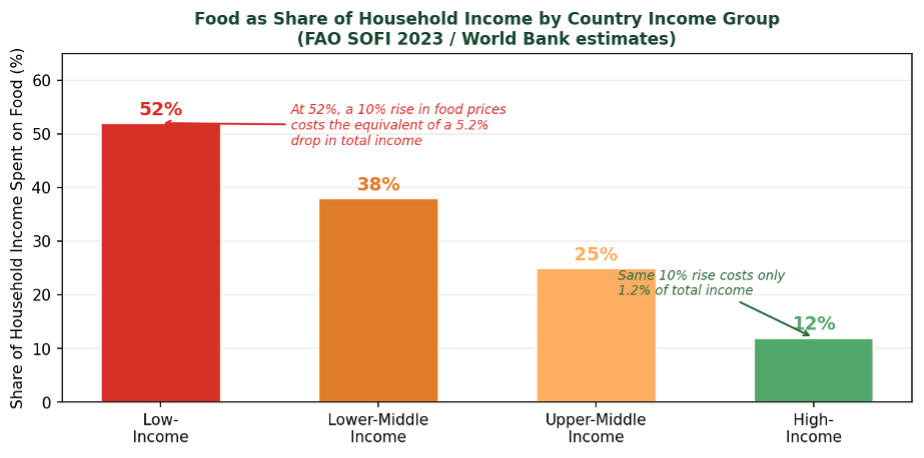
Share of household income spent on food by country income group. Low-income country households allocate approximately 52 percent of income to food expenditure. A 10 percent rise in food prices delivers a welfare blow equivalent to a 5.2 percent income cut in low-income settings, compared to roughly 1.0–1.2 percent in high-income countries. Sources: FAO State of Food Security and Nutrition in the World (SOFI) 2023; World Bank International Comparison Program; ScienceDirect / Headey et al. (2024).
Thin Markets: Small Shocks, Large Price Swings
A structural feature of global agricultural trade amplifies price volatility beyond what the physical supply situation alone would suggest: most food is consumed where it is grown. UNCTAD data confirm that only about 25 percent of global wheat production, 14 percent of maize, and 10 percent of rice crosses international borders in any given year. Vegetable oils and soybeans are more heavily traded at roughly 37–38 percent.
The implications of this “thin markets” reality for price dynamics are profound. When a large supply or demand shock hits world markets — whether from a conflict closing shipping lanes, an export ban by a major producing country, or a precautionary buying surge by importing nations — prices must adjust dramatically to clear a market where only a fraction of global production is available for reallocation. A five percent reduction in global wheat exports, for example, does not cause a five percent price increase; it can cause a price spike many times that size as available supplies are rationed among competing buyers.
Developing-country food importers are fully exposed to these world market price swings in a way that wealthy domestic producers and self-sufficient countries are not. UNCTAD data show that Egypt imports approximately 56 percent of its wheat consumption. Countries in Western Africa and the Middle East are even more heavily import-dependent for cereals. When world wheat prices spike — as they did toward a two-year high in the days following the conflict’s onset — those purchases must be made at the new, elevated price, in U.S. dollars, with currencies that are often themselves weakening against the dollar in the flight-to-safety flows that accompany geopolitical crises.
Figure 2
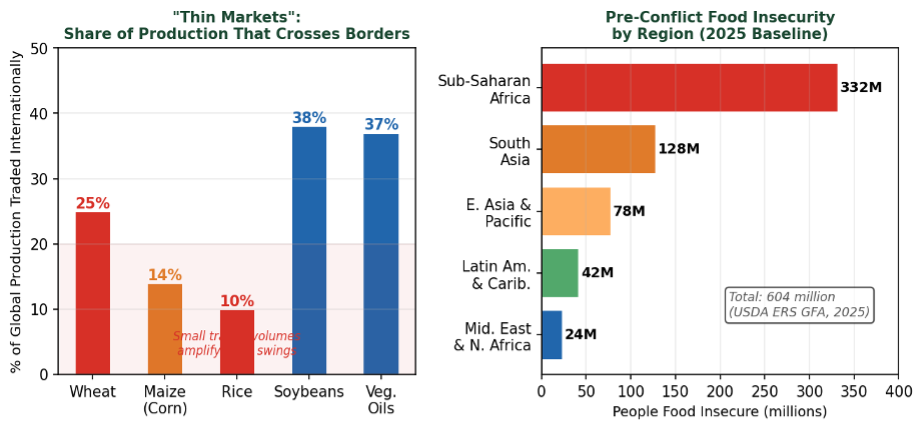
Figure 2. Left: Share of global production of major commodities that crosses international borders annually (“thin markets”). Rice (10%), maize (14%), and wheat (25%) are particularly thinly traded, meaning even modest supply disruptions produce large price swings on world markets. Right: Pre-conflict food insecurity baseline by region (2025, USDA ERS Global Food Assessment). Sub-Saharan Africa’s 332 million food-insecure people represent the largest and most vulnerable population entering this shock. Sources: UNCTAD (2025); USDA ERS Global Food Assessment, 2025–35.
The Dollar Double-Whammy: Currency Amplification
Agricultural commodity prices — wheat, corn, soybeans, vegetable oils, and fertilizers — are traded in U.S. dollars. For a country that earns income in Nigerian naira, Egyptian pounds, Pakistani rupees, or Ethiopian birr, the real cost of food imports depends on two things: the dollar commodity price, and the exchange rate between the local currency and the dollar.
External geopolitical crises have historically tended to strengthen the U.S. dollar as investors seek the relative safety of dollar-denominated assets — a pattern that repeated in the early days of the current conflict. In principle, as the dollar appreciates, non-U.S. buyers face higher local-currency costs, which dampens their demand and puts some downward pressure on world prices. Under normal conditions, this negative correlation between dollar strength and commodity prices provides commodity-importing countries with a partial hedge. The Iran conflict, however, short-circuits that mechanism because commodity prices are rising simultaneously from a supply-side disruption.
. The consequence for food-importing developing countries is a double whammy: the dollar price of the commodity rises at precisely the same moment that the local currency needed to buy those dollars weakens. A country whose currency depreciates 10 percent against the dollar while world wheat prices rise 15 percent faces a 26 percent increase in the local-currency cost of wheat imports — substantially more than either shock alone.
In fact, USDA ERS has explicitly identified currency depreciation as a compounding vulnerability, noting that weak currencies are expected to reduce purchasing power for countries that rely on imports, with Sub-Saharan Africa particularly affected. This currency transmission channel helps explain why food price shocks in global markets are systematically larger in local-currency terms for the countries least able to absorb them.
The Policy Feedback Problem: Export Restrictions
One of the most reliably harmful responses to global food price spikes — and one that history shows reliably occurs — is the imposition of export restrictions by major producing and exporting nations. When domestic food prices rise, and political pressure builds to protect consumers, governments frequently impose tariffs, quotas or outright bans on agricultural exports. The intent is to keep domestic food affordable. The effect, at the global level, is to further thin already thin world markets, accelerating the very price spike that motivated the restriction.
The historical record is well-documented. During the 2007–08 food crisis, over 30 countries imposed export restrictions on staple foods. India restricted rice exports. Argentina taxed soy and wheat. Smaller producers from Vietnam to Kazakhstan followed suit on their key commodities. UNCTAD estimates that in 2020, during the COVID period of supply chain anxiety, about 25 countries imposed some form of food export restriction. In the 2022 Ukraine crisis period, similar restrictions proliferated.
The distributional impact of export restrictions is again highly regressive. Domestic consumers in the restricting country benefit modestly. But countries that rely heavily on those exports — typically low-income import-dependent nations — face sharply reduced availability and higher prices. The political economy is understandable; the global welfare consequences are severe and concentrated on the world’s most food-insecure populations. In the current situation, the incentive for major wheat and grain exporters to impose restrictions will intensify as domestic prices rise, creating a feedback loop that worsens the shock for the countries least able to withstand it.
The Compounding Disadvantage of Low-Income Country Farmers
The asymmetry does not only affect consumers. Smallholder and low-income-country farmers face a structurally worse set of options in response to input-cost shocks than their counterparts in the United States or other wealthy agricultural economies.
In the United States, farmers facing higher fertilizer prices can reduce application rates, shift acreage toward nitrogen-fixing soybeans, access short-term operating credit to bridge higher input costs, or rely on crop insurance and commodity programs as safety nets. These adaptive options exist because of well-developed input and credit markets, strong agricultural extension systems, and government risk management programs built over decades.
Smallholder farmers in Sub-Saharan Africa, South Asia, and parts of Latin America face the same spike in fertilizer and fuel prices, but with far fewer adaptive resources. Government expenditure on agriculture in low-income countries averages only about $8 per rural inhabitant, according to FAO SOFI 2024 — a level described as insufficient to address even pre-existing drivers of food insecurity. Credit markets for smallholders are shallow or absent. Input subsidies, where they exist, are often underfunded and administratively fragile. And the ability to shift crop mix is constrained by factors ranging from land tenure to water availability to the limited availability of alternative seeds and technical knowledge.
The result is that higher input prices are more likely to produce genuine yield reductions in low-income country agriculture than in wealthier farm sectors. The adaptive response that partially corrects the cost shock for U.S. farmers — reducing application rates but eventually seeing output prices rise to compensate — is a partial and delayed remedy in wealthy agricultural systems. In many lower-income settings, the yield loss is more immediate, output-price compensation is less reliable, and the household-level welfare consequences of reduced harvests are more direct and severe.
The Humanitarian Pipeline Under Pressure
One of the most direct and immediately quantifiable global consequences of the Iran conflict’s energy shock is its impact on the capacity of the international humanitarian food system to respond to the needs it already faces — let alone the expanded needs the conflict will create.
The World Food Programme entered 2026 with a stated need of $13 billion to reach 110 million vulnerable people, against a backdrop of major donor funding reductions that had already forced it to cut operations and lay off approximately 6,000 staff. The Iran conflict compounds this pre-existing funding crisis in two distinct ways.
First, WFP procures food commodities on world markets. Higher wheat, vegetable oil, and commodity prices directly reduce the volume of food that a given budget can purchase. As WFP’s deputy executive director stated in response to the conflict: “For the same money, you get less.” Second, WFP’s logistics and transport costs — already substantial, given an operational fleet of up to 5,000 trucks, 80 aircraft, and 20 ships at any one time — rise directly with fuel prices. A conflict-driven disruption to the Strait of Hormuz is already forcing WFP to reroute supply chains: its standard Sudan procurement route from India through Salalah and Jeddah to Port Sudan has been extended by 9,000 kilometers, adding approximately 25 days to delivery times and materially increasing per-ton costs.
The humanitarian math is unforgiving. WFP warns that at least 318 million people are at immediate risk of acute hunger going into this crisis. Sub-Saharan Africa alone accounts for 332 million food-insecure people in the USDA ERS baseline. The countries most likely to see humanitarian needs escalate — Sudan, Ethiopia, Somalia, Yemen, Afghanistan, and Lebanon — are precisely the ones where WFP’s operational costs are rising fastest and where the energy-driven commodity price shock arrives with no domestic buffer.
Figure 3
Relative Exposure to the Iran Energy Shock: Low-Income vs. High-Income Countries (Illustrative composite: ratio labels show low-income multiple)
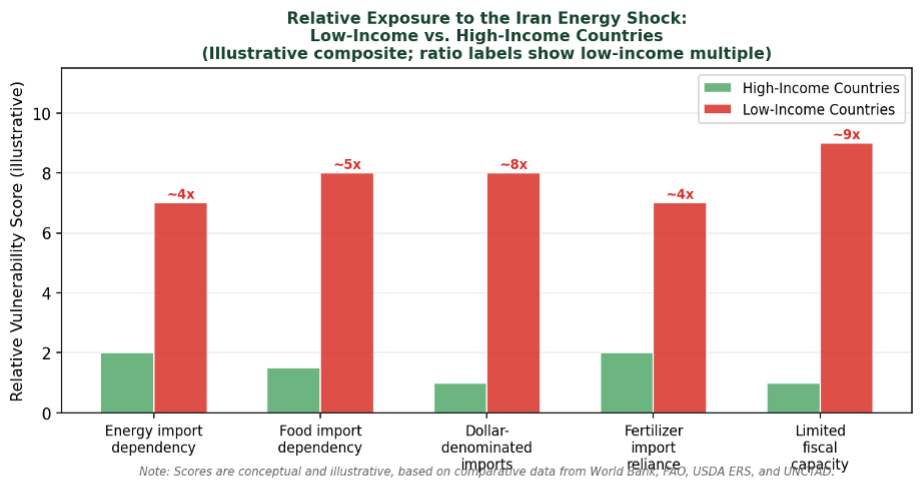
Relative exposure to the Iran energy shock across five vulnerability channels, comparing low-income and high-income countries. Ratio labels indicate the approximate multiple by which low-income country exposure exceeds that of high-income countries on each dimension. The composite disadvantage across all five channels explains why the same global price shock produces vastly different welfare outcomes by income group. Note: Scores are conceptual and illustrative, based on comparative data from World Bank, FAO, USDA ERS, and UNCTAD; they do not represent a formal index.
What Duration Means for Global Food Security
As with the domestic analyses, the duration of the Strait of Hormuz disruption is the single most important variable for the global food security outlook. The two historical episodes most relevant for calibration — the 2007–08 global food crisis and the 2022 Ukraine shock — both took six to twelve months to fully propagate their food price effects through global supply chains and into the national food baskets of import-dependent countries.
A short conflict, resolved within four to six weeks with the Strait reopening before spring planting is complete, is unlikely to produce a sustained global food price shock of the kind that significantly worsens nutrition outcomes in vulnerable countries. Commodity price spikes during brief disruptions have historically reversed, and stored grain inventories in major importing countries provide a buffer of several months. The June 2025 twelve-day conflict left no measurable impact on global food security indicators.
A prolonged conflict — extending through the Northern Hemisphere planting season and into the summer harvest — is a materially different scenario. In that case, the convergence of higher fertilizer costs (reducing yields), sustained shipping disruptions (raising logistics costs for all traded commodities), elevated biofuel demand competing with food uses for grains and oils, and the reflexive export restriction response by producing countries could combine to drive a sustained global food price shock broadly analogous to 2022 in its structure, though likely less severe in magnitude given the absence of a direct grain supply disruption comparable to the loss of Ukrainian exports.
The countries that enter that scenario already at the margins — Sudan, Somalia, Afghanistan, Yemen, Haiti, and others identified in the WFP 2026 Global Outlook — face not a price inconvenience but a potential nutritional emergency. For those populations, the question of whether a conflict in the Persian Gulf lasts four weeks or four months is not an abstraction. It is measured in caloric deficits, childhood malnutrition rates, and humanitarian mortality. That is the full human dimension of what the headline number “$110 per barrel” means for global food and agriculture.
References and Data Sources
UN and Multilateral Organization Sources
World Food Programme (WFP). (2025). WFP 2026 Global Outlook: Hunger and Hope. Rome: WFP. https://www.wfp.org/publications/wfp-global-outlook
(2026, March 8). “WFP warns rising food and fuel prices risk pushing global hunger higher as humanitarian needs grow.” https://www.wfp.org/news/wfp-warns-rising-food-and-fuel-prices-risk-pushing-global-hunger-higher-humanitarian-needs
(2026, March 12). “How the Middle East conflict is fueling hunger as WFP scales up assistance.” https://www.wfp.org/stories/how-middle-east-conflict-fuelling-hunger-wfp-scales-assistance
UN News. (2026, March 13). “Aid operations strained across Middle East: WFP seeks $200 million to sustain food assistance.” https://news.un.org/en/story/2026/03/1167121
FAO, IFAD, UNICEF, WFP, and WHO. (2024). The State of Food Security and Nutrition in the World 2024 (SOFI). Rome: FAO. https://knowledge4policy.ec.europa.eu/publication/state-food-security-nutrition-world-2024-sofi_en
(2025). The State of Food Agriculture 2025. Rome: FAO.
Food and Agriculture Statistics. https://www.fao.org/faostat/
FSIN and Global Network Against Food Crises. (2025). Global Report on Food Crises 2025. https://www.fightfoodcrises.net/report/global-report-food-crises-2025/
(2025). “Exploring trade actions to fight acute food insecurity and the threat of famine.” https://unctad.org/news/exploring-trade-actions-fight-acute-food-insecurity-and-threat-famine
USDA and U.S. Government Sources
USDA Economic Research Service. (2025). Global Food Assessment (GFA), 2025–35. ERS Report. https://ers.usda.gov/sites/default/files/_laserfiche/publications/113294/GFA-36.pdf
USDA ERS. (2024, September). “Global Food Security Improves in 2024 With Higher Incomes and Lower Inflation.” Amber Waves. https://www.ers.usda.gov/amber-waves/2024/september/global-food-security-improves-in-2024-with-higher-incomes-and-lower-inflation
USDA ERS. (2025). “Global food security strengthens in 2025 with rising incomes and easing food inflation.” Charts of Note. https://www.ers.usda.gov/data-products/charts-of-note/chart-detail?chartId=113236
WTO and International Grains Council. Wheat Maritime Trade and Food Security Dashboard. https://globaltradedata.wto.org/real-time-data-based-on-non-wto-data-sources
Academic and Research Sources
Stehl, J., Depenbusch, L., and Vollmer, S. (2025). “Global poverty and the cost of a healthy diet.” Food Policy. https://www.sciencedirect.com/science/article/pii/S0306919225000533
World Bank Food Security Portal. (2024). “Food security trends in 2024 and beyond.” https://blogs.worldbank.org/en/agfood/food-security-trends-2024-and-beyond
World Bank Food Security Update. (2024). Monthly updates on global food price inflation by income group. https://thedocs.worldbank.org/en/doc/40ebbf38f5a6b68bfc11e5273e1405d4-0090012022/related/Food-Security-Update-CV-April-25-2024.pdf
Glauber, J., and Laborde, D. (2022). “How will Russia’s invasion of Ukraine affect global food security.” IFPRI Blog. https://www.ifpri.org/blog/how-will-russias-invasion-ukraine-affect-global-food-security
(2025). “Addressing climate change risks in import dependent and major food producing countries.” https://www.iatp.org/climate-change-risks-food-trade
(2003). World Agriculture: Towards 2015/2030. Chapter 8: Crop and livestock products. Rome: FAO. https://www.fao.org/4/y3557e/y3557e08.htm
Dalheimer, B, Herwartz, H. and Lange, A. (2021). The threat of oil market turmoils to food price stability in Sub-Saharan Africa. Energy Economics. 93, 105029. DOI:10.1016/j.eneco.2020.105029
Current Events and Conflict-Specific Sources
The National. (2026, March 10). “Iran war will raise cost of food and hit struggling humanitarian groups, WFP warns.” https://www.thenationalnews.com/news/mena/2026/03/10/iran-war-will-raise-cost-of-food-and-hit-struggling-humanitarian-groups-wfp-warns/
Lu, C. (2026, March 9). “Iran War Promises Even More Pain for Farmers.” Foreign Policy. https://foreignpolicy.com/2026/03/09/trump-iran-war-strait-hormuz-fertilizer-food-prices/
PBS NewsHour. (2026, March 10). “War with Iran delivers high oil prices and another shock to the global economy.” https://www.pbs.org/newshour/world/war-with-iran-delivers-high-oil-prices-and-another-shock-to-the-global-economy
Al Jazeera Staff. (2026, March 10). “Gaza food prices soar as crossing closures deepen shortages amid Iran war.” https://www.aljazeera.com/news/2026/3/10/gaza-food-prices-soar-as-border-closures-deepen-shortages-amid-iran-war
The Purdue Farm Policy Study Group | Department of Agricultural Economics | Purdue University
![]()
![]()
![]()
![]()
![]()