Corn and Soybean Outlook
March 23, 2026
PAER-2026-09
Author: Mindy Mallory, Associate Professor, Clearing Corp Endowed Chair in Food & Agricultural Marketing
![]()
![]()
![]()
![]()
![]()
Price Situation
Corn and soybean prices have been trending lower since recent highs seen in the 2023 marketing year (MY). Figure 1 shows that production has been near all-time highs the last couple of years, with solid harvested acres and good yields providing bumper crops in the U.S. Corn and soybeans both need a reason to rally – either a strong demand push or a supply crunch coming from the U.S. or Brazil. Without one or the other, prices look to remain frustratingly low for producers.
Figure 1
Corn and Soybean Marketing Year Average Prices and Production 2020-2025
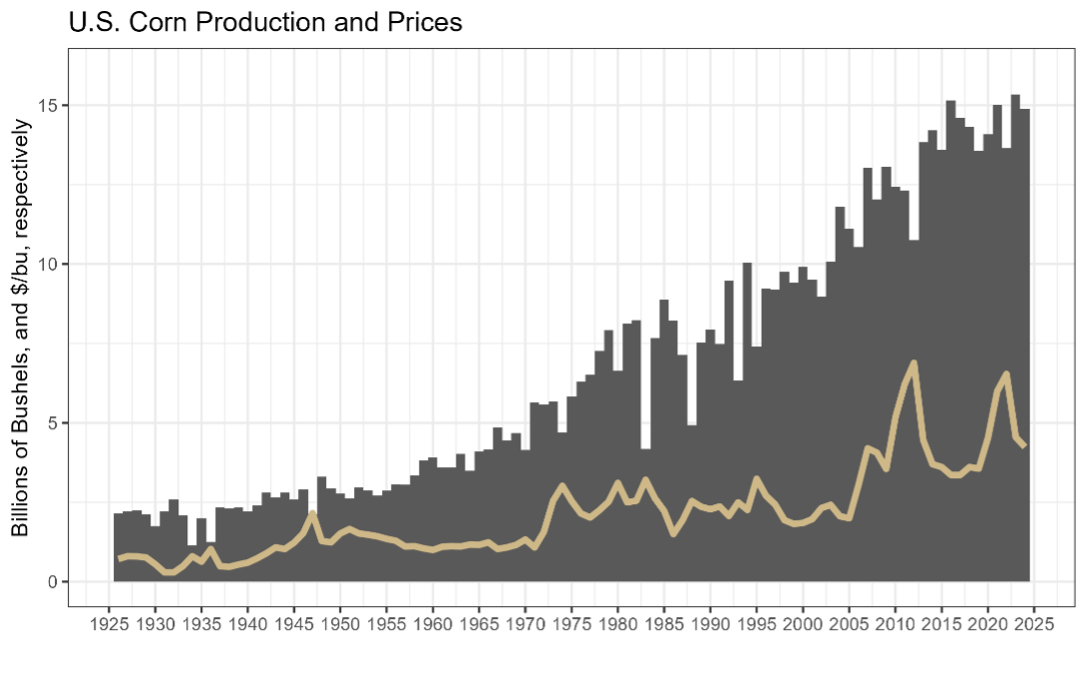
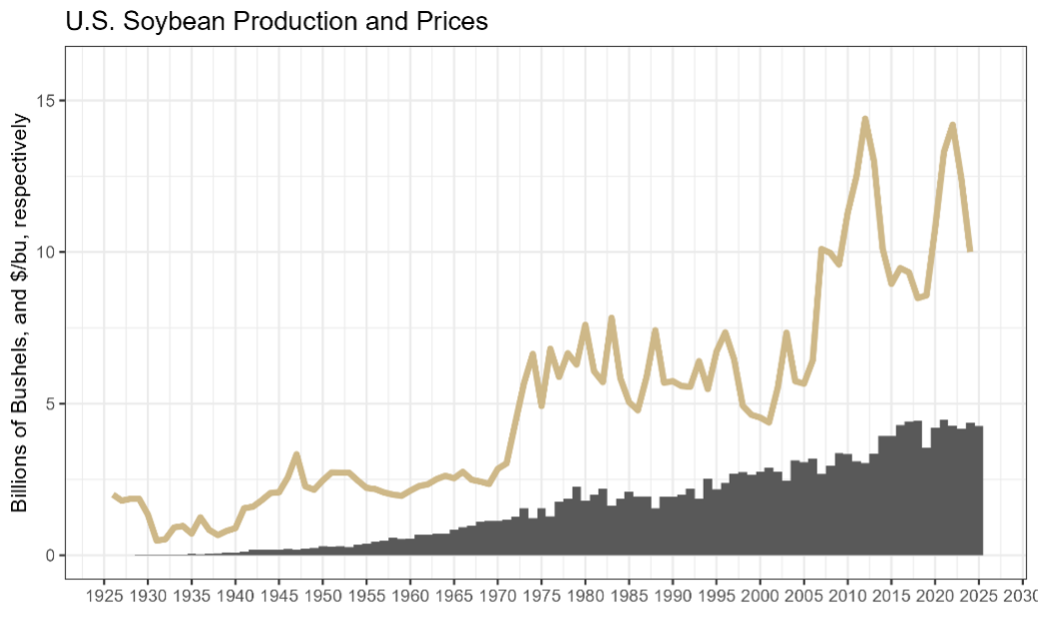
Note: Prices represented by the gold line and production represented by the grey bars
Big Expected Production in Brazil
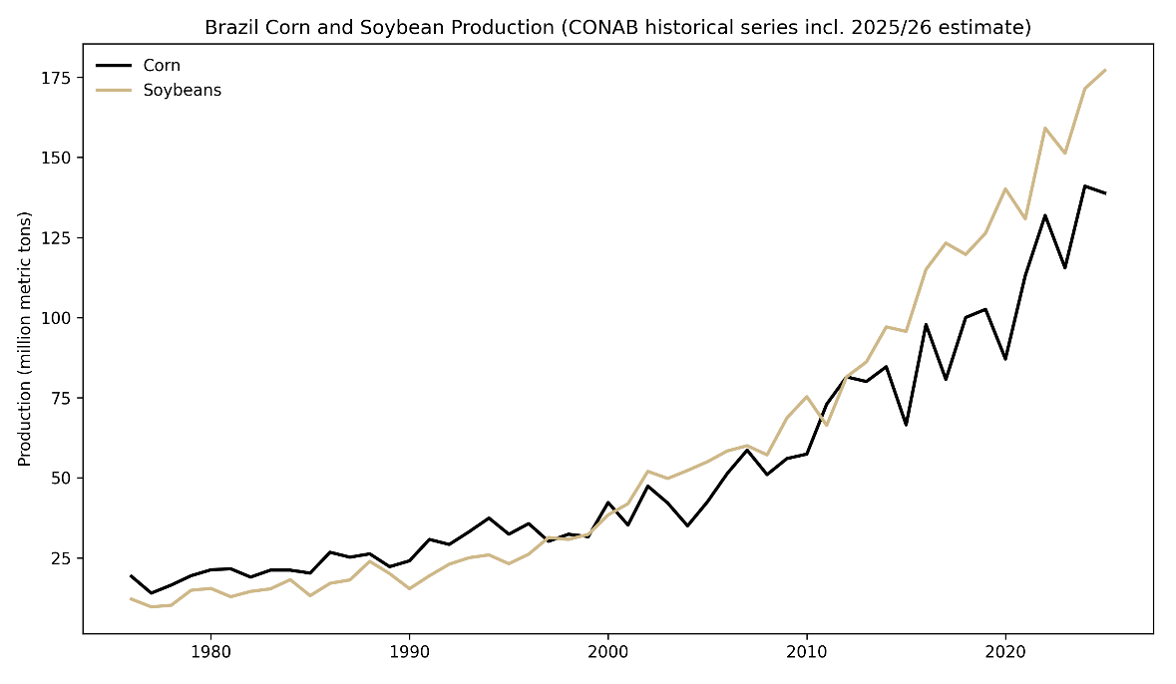
It doesn’t look like U.S. producers can count on production problems in Brazil to help boost winter 2025 prices. Brazil is on track to harvest a record soybean crop in 2026, and the corn crop is just shy of the record set last year. Clearly, the trendline is up for Brazilian production, and I expect increasingly large crops out of Brazil to weigh on global prices for the near future.
Figure 2
Brazilian Production of Soybeans and Corn, 1976-2025 (million metric tons)
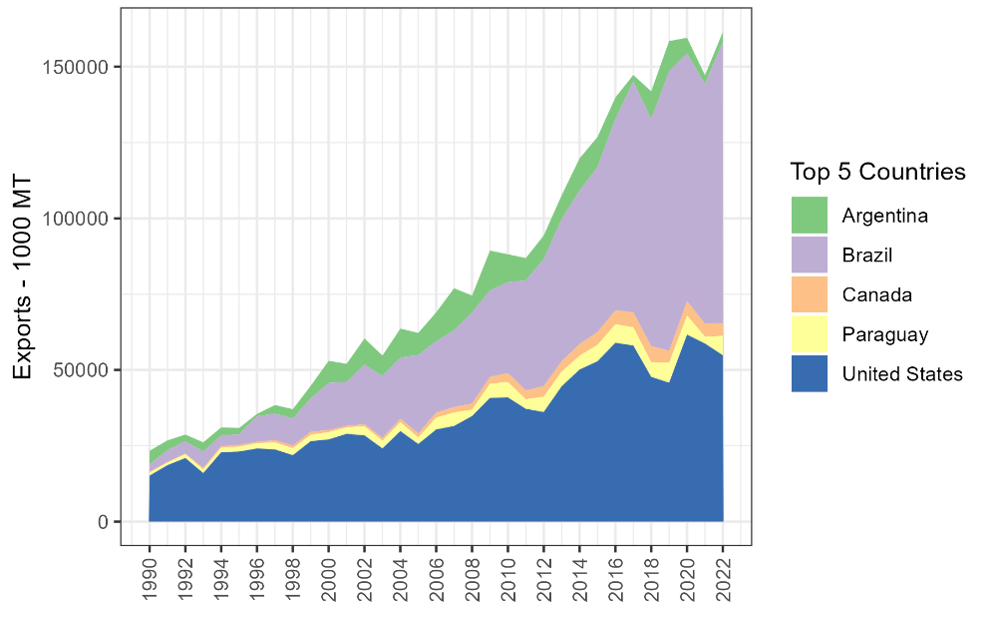
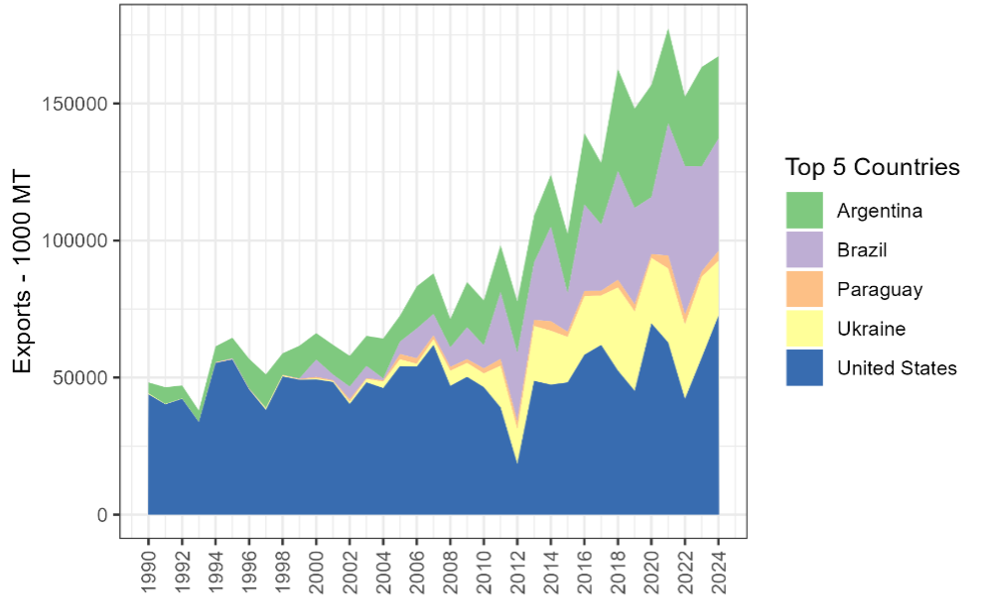
In Figure 3, we can see in stark contrast just how explosive the growth of Brazilian exports has been. While a lot has been written about the impacts the trade war with China has had on U.S. corn and soybean prices, the fact is that China has a ready alternative supplier of soybeans and corn in Brazil
Figure 3
Top World Exporters of Corn and Soybeans, 1990-2025
Export Prospects
Given that backdrop, consider the pace of exports we have seen for the 2025/2026 marketing year. Corn exports started off exceptionally strong, with a pace much stronger and faster than the average over the last five years. World stocks of corn are at their lowest level since 2017 as a percentage of total use, driving strong demand for U.S. corn exports.
The export pace for soybeans is not nearly as strong. We are off to an extremely slow start. We have only seen a pace this low in recent history during the previous U.S.-China trade war. Talks between the U.S. and China have been progressing, with the Chinese agreeing to purchase 12 mmt of soybeans by early 2026. As of the time of writing (late December 2025), China has fulfilled over half of that agreement.
Figure 4
Corn and Soybean Export Pace of Use, 2025 and Average of Previous Years
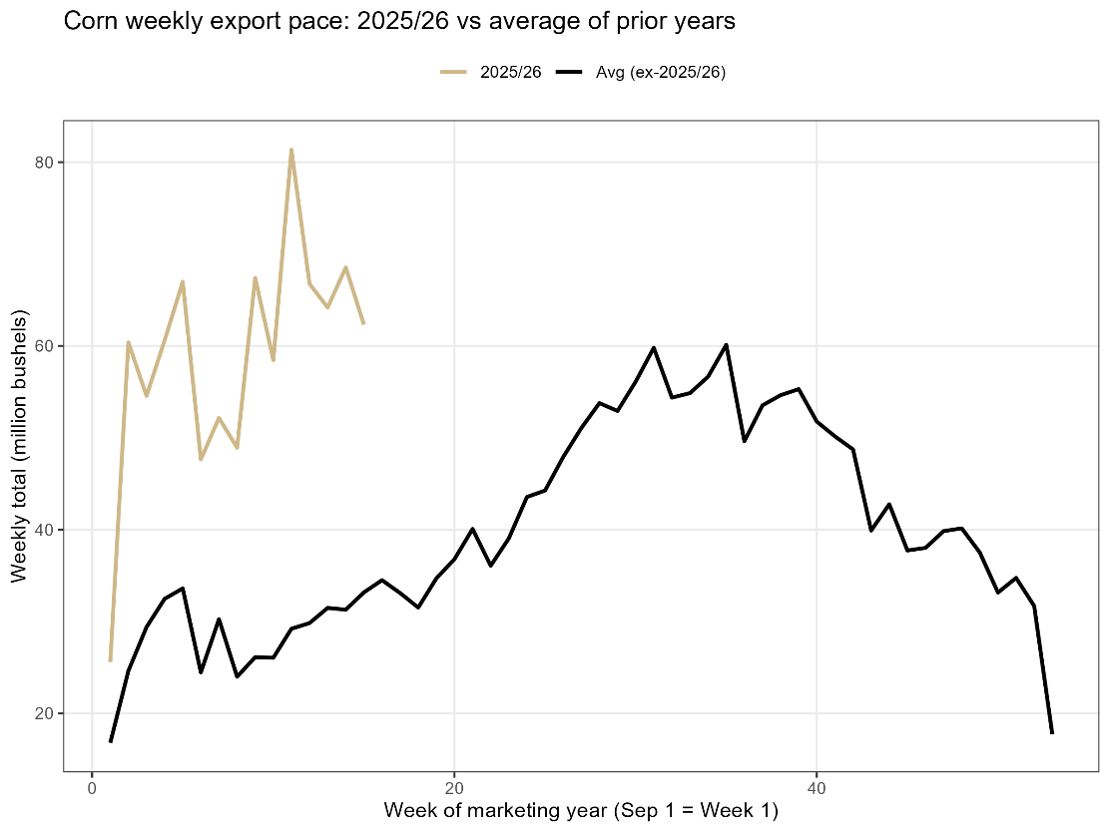
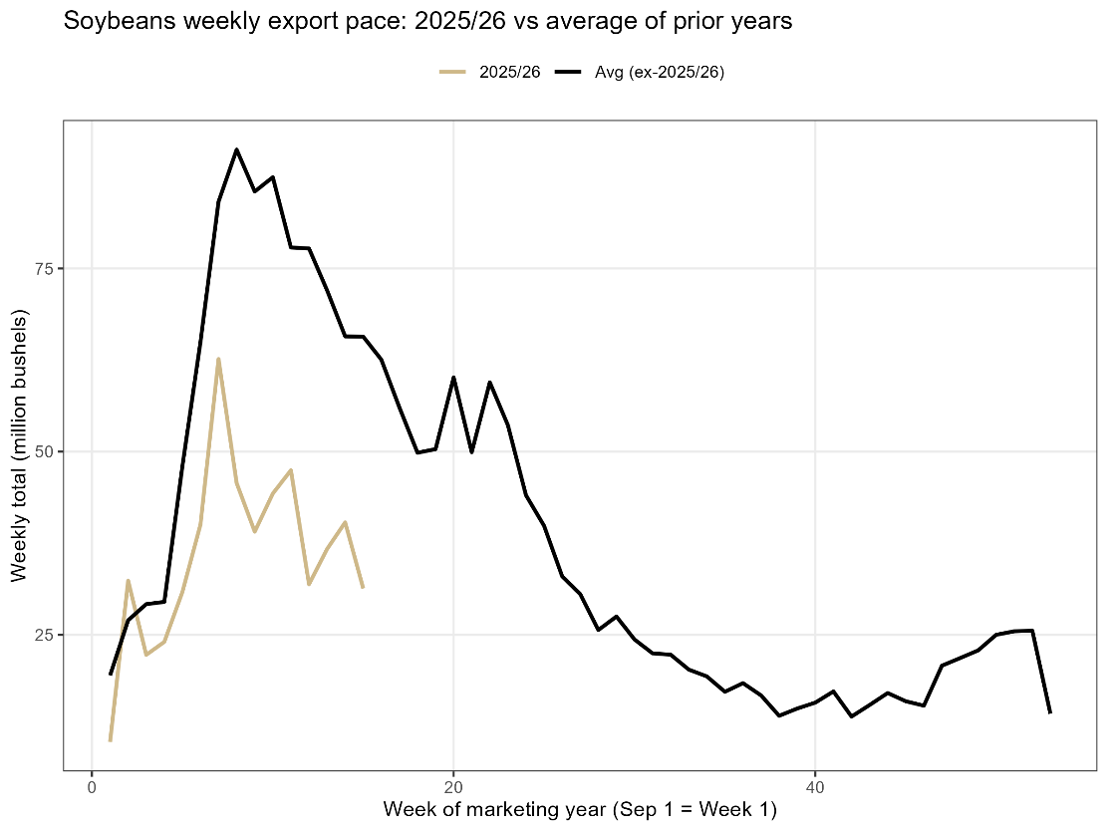
Note: The black line is the average weekly export inspections from the 2016/2017-2023/2024 MYs. The gold line is the current progress of the 2025/2026 MY export sales.
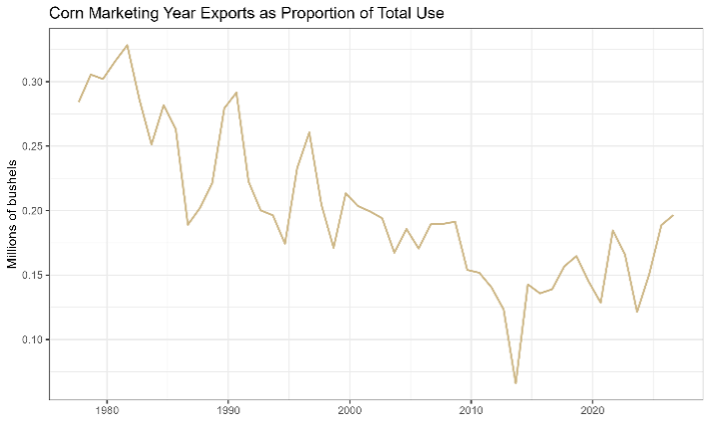
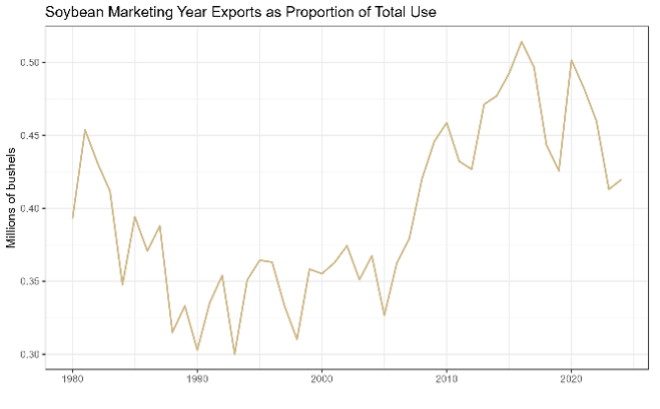
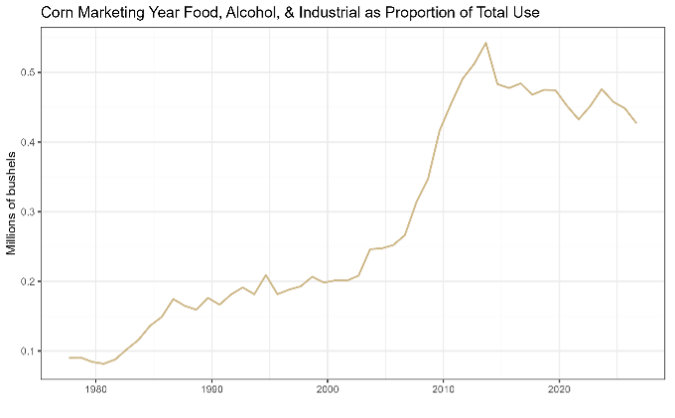
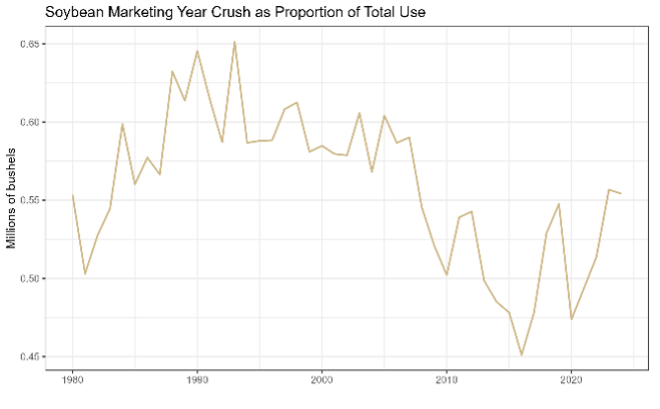
Figure 5 shows the proportion of exports as a percent of total use compared to the main domestic use category for each. For corn, that is the category containing ethanol production (Food, Alcohol, and Industrial), and for soybeans, it is the Crush category. Figure 5 shows that corn and soybeans have experienced a seesaw relationship with reliance on exports. For corn, during the ethanol boom, the export category took a back seat as domestic demand for ethanol priced out many international buyers. Since it has been about 10 years since we hit the ‘blend wall’ (the point at which it became difficult to push more ethanol into the retail fuel supply), the importance of exports has been increasing. This shows up in the exports line in the upper left, rebounding from its low in the 2012 MY, and the Ethanol category turning lower in the same year.
For soybeans on the right side of Figure 5, we see the opposite pattern: increased demand from China has driven the trend toward more export dependence since about 2005. However, we see a clear impact of the first and second trade wars with China, with sharp dips in the Export category proportion in the 2018/2019 and 2019/2020 MYs, as well as an expected large dip in the 2025/2026 MY. During both of those episodes, domestic crush took up the slack left by reduced exports, driven by increasing renewable diesel demand.
Figure 5
Corn and Soybean Marketing Year Exports and Food, Alcohol, and Industrial (Ethanol) Categories as a Proportion of Total Use, 1976-2025
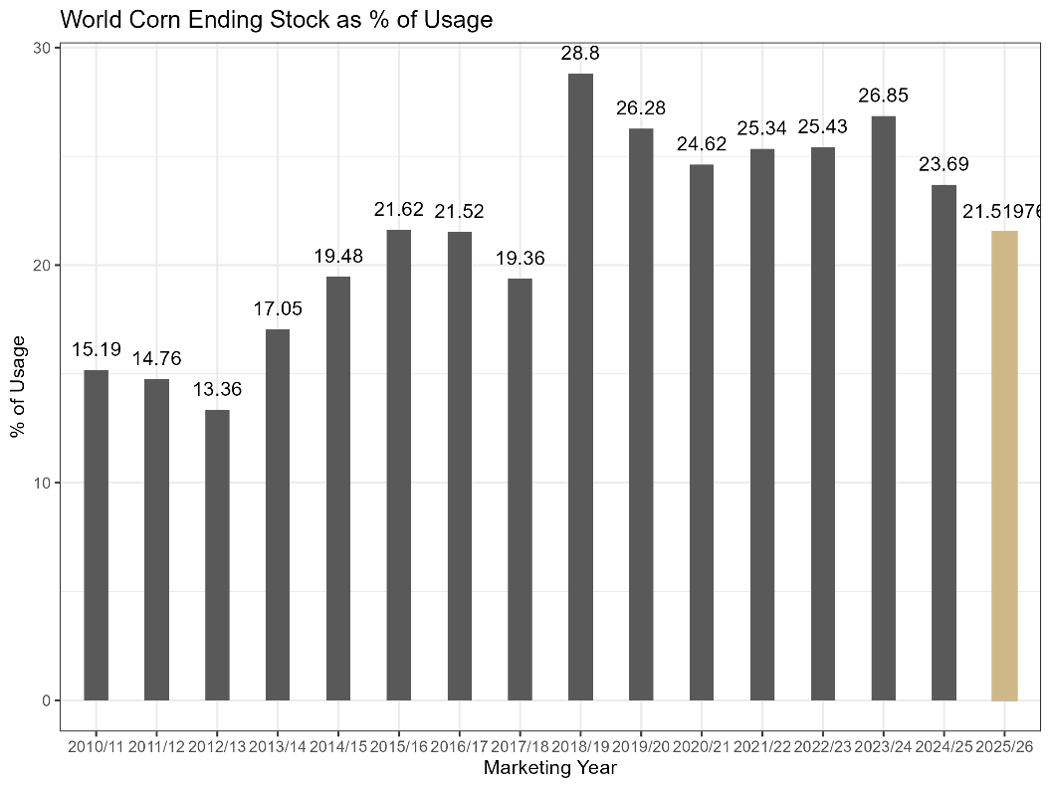
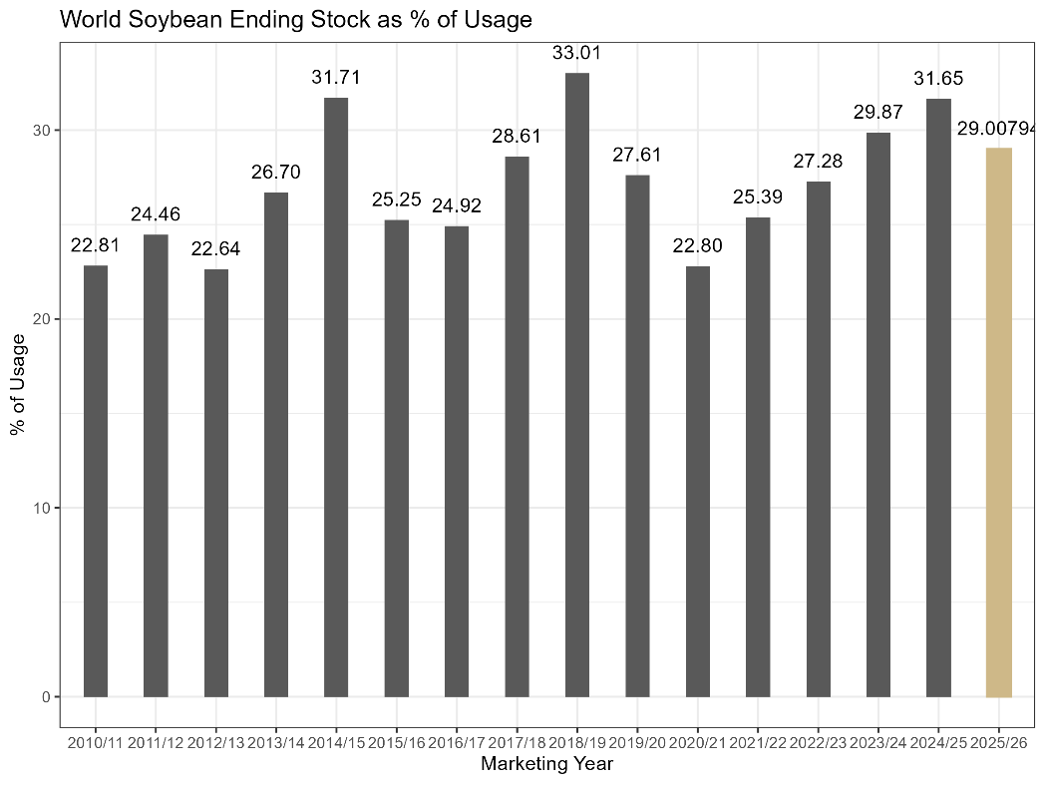
Stocks Situation
Figure 6 shows the MY ending stocks as a percent of total use, with the projected ending stocks for the 2025/2026 marketing year shown in gold. The stock situation does not seem to be an extreme one way or another. Both corn and soybean stocks are well above their recent lows and well above their recent highs. Corn stocks are a bit tighter than soybean stocks, both on an absolute level (21 vs 29) and in relation to their own recent levels. Corn stocks are tighter than in 9 of the past years since 2010, and soybean stocks are tighter than in only 4 of the last years since 2010.
Figure 6
World Ending Stocks as a Percentage of Use, 2010/2011-2025/2026 MYS
Planting: Soybeans with Higher Contribution Margin than Corn for 2026
At the time of writing, the expected contribution margin (revenue – variable costs) is higher for soybeans than for corn. Figure 7 shows how the expected contribution margin has evolved with new crop futures prices. Soybeans are shown in gold, and corn is shown in black. Soybeans have an expected contribution margin of $262 per acre, while corn has an expected contribution margin of $208 per acre.
Figure 7
Corn and Soybean Expected Contribution Margin for 2026 Harvest
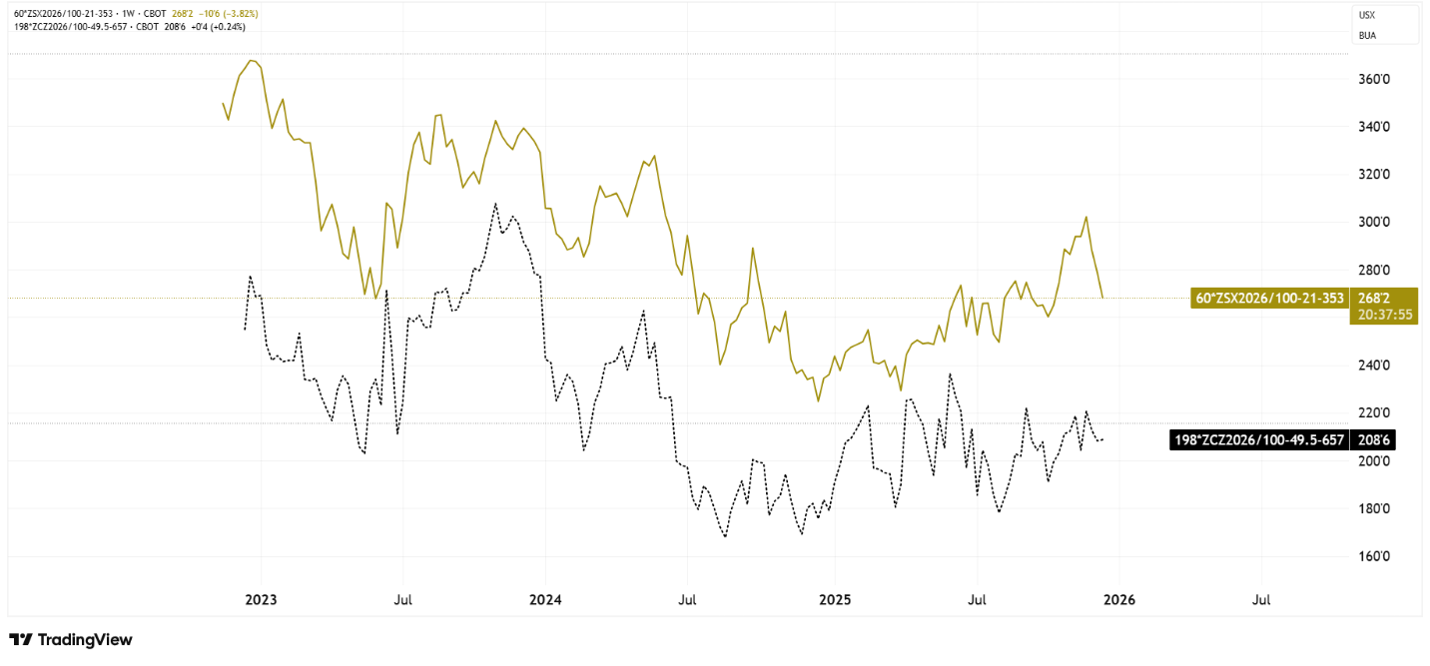
Note: Contribution margin is calculated by using expected yield per acre, expected basis, and expected variable costs per acre for 2026 from the Crop Cost and Return Guide published by the Purdue Center for Commercial Agriculture. Contribution Margin = expected yield * New Crop Futures Price – expected yield*expected basis – expected variable costs.
The Bottom Line
Given corn’s export strength, the stock situation, and reduced 2026 acreage profitability, I expect more potential upside in corn than in soybeans until we get some indication about planting intentions for 2026. Soybean stocks are plentiful, export pace is abysmal, and yet soybeans look to be more profitable to plant this coming year than corn. However, the situation could change rapidly if there are developments in trade negotiations or if there is a surprise with Brazilian production.
![]()
![]()
![]()
![]()
![]()
