Employment and Wage Trends in the U.S., the Midwest and Indiana: Overall and in Agriculture
March 23, 2026
PAER-2026-06
Authors: Ivanna Carrillo-Siller, Agricultural Economics Graduate Research Assistant; Laura Montenovo, Agricultural Economics Assistant Professor, State and Local Finance
![]()
![]()
![]()
![]()
![]()
Main Takeaways
- Indiana has had the highest wage growth among agricultural occupations and the highest average wage for agricultural workers in 2024.
- Agricultural workers in the U.S., the Midwest and Indiana earn significantly less than workers in all other occupations.
- Agricultural workers in the U.S. have decreased significantly since 2019: around 35,000 agricultural jobs have been lost in the U.S. between 2019 and 2024.
- The Midwest has the highest median hourly wages when adjusted for the cost of living. Starting in 2021, Indiana shows a steep increase in real wages, surpassing that of the U.S.
Measuring employment fluctuations reveals essential information about the economy, particularly when compared with the responses of different areas in the same time frame. For an essential industry like agriculture, observing trends in wages and employment shares conveys important information on the labor market in the short, medium and long term. Quantifying labor market features contributes, among other things, to our understanding of how the U.S. economy reacts to deep shocks, like the COVID-19 pandemic.
In this brief, we analyze key labor market data using data from the Occupational Employment and Wage Statistics (OEWS) from the U.S. Bureau of Labor Statistics. The OEWS publishes employment and wage data for occupations based on a survey of business establishments.[1] The dataset includes cross-industry occupational employment and wage estimates for the nation, states and local areas. In this report, we focus on three geographical levels, the U.S., the Midwest[2] and Indiana, and two broad sets of occupations: all occupations and agricultural occupations. To define agricultural occupations, we selected two specific SOC codes within the Farming, Fishing, and Industry Occupations: Farmworkers and Laborers, Crop, Nursery, and Greenhouse,[3] and Farmworkers, Farm, Ranch, and Aquacultural Animals.[4] It is important to keep in mind that these are only two of the available agricultural occupations, but we chose to focus on these as they are closest to farmworkers and largest in the dataset, hence we avoid missing values at the state level.
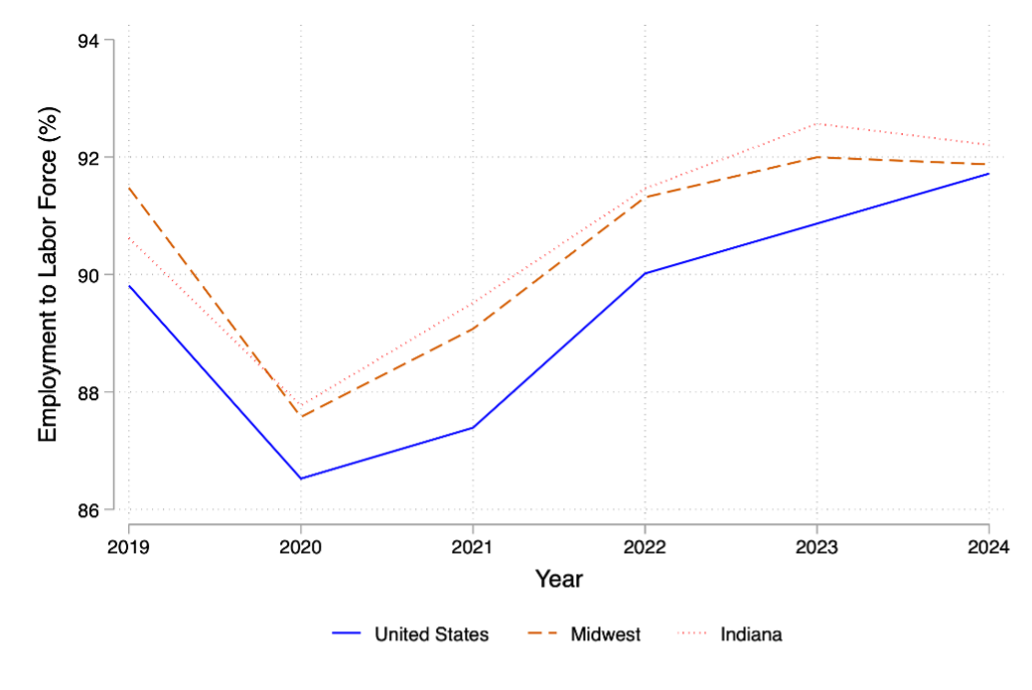
Figure 1 displays the employment-to-labor-force rate between 2019 and 2024 for our three areas of interest: the U.S., the Midwest and Indiana. We consider employment as a share of the labor force rate, rather than of the civilian population, because of some advantages of this measure. First, it isolates labor-market participants and excludes people who are not engaged in the labor market, such as students, children or retirees. Second, it varies more with labor demand factors than with changes in the demographic structure.
Note that before 2020, the highest employment-to-labor-force percentage was in the Midwest, with close to 92% of its labor force employed, followed by Indiana and the United States. During 2020, we observe the drop in overall employment due to the COVID-19 economic shock, with Indiana being the least affected. The employment-to-labor force share we show also dropped, because although the denominator of the share (i.e., labor force participation) likely decreased, the numerator (i.e., employment) fell by much more. Starting in 2020, we begin to see a recovery in the employment-to-labor-force share, and we note that Indiana had the highest employment-to-labor-force rate, closely followed by the Midwest. Interestingly, the United States has a lower rate for most of the entire period and appears to catch up with the rest of the areas in 2024, when the three geographical areas closely concentrate around the 92%.
Figure 1
Employment to Labor Force Rate 2019-2024: U.S., Midwest, and Indiana
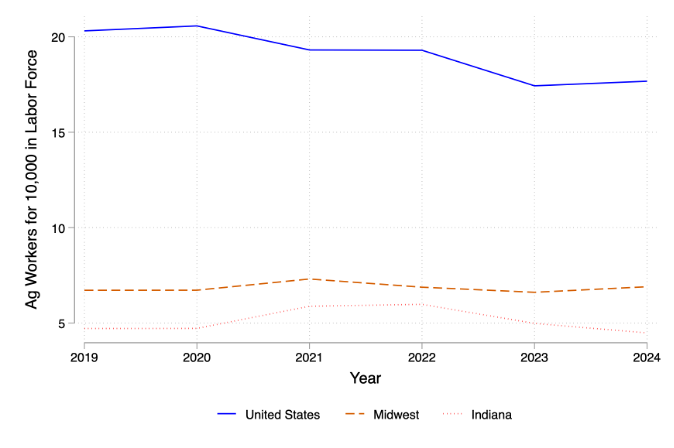
In Figure 2, we show the number of agricultural workers per 10,000 in the area, known as a location quotient. These measurements allow us to observe the concentration of specific occupations in an area separately for the United States, the Midwest and Indiana. In the Midwest, there are around 7 agricultural workers per 10,000 in the area, a trend that remains consistent through 2024. On the other hand, Indiana shows a noticeable increase from below 5 in 2020 to around 6 through 2022, after which the number of agricultural workers declines to less than 5, as at the beginning of our analysis. The U.S. shows a much larger location quotient for agricultural workers, at over 20 in 2019, which decreased after 2020 to about 17 in 2023 and 2024. The higher quotient of agricultural workers in the U.S. with respect to the Midwest and Indiana likely implies cross-state variation in crops and agricultural produce, which require largely different numbers of farm and other agricultural workers.
Figure 2
Agricultural Jobs per 10,000 in the Area 2019-2024: U.S., Midwest, and Indiana
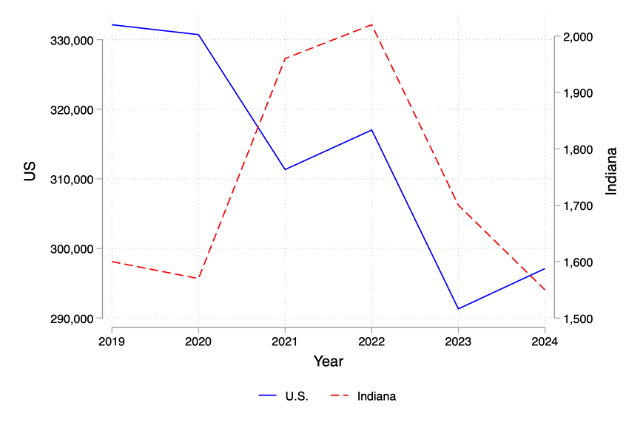
Focusing further on agricultural employment, Figure 3 displays the total number of agricultural workers in the U.S. and Indiana, allowing us to see in detail how the numbers fluctuated over time. Matching these data with those in Figure 2, we observe a decline in the number of agricultural workers in the U.S. beginning in 2020, despite an uptick between 2023 and 2024. Overall, however, the number of jobs in agriculture decreased by almost 35,000 jobs in the past 6 years. For Indiana, we note a slight decrease between 2019 and 2020, and a steep increase in agricultural workers in 2021 and 2022, after which it experiences a very steep decline and ends at a similar number of workers as at the beginning of the observed period.
Figure 3
Total Agricultural Workers 2019-2024: U.S. and Indiana
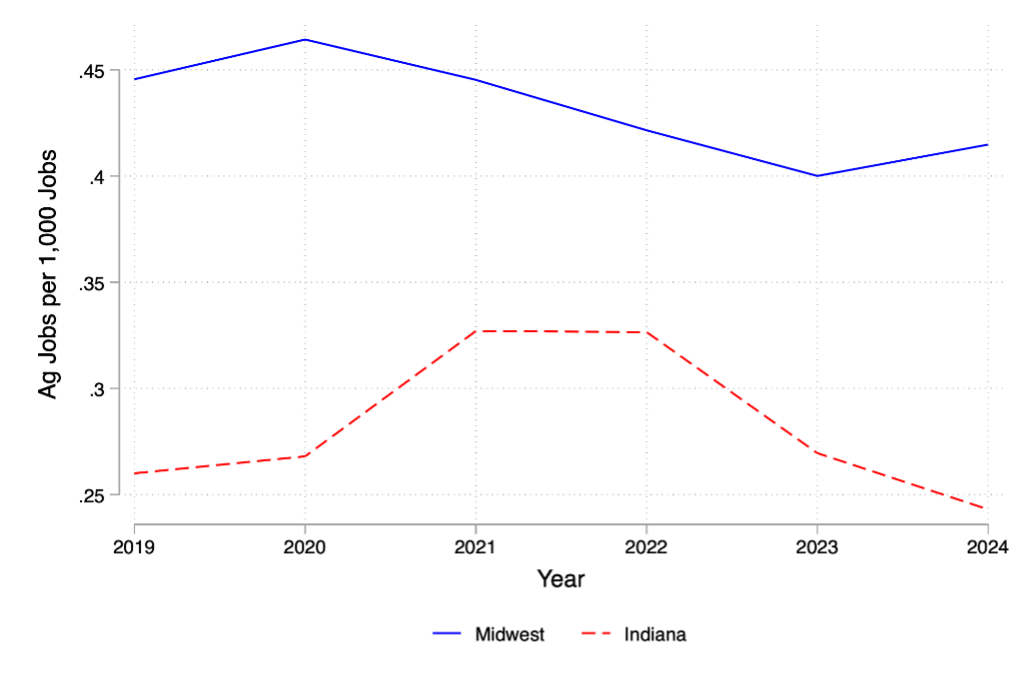
In Figure 4, we analyze the number of agricultural jobs per 1,000 in the area for the Midwest and Indiana. The Midwest shows a slight increase in 2020, and a steady decrease through 2023, reaching its minimum of 0.4 jobs per 1,000. In Indiana, a similar increase can be observed between 2019 and 2021, but, unlike the Midwest, in 2021, the number of agricultural jobs per 1000 rises and remains around 0.33 before declining again in 2023 and 2024.
Figure 4
Agricultural Jobs per 1,000 in the Area 2019-2024: Midwest and Indiana
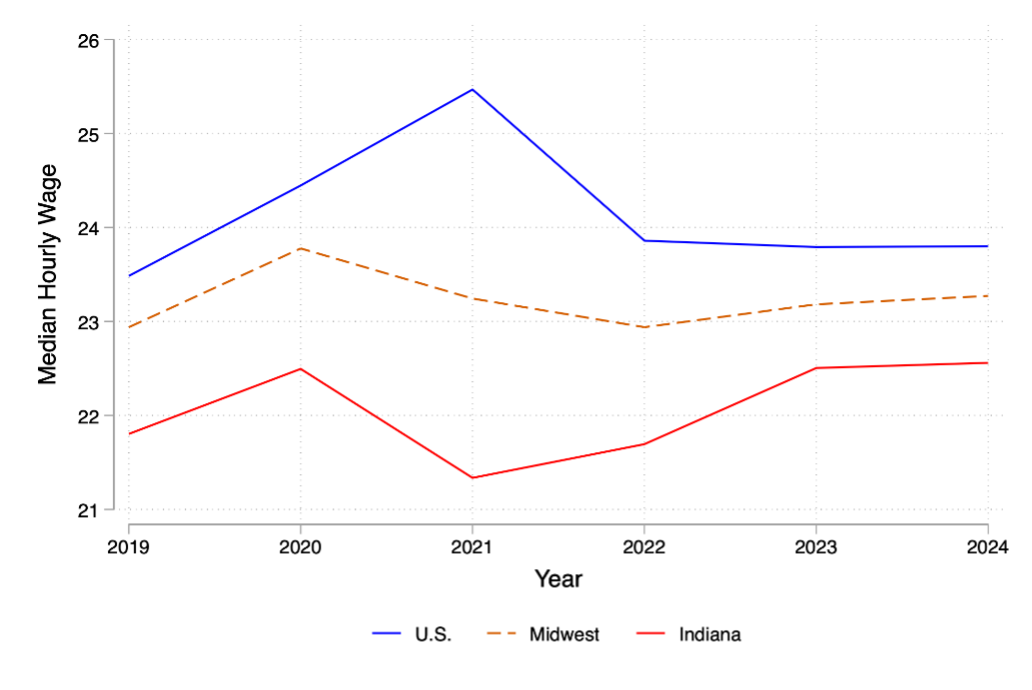
In addition to employment, another fundamental piece of information for understanding the labor market is wages. Figure 5 shows median hourly wages for all occupations in the U.S., the Midwest and Indiana. We observe that the U.S. has the highest wages throughout, with a minimum of around $23.5 in 2019, a steep increase that peaks in 2021 at $25.5, and then lowers again to about $24 U.S. at the end of the period. The second-highest wages are in the Midwest, but unlike the U.S. overall, they have remained somewhat steady through the years, ranging between a minimum of $23 and a maximum of about $23.8. Indiana, instead, shows a different trend, with a wage lower than $22 in 2019, increasing to about $22.5 in 2020, and falling to around $21.5 in 2022. Over the last couple of years, the median wage in Indiana has stayed close to $22.6.
Figure 5
Median Hourly Wages 2019-2024: U.S., Midwest, Indiana
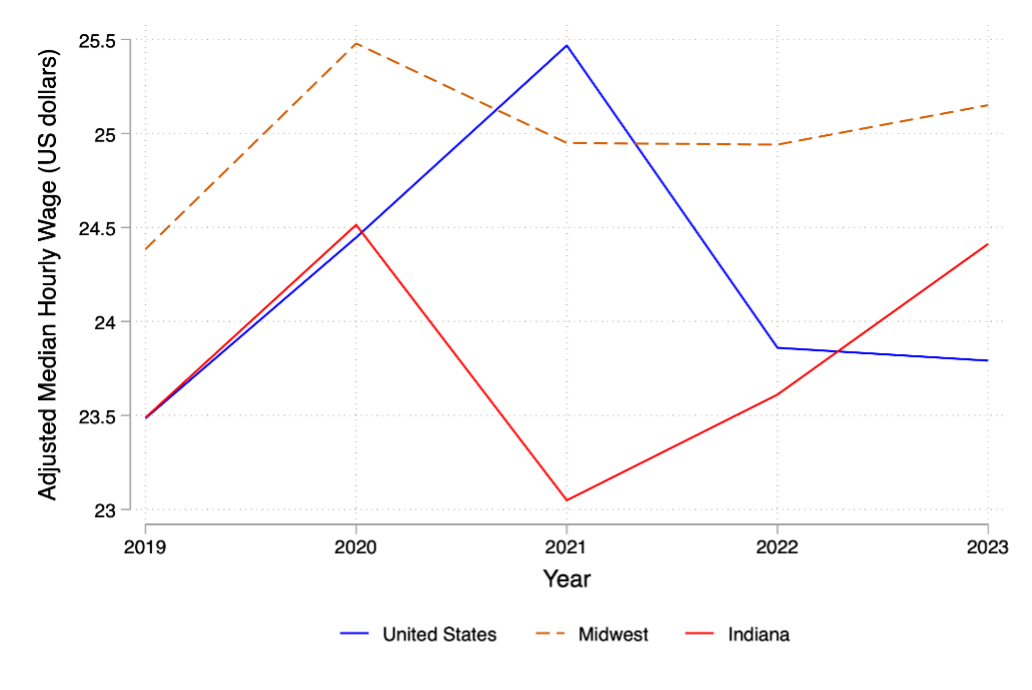
To measure real purchasing power and allow for a fair comparison across areas, we adjust median hourly wages to the cost of living. Due to data availability, we shortened our time frame to 2023. After adjusting for cost of living, wages present very different patterns over time and across the three areas. Now, the Midwest presents higher median hourly wages than the U.S. and Indiana for all years except 2021, and pays the highest adjusted amount in 2020, $25.5. This amount is much higher than the unadjusted $23.8 for the same year, which we observe in Figure 8. Indiana closely follows the U.S. between 2019 and 2020, then it follows a drop in the adjusted wage between 2020 and 2021, in stark contrast with the U.S. increase. Following 2021, the adjusted median wage in Indiana increases and passes that in the U.S. between 2022 and 2023, reaching a median of almost $24.5 (compared to $22.5 in Figure 8 for the same year) in 2023. This provides evidence of a very visible increase in real wages for Hoosiers during the last few years.
Figure 6
Adjusted Median Hourly Wages 2019-2023: U.S., Midwest, Indiana
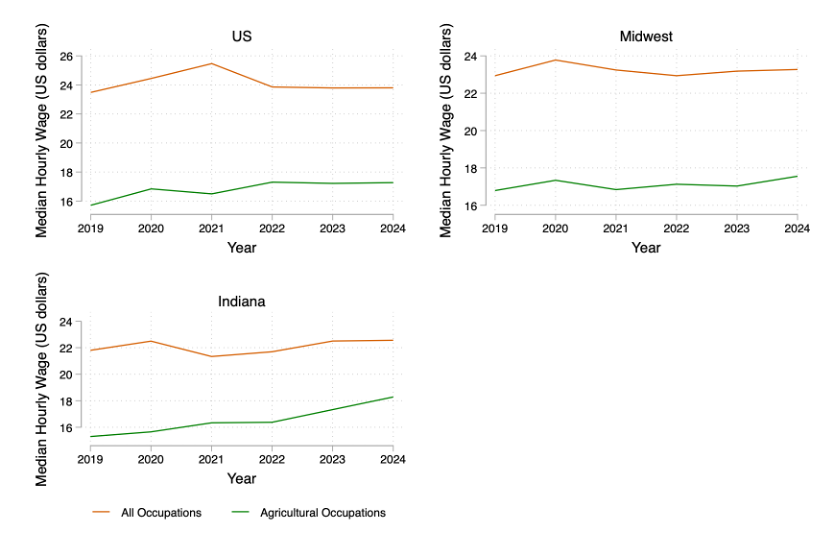
Since wages can affect labor supply, to further understand the agricultural employment trends observed at the start of this analysis, we analyze median hourly wages for agricultural occupations compared to all other occupations. Figure 7 displays such a comparison for the U.S., the Midwest, and Indiana. Note how throughout our period of interest, median wages for agricultural occupations, whose trends are plotted in green, are disproportionately lower than for all other occupations, whose trends are plotted in orange.
Overall, Indiana has the smallest gap between wages, and, following the over-time shrinking of the gap, it has the highest wages for agricultural workers as of 2024. Note that all other occupations earn around $22 throughout, while agricultural occupations earned less than $16 in 2019 but have a consistent increase in wages over time, until reaching just above $18 by 2024. The Midwest has a higher wage for all other occupations (around $23 or above) and a higher agricultural wage than Indiana at the beginning of the period, but this trend disappears over time, as agricultural wages stay below $18 in 2024. As expected, likely due at least in part to differences in cost of living, the U.S. has the highest wages for all occupations over time, peaking in 2021 at above $25 before decreasing and remaining consistent through 2022, 2023, and 2024 at around $24. In the U.S., agricultural wages grew between 2019 and 2022, reaching just above $17, and then stagnated at that amount till 2024.
Figure 7
All vs. Agricultural Occupations Media Hourly Wages
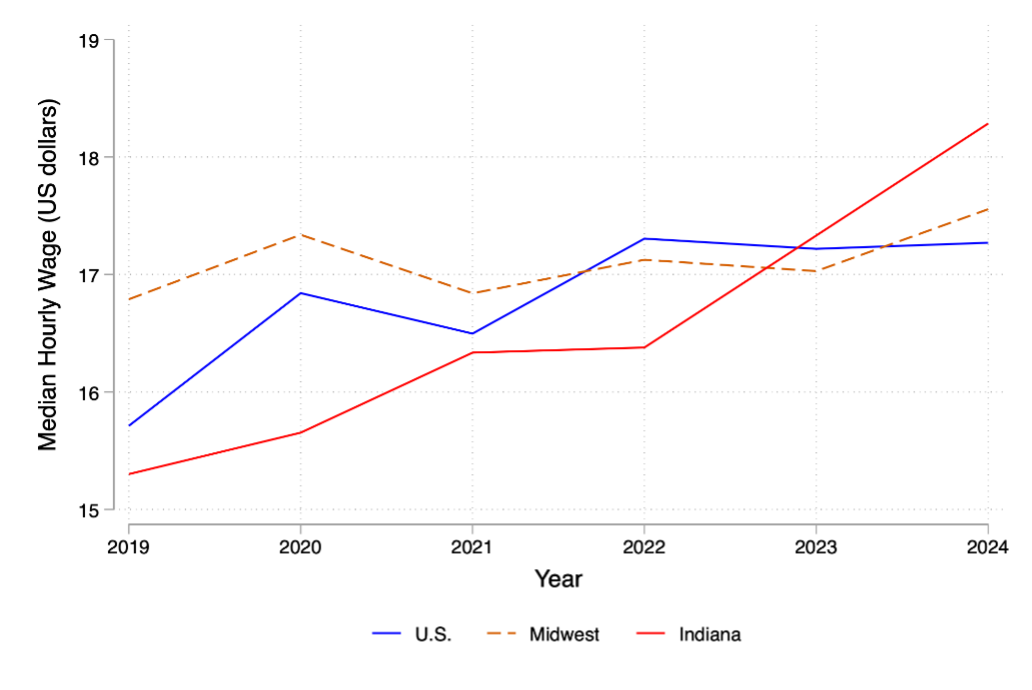
Finally, to compare agricultural wages across all areas, we display the U.S., the Midwest, and Indiana in Figure 8. For the first few years, 2019-2021, the Midwest had the highest wages for agricultural occupations, followed by the U.S., and finally, with a gap of around $2, Indiana. In 2022, the U.S. showed the highest wage, just above $17, closely followed by the Midwest. Finally, Indiana wages take the lead starting in 2023, peaking in 2024 at around $18.2, followed by the Midwest at around $17.5, and, for the first time in the period, the U.S. shows the lowest wages across all areas at about $17.2. Overall, the highest and most steady increase was that of Indiana, which had no noticeable reductions in wages and continued a growing trend. On the other hand, the Midwest displayed a fluctuating increase until 2022, when the growth stagnated.
Figure 8
All Agricultural Median Hourly Wages 2019-2024: U.S., Midwest, Indiana
In summary, our analysis of employment and wage patterns, both overall and in agriculture, reveals both persistent challenges and promising developments heading into 2026. Across the U.S., the Midwest, and Indiana, agricultural workers continue to earn substantially less than their peers in other sectors—a reality that underscores ongoing labor market pressures in a vital industry. At the same time, Indiana’s comparatively strong wage growth, especially when adjusted for cost of living, highlights how regional labor markets may respond differently to broader economic forces and context, with Indiana outperforming national and regional counterparts in agricultural wage gains. This nuanced picture of employment and wage variations across regions and occupations enriches our understanding of the structural dynamics shaping agricultural labor markets.
As stakeholders in agriculture plan for the year ahead, these findings point to important considerations for workforce strategies, policy decisions, and economic resilience. The contraction in agricultural employment nationwide suggests the need for targeted interventions to support labor supply and competitiveness, while the upward trend in real wages in Indiana may offer insights into how local conditions and market adjustments influence agricultural livelihoods. Continued monitoring of these trends will be essential for farmers, agribusiness leaders, and policymakers alike as they navigate the evolving landscape of labor, compensation, and economic opportunity in 2026.
[1] It excludes: Any employees not on the payroll or unpaid and workers not covered by unemployment insurance.
[2] Midwest includes Illinois, Indiana, Iowa, Kansas, Michigan, Minnesota, Missouri, Nebraska, North Dakota, Ohio, South Dakota and Wisconsin.
[3] Code 45-2092
[4] Code 45-2093
References
U.S. Bureau of Labor Statistics. (2025, April 2). Occupational Employment and Wage Statistics. Retrieved from U.S. Bureau of Labor Statistics: https://www.bls.gov/oes/oes_emp.htm
![]()
![]()
![]()
![]()
![]()
