Evaluating USDA’s Farm Debt Forecast
April 26, 2022
PAER-2022-14
Pedro Antonio Diaz Cachay, Masters Student; Dr. Todd Kuethe, Associate Professor and Schrader Endowed Chair in Farmland Economics


Debt plays an important role in farm management. Farmers use debt to finance the purchase of inputs, machinery, and land and to provide short-term liquidity. As a result, the United States Department of Agriculture’s Economic Research Service (ERS) tracks sector-wide measures of debt as part of their “Farm Income and Wealth Statistics.” Since 1944, the United States Department of Agriculture’s Economic Research Service (ERS) has produced annual estimates of agricultural sector’s balance sheet – including farm debt – to measure and compare changes in the agricultural sector’s capital and financial position.
Farmers obtain debt from a variety of sources that provide publicly available measures of farm lending, including the Farm Credit System, commercial banks, and the USDA-Farm Service Agency. For other sources, such as trade credit and borrowing from individuals, ERS relies on financial information collected from farm operators, such as the Census of Agriculture or the Agricultural Resource Management Survey. As a result, official estimates of farm sector debt are released with a significant time lag. For example, the official estimates for 2021 farm sector debt will not be released until August of 2022. The most recent year for which official estimates are available, 2020, suggest that farm sector debt was $441.2 billion.
In order to provide more timely information, ERS releases a series of forecasts for farm sector debt. The initial forecasts are typically released in February to coincide with the USDA’s Outlook Forum. The forecasts are revised again in August and November. One final forecast revision is released the following February, when the initial forecasts of the new year are released. The current release, form February of 2022, forecasts farm sector debt at $454.3 billion in 2021 and $467.4 billion in 2022.
Despite their prominent role in the agricultural sector, ERS’s forecast of U.S. farm sector debt has not been rigorously evaluated. A forecast is optimal if it meets two important conditions. First, an optimal forecast does not systematically differ from realized outcomes, which economists call “unbiased.” Second, an optimal forecast contains all information available at the time of the forecast, which economists call “efficient.” Previous studies indicate that ERS’s initial forecasts of net farm income and net cash income are biased, as they tend to under-predict realized values (Kuethe, et al., 2018; Bora, et al., 2021; Isengildina-Massa, et al., 2021). Further, these studies suggest that ERS’s subsequent revisions are inefficient, as they tend to over-react to new information. A number of previous studies document additional bias or inefficiencies in other USDA price and production forecasts, such as those of the World Agricultural Supply and Demand Estimates (WASDE) (Bora, et al., 2021).
We conducted a series of statistical tests for bias and inefficiency on ERS’s farm balance sheet forecasts for debt, from 1986 to 2020. Figure 1 plots ERS’s official estimates of aggregate farm debt (solid line), along with the four forecasts for each year.
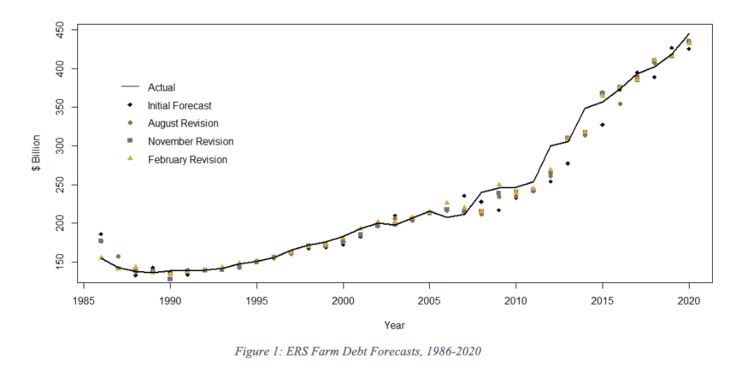
Figure 1: ERS Farm Debt Forecasts, 1986-2020
To examine whether ERS’s farm debt forecasts are unbiased, we test whether the difference between actual and forecasted values (the forecast errors) are different from zero on average. Figure 2 plots the forecast errors for ERS’s farm debt forecasts depicted in Figure 1. For each series, the vertical bars represent the percentage difference between the observed and predicted rate of growth in total farm debt. While the figure suggests an occasional large percentage difference between observed and predicted growth rates, the forecast errors are typically quite small. Further, the positive errors are offset almost perfectly by negative errors. As Figure 2 suggests, our statistical tests suggest that ERS’s farm debt forecasts are unbiased.
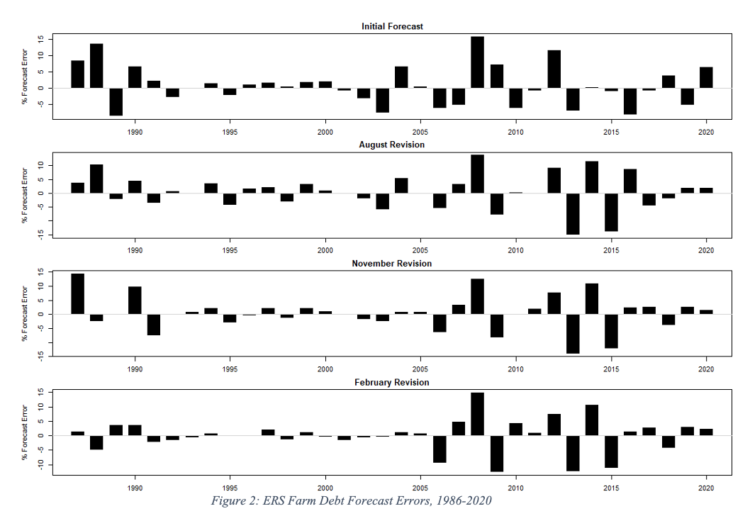
Figure 2: ERS Farm Debt Forecast Errors, 1986-2020
The second property of an optimal forecast, efficiency, requires that forecasts contain all information available at the time of the forecast. In other words, the forecasts use information efficiently. There are two ways to test for forecast efficiency. First, we can test whether forecast errors follow a pattern, which would suggest that forecasters tend to repeat mistakes. Second, we can test whether the forecast errors of each revision are related to the changes made since the initial forecast. If forecasters tend to over- or under-react to new information, the forecast errors and changes in the revisions will be correlated.
We find that ERS’s farm debt forecasts do not repeat mistakes, but they do over-react to new information. As shown in Figure 2, errors of ERS’s farm debt forecast do not appear to follow a set pattern, as positive and negative errors are observed randomly. In other words, the forecasters do not appear to repeat errors. Figure 3, however, plots the relationship between the revision between the initial and August forecasts and the forecast error of the August revision. As the figure shows, larger revisions between the initial and August forecasts are associated with larger forecast errors in August. This negative relationship suggests that the USDA over-reacts to new information between February and August. This is a clear violation of forecast efficiency, as ERS forecasters over-react to new information. Further statistical tests suggest that the over-reaction between February and August negatively affects the entire series of forecast revisions: in August, November, and the following February (where it under reacts to new information).
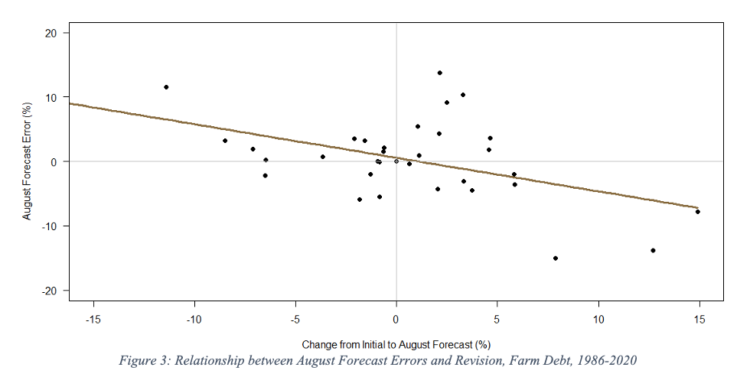
Figure 3: Relationship between August Forecast Errors and Revision, Farm Debt, 1986-2020
In summary, our analysis suggests the ERS’s farm debt forecast are unbiased but inefficient. Specifically, the forecasts for total farm debt and real estate debt over-react to new information and then under-react in the subsequent revisions, carrying the errors through the series of revisions, making the forecasts inefficient. Given the forecasts are unbiased, they provide reasonable expectations for decision makers concerned with overall farm debt, such as lenders, policymakers, and farm operators. However, given that revisions tend to over-react to new information, decision makers may consider adjusting published forecasts in their decision making during the year.
References
Bora, S.S., A.L. Katchova, and T.H. Kuethe (2021) “The Rationality of USDA Forecasts Under Multivariate Asymmetric Loss” American Journal of Agricultural Economics 103 (3): 1006-1033.
Isengildina-Massa, O., B. Karali, T.H. Kuethe, and A.L. Katchova (2021) “Joint Evaluation of the System of USDA’s Farm Income Forecasts” Applied Economic Perspectives and Policy 43 (3): 1140-1160.
Kuethe, T.H. & Hubbs, T. & Sanders, D.R., 2018. “Evaluating the USDA’s Net Farm Income Forecast,” Journal of Agricultural and Resource Economics, Western Agricultural Economics Association, vol. 43(3), September. doi: 10.22004/ag.econ.276505.
USDA (2022). “Documentation for the Farm Sector Balance Sheet”. Economics Research Service, U.S. Department of Agriculture. Recovered from: https://www.ers.usda.gov/data-products/farm-income-and-wealth-statistics/documentation-for-the-farm-sector-balance-sheet/