Improving Farm Financial Performance
May 13, 2001
PAER-2001-5
Michael Boehlje, Professor; Craig Dobbins, Professor; and Alan Miller, Farm Business Management Specialist
![]()
![]()
![]()
![]()
![]()
Analyzing farm profitability is important to the continued success of the farm business. The focus of this discussion is the key drivers of financial performance of a farm business, possible actions to take to improve that performance, and how to analyze the payoff from these possible actions.
Drivers of Financial Performance
Unacceptable financial performance or financial ratios can have many causes. Poor financial performance may result from temporary setbacks beyond the farmer’s control; the appropriate response then may be to “hunker down and wait for the storm to pass.” On the other hand, poor financial performance may be symptomatic of more persistent problems. In that case, the farm business manager must make adjustments to improve financial performance, even if the underlying cause is external to the farm. For short run survival, it is only necessary to maintain a positive cash flow. But longer run survival is only assured through the effective use of resources to generate revenues and produce profits at levels that are competitive in the farming industry and sufficient to meet farmer’s needs.
One approach to improving profitability involves assessing key drivers of farm profitability. With that in mind, it is useful to think of the farm business in terms of scale, employment, efficiency, and leverage.
Scale
Scale refers to the size of the farm business. Farm businesses can be too large or too small. In large, complex operations, managerial control or input can be spread too thinly, which can result in inefficiencies. Conversely, small farm businesses can be inefficient because fixed costs are spread over too few units of output. Scale problems can also occur when the labor supply is too large relative to the productive capacity of the farm business, so it cannot generate enough income to support the families involved. One of the more critical tasks farm business managers must accomplish is to determine the optimal scale for their businesses. This generally involves being large enough to take advantage of economies of size and to minimize per unit costs.
Employment
Employment refers to both the farm business and off-farm employment. Full employment is,
in most cases,
necessary to ensure an acceptable standard of living. If there is excessive labor, the dollars withdrawn for wages or family living expenses can adversely affect the profitability and liquidity of the farm business. If the scale of the farm business is inadequate, and the farm business is too small relative to its labor supply, farmers can consider a number of options. Farm financial managers can reduce labor supply through off-farm employment or by eliminating hired family employees. Or farm financial managers can increase labor utilization through expansion by purchasing or leasing additional assets, shifting to more labor-intensive enterprises, or improving productivity through more intensive management.
Efficiency
Efficiency refers to the relationship between inputs and outputs. To a large extent, it is determined by a farmer’s managerial and technical skills. In larger operations, efficiency will reflect the performance of the owner as well as of the hired managers and workers. Although there are no perfect measures of efficiency, there are a number of satisfactory efficiency measures from which to choose. Because a farm business is a complex, interrelated system, an analyst must examine several aspects of the farm business to conduct an assessment of farm business efficiency.
Efficiency can be measured in physical, economic, and financial terms. Physical terms include such measures as crop yields, pigs per litter, rate of gain, etc. Economic measures include variable costs per acre and returns per dollar feed fed. Financial efficiency measures the intensity with which a farm business uses its assets to generate gross revenues and the effectiveness of cost control strategies. Financial efficiency is influenced by production skills as well as by purchasing, pricing, financing, and marketing decisions.
Leverage
Leverage, in a financial sense, is the relationship between the debt and equity capital used to finance a business. The more debt that is used in relation to total assets, the more highly leveraged a business is said to be. Leverage can work either for or against a business, depending on whether or not debt is used to generate profits in excess of its cost. When it is not working for the business, the more farm debt the worse off the farm business will be. A critical responsibility of every farm business manager is to structure capital in such a way that leverage will work for and not against the farm business.
A farm can have too little debt, limiting its size, efficiency, growth, and earning capacity. A farm can have too much debt, leading to financial inefficiency, accelerating financial losses, and, ultimately, business failure. Any debt at all can be too much when a farm business does not generate net income. Debt influences profitability through interest costs, liquidity through debt servicing requirements, and solvency through the value of the assets available to secure the farm’s liabilities. Debt problems can arise in the short run even when debt is used profitably. Temporary setbacks can lead to financial stress, because the debt load is excessive based on current income, too costly because of rising interest rates, poorly structured because of repayment terms that call for repayment to be made over too short a period of time, or unsecured because of a drop in the value of collateral.
Debt structure refers to the mix of debt repayment terms used by a business. Capital assets typically are financed with a combination of equity capital and borrowed capital. The structure of nonoperating debt should reflect the useful, productive lives of the assets it finances, so as to achieve somewhat of a balance between the assets that are financed and the corresponding financing. For example, farmland is a long-term investment, and the financing should be long term as well.
Operating debt should be self-liquidating with operating loans only for profitable production activities. Farmers should repay the annual operating loan in full each year. Farm financial managers should set up all other debt, including operating debt carryover, over a long enough term to ensure the debt can be repaid with projected net income.
Farm business managers should focus on preventing problems with debt by making good decisions about using debt. In the long run, borrowed capital must be used profitably, or no amount of stretching out of payments will help. Term debt ultimately can be repaid only with net income. Farm business managers must know their limits in terms of how much their farms can comfortably repay with expected net income.
The article in the July 2000 issue of PAER, “Can I Repay? Managing Farm Debt Repayment Capacity,” provides helpful information about how to determine a borrowing limit for a farm. If farm business managers make sure all of their capital investments have a high potential payoff, then they are less likely to run into financial difficulties with the debt that finances part of those investments. Use benchmarking to establish minimum acceptable standards of profit performance for new investments that are consistent with or higher than the targeted, annual, financial performance levels. Farm business managers should use those standards to cull capital purchases according to profitability.
Table 1 presents several potential courses of action that might be used to head off or correct poor financial performance stemming from problems related to the scale of the farm business, employment of labor resources, efficiency of the business, and the extent to which farm business managers are utilizing financial leverage. Numerous additional actions are possible. These are presented only to illustrate the possible managerial responses to different types of problems.
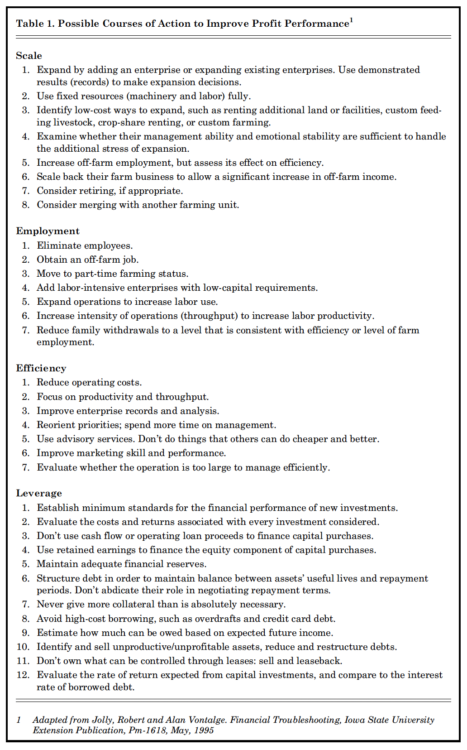
Table 1. Possible Courses of Action to Improve Profit Performance
Analyzing the Payoff of Actions to Improve Performance
The Profitability (DuPont) Model
There are two primary ways to enhance operating performance as measured by ROA (return on assets):
- increase net income per dollar of revenue or unit of output–operating profit margin, and
- increase revenue per dollar invested–asset turnover.
If operating profits exceed the cost of borrowed capital, farmers can augment operating performance through the use of debt or leverage to generate the ultimate performance measure for the individual investor: ROE (return on equity). Thus, there are three primary levers that affect bottom-line financial performance:
- operating profit margin,
- asset turnover, and
- leverage
The relationship among these three levers is summarized graphically in Figure 1. As illustrated in Figure 1, managers assess operating performance by first calculating net income (gross revenue minus fixed and variable cost). Fixed costs are those costs that will not vary with the level of production. Depreciation expenses, real estate and property taxes, interest on term debt, and payments for operator labor and management contributions are examples of these costs. Variable costs are those items that will change with the level of production. Seed, fertilizer, and fuel expenses are examples of these expenses. Specific decisions on cost control, efficiency, and productivity will affect net income. Net income will also be affected by product pricing and input procurement decisions.
In determining net income, one of the fixed expenses is payment for operator labor and management. We suggest family living plus income tax payments as an estimate of this cost item. Because these expense items are subtracted, net income represents the return to the operator’s capital investment and the risk of operating the business.
After determining net income, add back interest cost to obtain earnings before interest, and divide the result by gross revenue to determine the operating profit margin (operating
income ÷ gross revenue). Operating profit margin is the proportion of each dollar of revenue that is operating profit and thus remains to pay financing expenses.
Next, divide gross revenue by total assets to determine the asset turnover ratio. Asset turnover is the dollars of revenue that are generated annually by each dollar of invested funds or assets. Consequently, multiplying the operating profit margin (operating profit ÷ gross revenue) by the asset turnover ratio (gross revenue ÷ total assets) results in the rate of return on assets (ROA) that captures the essence—the bottom line—of operating performance.
Business managers incorporate financial structure and debt cost into the analysis by first dividing assets by equity to obtain the asset to equity ratio. The asset to equity ratio indicates to what extent equity capital is being leveraged by the use of debt capital. To get the rate of return to equity, subtract the interest cost per dollar of assets from ROA to get an adjusted ROA. Multiplying this adjusted ROA [(operating income ÷ total assets) – (interest expense ÷ total assets)] times the financial structure ratio (total assets ÷ equity) results in the rate of return on equity (ROE), which measures the rate of return on farm business man-ager’s invested funds.
Any decision that influences product prices, per unit costs, volume, or efficiency (output per unit of input) will affect the operating profit margin or the asset turnover ratio. And any decision that affects the amount of debt used will affect the financial structure of the business.
The model in Figure 1 allows managers to determine the financial impact of any of numerous decisions that farm financial managers might make to improve performance.
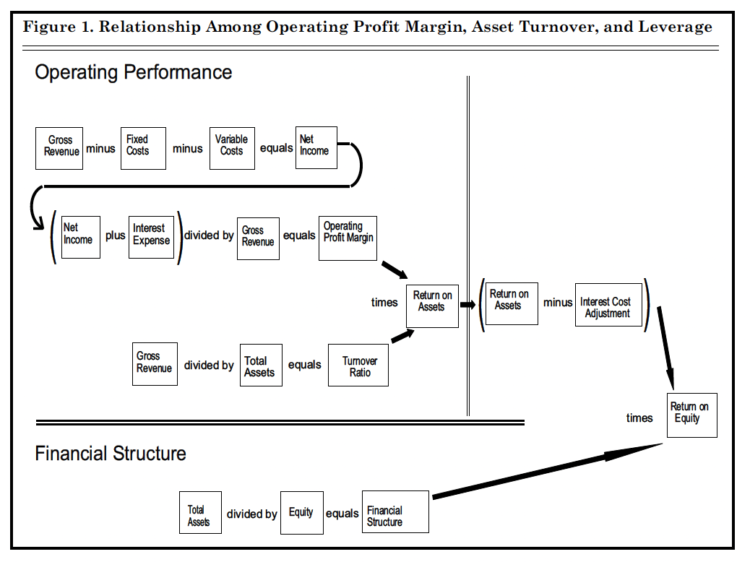
Figure 1. Relationship Among Operating Profit Margin, Asset Turnover, and Leverage
Links between Managerial Decisions and Rates of Return
The information just presented won’t be very useful for producing improved financial performance unless you can connect the bottom-line results to your own actions and decisions. One step in making that connection involves thinking about the many factors that may influence those results. Although ROE is influenced by only three factors – asset turnovers, operating profit margin, and leverage – several managerial actions can influence these factors. Figure 2 summarizes a few illustrative examples of actions you can take to influence asset turnover, operating profit margin and leverage that, in turn, will affect the measured value for ROE. For example, an increase in yields per acre will increase asset turnover, even if per bushel prices don’t change, through its impact on gross revenues. The precise impact of a yield increase on the operating profit margin is less clear, because the yield increase will affect both revenues and variable costs. However, if the value of the additional yield exceeds the added cost to produce the increase, then operating profit margin will also increase.
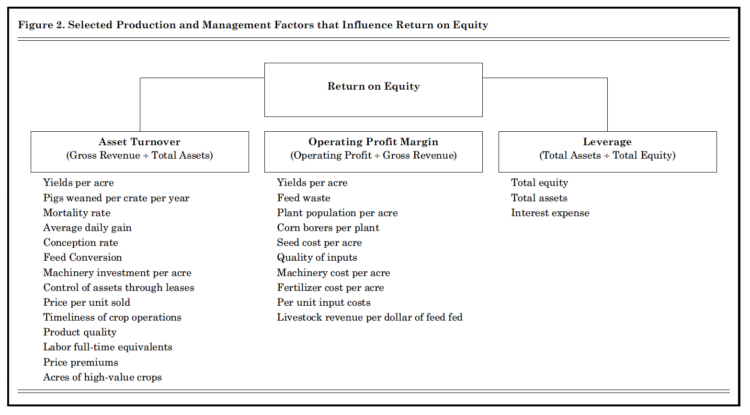
Figure 2. Selected Production and Management Factors that Influence Return on Equity
In identifying strategies that you can use to improve performance or the rates of return (return on assets and return on equity), farm financial managers should realize that some actions might affect only one of the performance measures (operating profit margin, asset turnover, or financial structure), whereas others will affect two or more. Cost-control strategies, such as lowering the cost of fertilizer or seed, will improve only the operating profit margin. Other strategies, such as devoting more time to the improvement of marketing skills, would increase both the operating profit margin and the asset turnover ratio. Improving both the operating profit margin and the asset turnover ratio gives farm financial managers a better chance to improve the return on assets and return on equity than those strategies with just a single impact.
The appended Worksheet provides a method for assessing how changes in their operation will affect ROA and ROE. In completing the Worksheet, we suggest that managers use data for the current situation to complete the “Actual” column. These values can be obtained by completing the worksheet discussed in “Financial Performance: Measurement and Analysis,” in the March 2000 issue of PAER. Use the “Projected Change” column to estimate how a change will affect financial performance. Use the projected column to refigure the financial data and financial measures based upon a proposed change. Then, compare the projected performance based on the change to the current situation as it is summarized in the “Actual” column.
If the action is only revenue increasing (e.g., better prices), then only gross revenues will need to be changed. This will change both the operating profit margin and the asset turnover ratio. If the action reduces variable costs (e.g., reduced fertilizer costs), this will change the operating profit margin. Each change managers consider may influence various financial data items. If the action is designed to increase throughput, the change will affect both revenues and costs. Revenues will increase because of the increased level of production.
The increased level of production will also cause variable expenses to increase. Because fixed resources are the same, fixed costs will remain the same. This type of change will influence both operating profit margin and asset turnover.
If the action is an asset sale, it is likely that it will change gross revenue, fixed costs, variable costs, and total assets. In estimating gross revenues, remember this is an estimate of the operating gross revenue after the asset sales are made. As a result, gross revenues would not include the revenue from the sales of the assets. If farmers use the proceeds of the asset sale to reduce debt, equity will remain the same, but interest costs are likely to decline. Asset sales can have a number of effects. Farmers need to exercise care to be sure that all the changes are captured in the analysis.
Example
Let’s finish this discussion by considering an example. John Jones has completed an analysis for his farm and finds an ROA of 7.25%, but his ROE was only 3.1%. The fact that his ROE was well below his ROA indicates that financial leverage is working against the farm and that improvement is needed. A local banker mentioned that he would refinance John’s land mortgage at a 1% lower interest rate than the best rate he could obtain from his current lender. John has a $300,000 land mortgage on the farm. John has estimated that his total interest expense on his mortgage would decrease by $3,000 as a “result of changing lenders.” But he has been satisfied with his current lender and won’t change lenders unless the change will significantly improve his farm’s financial performance. Because debt appears to be part of the problem, he suspects the lower interest rate might have a big impact.
John hasn’t projected his income for the upcoming year. So he decides to look at how the decreased interest expense would have affected performance during the year that has just ended, as summarized in the
“Actual” column of Table 2. This is what accountants call a “pro forma” analysis. The numbers in the middle column of Table 2 are the recomputed performance measures for John’s farm using the worksheet, based on his estimates of the impact of the reduced interest rate on his mortgage.
Notice in Table 2 that if John had been able to obtain the 1% rate reduction on his $300,000 mortgage, his return on equity would have improved only slightly, from 3.1% to 3.45%. The only calculation affected by the change in the interest rate would have been the interest cost adjustment. Operating profit margin and asset turnover, the key elements of the productive use of the farm’s assets to generate profits, wouldn’t have changed at all. So the 1% interest rate reduction doesn’t have nearly as big an impact as John had expected.
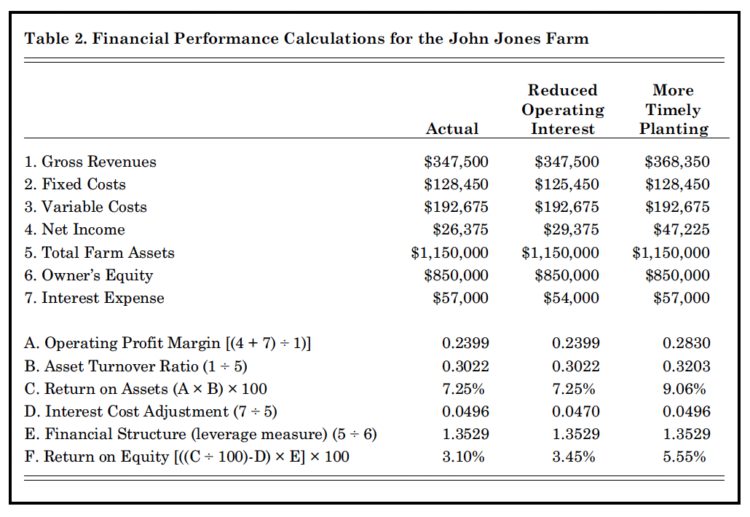
Table 2. Financial Performance Calculations for the John Jones Farm
John’s decision about whether to change lenders isn’t that critical in terms of its likely impact on farm financial performance. Other factors, such as his history with his current lender, may have more impact on his farm’s long-term prospects for improvement. However, it is apparent that he needs to take action to improve the performance of the farm. John’s overall debt load isn’t particularly large given his debt-to-asset ratio of 26%, but his interest expense consumes an uncomfortably large portion of the revenues the farm generates. Given the farm’s current equity, he certainly appears to have the resources to change directions and a lot to gain from improved performance. If the drop-in interest rate won’t produce enough improvement, what other types of adjustments might have the amount of impact he really needs?
John decides to use the Worksheet to evaluate another alternative that he has been considering. John has been planting about half of his full season soybeans after May 23. University research data suggests that he could increase his yields and revenues by pushing a little harder to get his entire bean crop in the ground earlier. That information is consistent with his own observations based on the yield history of the ground he farms. He estimates that his farm revenues could have been increased by 6% by pursuing this operating strategy and at negligible additional monetary cost. The right-hand column in Table 2 shows the estimated impact of the proposed change in the management of the bean planting operation. Both ROA and ROE have been improved, unlike the previous example, in which only ROE improved. Notice that the cost of debt and the amount of financial leverage haven’t changed compared to the Actual column, and, thus, the increased ROE was entirely due to the increase in profitability.
The revised planting strategy looks potentially rewarding. John will need to consider making additional improvements in performance. Typically, poor performance isn’t the product of only one problem, such as high interest rates or lack of timeliness, but instead is the result of a number of things that could be improved. Changes that will simultaneously increase profitability and decrease the amount or cost of using leverage will produce more impact dollar for dollar than changes that affect only one or the other. Typically, the impact of each one of the contributors alone to poor performance may not be that great, but all the smaller performance shortfalls add up.
Final Comment
Unacceptable financial performance can occur for a number of reasons related to the scale, efficiency, employment, and leverage or debt use of a farm business. By using the DuPont Profitability Analysis Model, farm business managers can evaluate the potential payoff of various actions that might be identified to improve financial performance. The real challenge is implementing the action once farm financial managers have identified it.
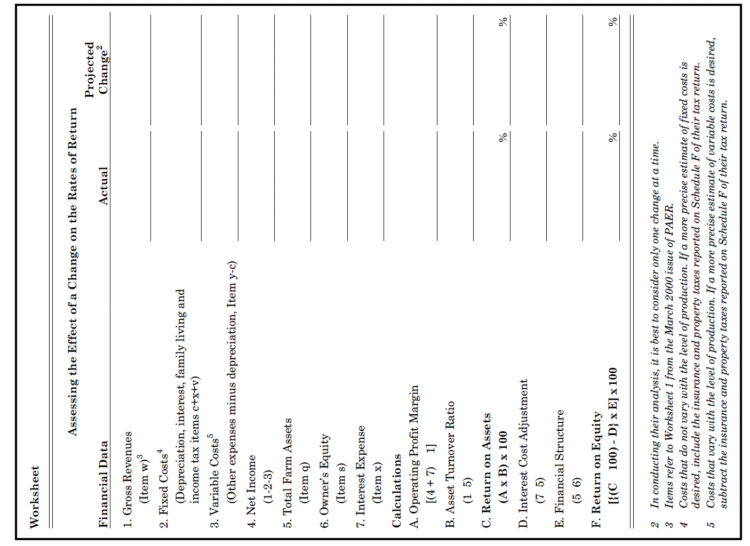
Worksheet: Assessing the Effect of a Change on the Rates of Return
![]()
![]()
![]()
![]()
![]()
