Indiana’s State Budget, 2009-2011 and Beyond
November 18, 2009
PAER-2009-10
Larry DeBoer, Professor
![]()
![]()
![]()
![]()
![]()
Indiana’s General Assembly passed a budget on the evening of June 30, 2009. It took a special session, and the pressure of an end‑of‑fiscal‑year deadline that had not been missed for more than a century, for legislators to agree on a spending plan for 2010 and 2011.
The state budget agency provides plenty of information about the budget’s appropriations, revenues and balances. Unfortunately, it’s all in separate documents, which makes the big picture difficult to under‑ stand. Table 1 draws this information together in “checking account” form. Like any household, the state starts the year with balances, which is money in the bank. The state had $1.4 billion at the start of fiscal 2009, on July 1. We receive state income from taxes and other revenue sources, but not nearly as much as we expected. We write checks to pay for public services, based on appropriations planned in our budget. Our rich but indebted uncle slips us some cash to help out, with the Ameri‑ can Recovery and Reinvestment Act stimulus money. We shift some money around, with fund transfers, and cancel some previously planned spending, with reversions. And at the end of the year, we’ve got money left over, in balances in the bank.
This paper uses the state’s bud‑ get information in this “checking account” form to look at the state’s 2009 budget problem, to understand the choices that the General Assembly made for the 2010‑11 biennium, and to project revenues and appropriations for the 2012‑13 biennium.
Fiscal Year 2009
Revenues. Revenues were the problem for this budget. Table 1 shows total revenues down $151 million from 2008 to 2009. This was the first year‑to‑year drop since 2002. The reason, of course, was the recession which began in December 2007, and intensified in the Fall of 2008. This revenue drop understates the recession’s effect on the budget. Sales tax revenues increased $467 million because of the hike in the sales tax rate from 6% to 7% in April 2008. The rate was increased during the last three months of fiscal 2008, and for all of fiscal 2009. Without the higher rate, sales tax revenue would have fallen by nearly $200 million.
More important for budgeting is the shortfall of actual revenues below projected revenues. In April 2007 the legislature passed a balanced budget for 2009. Projected revenues more than covered planned spending. Reforms were made in 2008, which replaced property taxes with added state appropriations. The added state spending required by the reform was balanced by an equal amount of anticipated new revenue. Yet, when the books were closed on 2009, revenues had fallen short of appropriations by almost $1.4 billion dollars. That’s the amount shown in Table 1 under Current Year Surplus/ Deficit. This is an enormous shortfall of about ten percent of the budget.
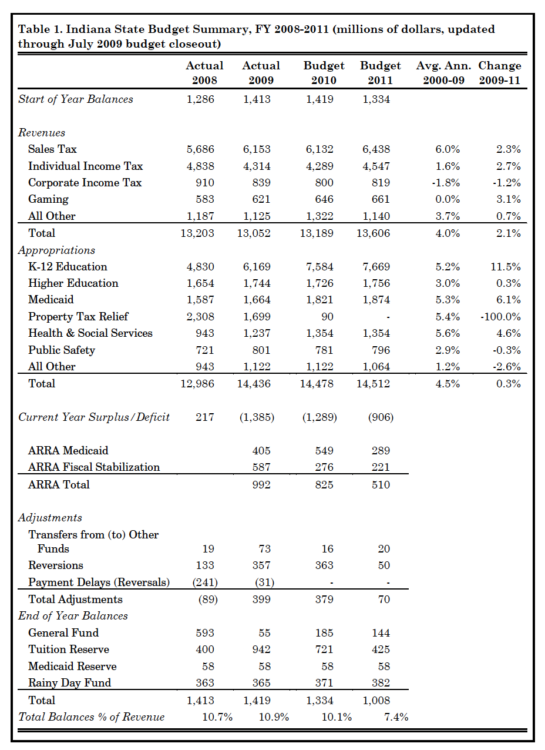
Table 1. Indiana State Budget Summary, FY 2008-2011 (millions of dollars, updated through July 2009 budget closeout)
Appropriations. State appropriations increased substantially from 2008 to 2009 because of the 2008 property tax reform. In 2009 the state took over the school corporation general funds, county welfare funds, and several smaller local government funds. These had been paid for with property taxes; now they are financed out of the state budget. The reform represents a movement away from property taxes, towards sales taxes, to support local government services.
State appropriations for K‑12 education increased more than $1.3 billion as a result of this tax policy change. This does not mean that local school corporations were awash in new money. Each dollar of added state aid replaced a lost dollar of property tax revenue for the schools. Likewise, health and social services spending rose almost $300 million because of the takeover of county welfare funding.
These 2009 spending increases were partially offset by a reduction in property tax relief of more than $600 million. This is also the result of the 2008 tax reform. The old methods of providing tax relief—property tax replacement credits and homestead credits—are being phased out. These were credits that reduced the tax bills of property taxpayers. The state compensated local governments for this lost revenue with payments from its budget. Now, tax relief will be pro‑ vided by eliminating whole functions from the property tax. The credits will disappear, and the property tax relief money will help pay for the added state spending on schools and welfare. The sales tax increase will also fund these new expenditures.
Again as the result of the 2008 reform, in calendar year 2008 a temporary tax credit was paid to homeowners, as a bridge between the old and new methods of tax relief. This lessened the reduction of the property tax relief appropriation in fiscal year 2009. By 2011, however, it will be zero. The money will still be providing property tax relief, by paying for the K‑12 education and health and social services spending that used to be funded with property taxes.
ARRA: Federal Stimulus Money. ARRA is the American Recovery and Reinvestment Act, the Federal stimulus money passed by Congress in February 2009. There are many stimulus programs, but two were meant to shore up state budgets.
Medicaid is a joint Federal‑state program that provides health care for low income people. Each state
is expected to finance a fraction of the cost, and the Federal government picks up the rest. In 2009 (and for 2010‑11) the Federal government increased its share of Medicaid costs. This reduced the state’s spending on Medicaid.
The stimulus bill also included fiscal stabilization funds. These were directed to K‑12 education. In 2009 Indiana used this money to make state aid payments to local school corporations, which were owed under the school funding formula. This reduced the state’s spending on K‑12 education.
Indiana used a total of $992 mil‑ lion in Federal stimulus money in its budget in 2009. It is shown in Table 1 as a separate entry, to make clear how much ARRA money was used in the budget. It could have been counted as reductions in K‑12 education and Medicaid spending, making appropriations smaller. Or, it could have been counted as reversions, which are appropriations that are budgeted but not spent, and so revert to the general fund budget. That would have made “adjustments” bigger. That’s how the state budget agency counted ARRA money for fiscal 2009.
Adjustments. When budgets are stressed the state often resorts to extraordinary adjustments. In fiscal 2009, $73 million was transferred to the General Fund from other funds, mostly from the Build Indiana Fund. Reversions were by far the biggest adjustment, at $357 million. This was an intentional effort to spend less than the original budget appropriated. When this happens the money reverts to the General Fund. A great many agencies and departments spent less than their appropriations. For example, the State Budget Agency itself reverted $10 million, the Indiana Economic Development Corporation reverted $41 million, and the state’s universities, including Ivy Tech, reverted almost $40 million. The amount of reversions in 2009 was probably the most in Indiana state budget history.
Payment delays are an adjustment that was used in the past two recessions. They were not used in 2009, nor were they scheduled for 2010 or 2011. These are delays in payments from the state to local governments, from one fiscal year to the next. This works because the state is on a July to June fiscal year, while local governments are on a calendar fiscal year. If the state delays a property tax relief payment from June to July, the locals get their money during their budget year (just a little late), but the state reduces its recorded spending in the earlier year. This helps maintain balances while reducing the need for spending cuts or tax increases.
This is an accounting trick, a “fiscal gimmick”, but it’s been use‑ ful in the past. It was used after the 1990‑91 recession and after the 2001 recession. In each case the payment delays were reversed during the expansions that followed the recessions. Reversals add to a budget’s spending. The last payment reversal from the 2001 recession was made in 2009—that’s the negative $31 million shown in Table 1.
It seems unlikely that payment delays will be used in the near future. The Governor has pledged not to use this gimmick. Property tax relief payments to local governments are being eliminated, and this was one of the primary payments that were delayed in the past. In addition, school corporations are scheduled to move to a July to June fiscal year, which means a payment delay in state
aid to local schools would create a shortfall in their budgets.
End‑of‑Year Balances. Start‑of‑year balances, plus revenues, less appropriations, plus ARRA money, plus adjustments, equal end‑of‑year balances. The state ended the fiscal year with that same $1.4 billion in balances that it had at the start, despite the $1.4 billion shortfall in revenues. It accomplished this by using about one billion dollars in Federal stimulus money, and about $400 million in reversions and fund transfers. Federal dollars plus reversions plus transfers covered the 2009 shortfall, and left the state with money in the bank.
The state budget agency defines the “prudent range” for balances at 10% to 12% of total revenues. This is enough to cover the revenue short‑ fall in a mild recession for a year. Balances remained in this prudent range in 2009.
Total balances are composed of several sub‑categories. The famous Rainy Day Fund makes up $365 million of the total. There is also a small reserve to cover potential shortfalls in revenue for Medicaid entitlement payments.
In 2009, more than $500 million was shifted from the general fund balance to the tuition reserve balance. This was done as a result of the 2008 tax reform. School corporations are now totally dependent on state aid to finance their general funds, which are mostly teacher pay and benefits. It is sensible to build a fund to support these aid payments in the event of revenue shortfalls. Unfortunately, the new school funding policy started in the very year that enormous revenue shortfalls occurred. The tuition reserve balance was increased by depleting the general fund balance. It’s total balances that count, however. The legislature shifted money from the general fund to the tuition reserve fund in 2009. If necessary, it could shift the money right back.
The New Biennium
Revenues are projected to grow slowly in the next biennium, starting from the reduced 2009 level. The 2.1% average growth per year is about half the average growth of the previous decade. As a result appropriations are scheduled to grow slowly. Table 1 shows appropriations increasing only 0.3% a year in 2010 and 2011. In total the budget is almost flat‑lined.
K‑12 education shows large increases in fiscal 2010, but again this is because of the 2008 property tax reform. Calendar year 2009 is the first year that the state will pay the entire school general fund. For the state, the new payments are split between fiscal year 2009 and fiscal year 2010, which is why it appears to take two years to switch to the new funding policy. In 2008, before the policy change, K‑12 education accounted for 37% of state general fund spending. In 2010, the share will be 52%. More than half of all state general fund appropriations will go for local schools. This may imply that schools will be more vulnerable to recessions and expansions in the future. When state revenues fall short, school spending must be cut, because that’s where the money is. School spending will grow only when state revenues grow.
Property tax relief disappears from the state budget as of 2011. That’s when the last of the temporary homestead credits run out. Tax relief will be provided by reduced property tax levies, due to the state takeovers, by a large added deduction from homestead assessed values, and
by the “circuit breaker” property tax caps.
Medicaid appropriations also grow substantially in 2010 and 2011. Medicaid is an entitlement, and so its spending depends on how many people are eligible for care, and what that care costs. With the recession, more people are eligible. And health care costs continue to rise rapidly.
In both years the state plans to spend more than it collects from its own revenue sources, by almost $1.3 billion in 2010, and $900 million in 2011. In 2010, this shortfall again is covered by Federal stimulus money, and reversions. Balances are depleted by $100 million. Reversions are not scheduled for 2011 (though they may be used). Instead, the state will draw its balances down by more than $300 million. Balances remain in the 10% to 12% “prudent range” in 2010, but dip below that range in 2011.
Beyond the New Biennium
In 2012 Indiana will face a problem, as will all the states: no more federal stimulus money. The ARRA program is scheduled to end after 2011. That leaves a big hole in the Indiana’s state budget.
The scenarios in Table 2 look ahead to the 2012‑13 biennium—the biennium after this one—to try to measure the likely condition of the budget. The table shows an abbreviated version of the state budget in checking account form, for three scenarios. Scenario one has a “business as usual” increase in appropriations. That’s a 3.6% overall increase per year, a rate based on the average over the past ten years. It also shows “normal” revenue growth, at 4% per year, again based on past averages.
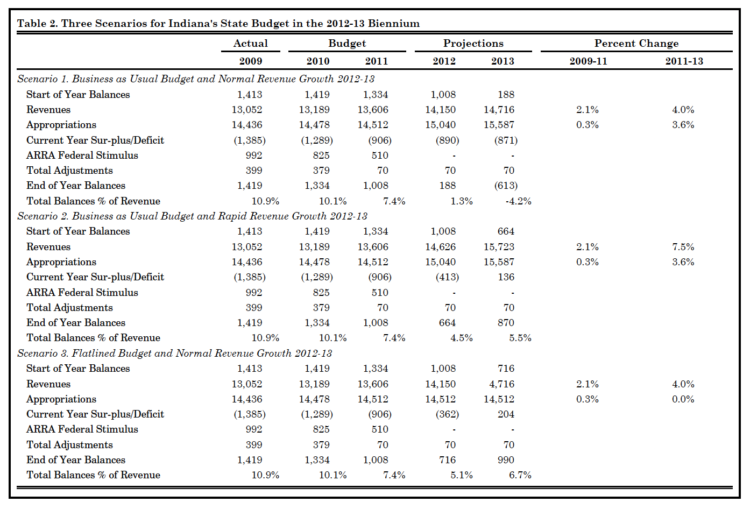
Table 2. Three Scenarios for Indiana’s State Budget in the 2012-13 Biennium
The budget doesn’t work. Without the stimulus money the budget runs deficits of almost $900 million per year. Balances run down to 1.3% of revenues in 2012, and turn negative after that. That’s unconstitutional. With normal revenue growth, the state will not be able to increase appropriations at the usual rate in the 2012‑13 biennium.
Scenario 2 shows how fast revenues must grow to support business as usual appropriations growth. The answer is 7.5% per year in 2012 and 2013. In this scenario the budget is in deficit in 2011, and balances drop to 4.5% of revenues. This is below the rule‑of‑thumb minimum of 5%, so for a time the state could face cash‑flow difficulties. But the deficit turns to surplus in 2012, and balances begin to rebuild.
Two straight revenue increases of 7.5% are unlikely. The state’s economy would have to boom, growing more rapidly than is likely for two years. A state tax hike could increase revenue that much. An income tax rate hike from 3.4% to 3.8%, or an increase in the sales tax to 7.5%, would be enough. The General Assembly showed no sign of supporting tax hikes during the 2009 budget session, though.
Another way to support business as usual spending increases would be an extension of the Federal government’s stimulus program. There will be plenty of states with budget difficulties in 2012; we can expect an intensive lobbying effort for the stimulus aid to continue.
Suppose none of these things happen, and revenues grow a more nor‑ mal 4%. Scenario 3 shows that state budget appropriations would have to be flat‑lined to balance the budget with normal revenue growth. There is still a deficit in 2012, and balances drop to 5.1% of revenues, but there is a surplus in 2013. Total appropriations do not change. However, Medicaid entitlements will increase if health care costs keep rising. This implies decreases in other spending categories, in particular K‑12 education, where most of the money goes.
Another Tough Budget Session in 2011
Four percent a year is a more likely pace for revenue growth. That means a typical economic expansion, with no tax increases, and no more stimulus money. If that’s what happens in 2012‑13, the budget would have to be flat‑lined to maintain positive balances. That means no spending increases, again.
And that means that the General Assembly will again divide a fixed amount of revenue among many competing interests. One added dollar for one function means a dollar less for another. Decisions like that are hard. We can expect another tough budget‑writing year for the legislature in 2011.
![]()
![]()
![]()
![]()
![]()
