Commodity Prices at the Crossroads: Trade Policy, the Iran Conflict, and the 2026 U.S. Grain Markets
May 5, 2026
PAERPB-2026-06
Ken Foster, Professor of Agricultural Economics and Director, Purdue Farm Policy Study Group; Bernhard Dalheimer, Assistant Professor of Macroeconomics and Trade; Roman Keeney, Associate Professor of Agricultural Economics and Extension Coordinator
![]()
![]()
![]()
![]()
![]()
Key Takeaways
– Historically, when energy inputs become more expensive, the U.S. supply response drives international prices upwards and thereby buffers farm incomes. However, tariffs and retaliatory measures have impeded this price-support mechanism.
– Despite a late 2025 bilateral agreement committing China to purchase at least 25 million metric tons of U.S. soybeans annually through 2028, a residual 10 percent supplemental Chinese tariff remains in place, Brazil has gained a durable market share, and the Iran conflict further complicates U.S.-China trade normalization.
– Consequently, domestic ethanol and biodiesel markets arise as the key mechanism for sustaining U.S. grain and oilseed prices in 2026, precisely because they bypass the tariff-blocked export channel. High crude oil prices strengthen the role of biofuels markets in price formation.
– The EPA’s finalized “Set 2” renewable fuel standard (RFS) rule, announced March 27, 2026, establishes record-high volume obligations for 2026–27 and is projected to require a 60 percent increase in domestic biodiesel and renewable diesel production relative to 2025 levels. This is a legally binding demand signal for soybean oil as a primary feedstock and leverages domestic crush markets, which are insulated from export tariff dynamics.
– El Niño conditions developing in the second half of 2026 represent a wildcard: they could tighten global oilseed and vegetable oil supplies (price-supportive for soybeans), while their effects on U.S. Corn Belt production remain uncertain and timing-dependent.
– The net commodity price outlook for 2026 is more cautionary than historical precedent suggests. Corn faces continuing pressure relative to breakeven costs, while soybean prices are better supported by biofuel demand but remain structurally constrained on the export side. Duration of the Iran conflict, pace of industry compliance with the finalized RFS mandates, growth in E15 retail infrastructure and El Niño timing are the several key determinants to monitor.
I. Introduction: A Different Analytical Question
Brief #2026-1 of this series assessed the Iran conflict through the lens of farm input costs. Guided by historical precedents, we concluded that the impact on farms depends heavily on conflict duration, farm purchasing decisions and the commodity price response.
This brief turns to the output price side of that equation. While the conflict drives farm input costs, interactions in commodity markets would be expected to offer some remedy as persistently high crude oil prices lead to grain and oilseed price increases. These price responses are, of course, dependent on a number of market factors, including the responsiveness of importers to U.S. commodity exports. Therein lies the complicating factor when considering 2026, for example, to the 2022 onset of the Russia-Ukraine conflict. U.S. grain exports now face a structural barrier due to current trade policies that was largely absent in previous energy shocks, namely, the partial foreclosure of the U.S. grain export channel to China.
Three forces interact to shape the 2026 commodity price outlook: (1) the trade policy headwind created by tariffs and retaliatory measures that suppress the transmission of supply tightening into higher U.S. export prices; (2) a biofuel demand tailwind that works through domestic markets and is strengthened by elevated oil prices and renewable fuels policy; and (3) the emerging El Niño climate pattern that elevates production uncertainty in both the U.S. and global crops. The sections below examine each force in turn, drawing on available research and data, before synthesizing the implications in a scenario-based outlook.
II. The Standard Price Transmission — and Why It Is Partially Blocked in 2026
In a normal agricultural commodity market, an energy-driven input cost shock has the potential to trigger a sequence of supply-side responses that ultimately support output prices. Higher fertilizer and fuel costs reduce profit margins at current price ratios; farmers respond by cutting inputs, shifting to less nitrogen-intensive crops, and planting fewer acres overall. The resulting supply tightening puts upward pressure on commodity prices, partially restoring margins.
The price transmission channel runs, in substantial part, through international markets. For decades, the United States was the world’s largest soybean exporter and one of the largest corn exporters. When domestic supply tightens relative to expectations, prices rise most efficiently through foreign demand when the marginal buyer — historically, China — readily absorbs incremental U.S. supplies. In 2022, Chinese state-owned enterprises were actively purchasing under tariff waivers, and, in addition, the simultaneous Russia-Ukraine supply shock in the black Sea region removed one of the alternatives.
In 2026, the export demand channel is structurally narrowed as U.S. tariffs and retaliatory measures imposed by China have isolated U.S. markets and introduced a wedge between U.S. export prices and the price Chinese buyers pay. This wedge makes Brazilian and Argentine supplies relatively more competitive in the Chinese market. Moreover, Ukraine has successfully resecured its trade routes through the Black Sea and restored meaningful corn and wheat supply to international markets, including to China. The partial trade normalization achieved in the late-2025 U.S.-China bilateral agreement failed to eliminate this wedge, and Brazil has sustained a significant share of Chinese soybean purchases. This is the central structural fact that distinguishes 2026 from prior energy shock episodes.
III. The Trade Policy Headwind: Tariffs and the China Channel
From Trade War to Bilateral Agreement — and Back
The current configuration of U.S.-China agricultural trade is the product of a multi-year escalation that accelerated sharply in 2025. Following the Trump administration’s broad tariff actions in April 2025, China responded by imposing retaliatory tariffs on U.S. agricultural products, effectively suspending large-scale purchases of U.S. soybeans — the single largest U.S. agricultural export by value. The collapse in Chinese purchases was rapid and severe.
A bilateral agreement concluded in late 2025 provided partial restoration of trade flows. Under that agreement, China committed to purchasing at least 25 million metric tons of U.S. soybeans annually through 2028. Those volumes are broadly comparable to U.S. soybean export shipments to China in 2023 and 2024, but well short of the 34 million metric tons China imported in 2020. Importantly, the agreement does not eliminate the residual 10 percent supplemental tariff China retained on U.S. soybeans, leaving U.S. exporters at a disadvantage relative to Brazil and Argentina in the Chinese market. As the American Enterprise Institute’s Joseph Glauber — former USDA chief economist — noted in a recent assessment, with the supplemental tariff remaining in place, Chinese state-owned trading companies may comply with minimum purchase commitments but have little economic incentive to exceed them.
It is worth noting that the first-round Chinese retaliatory tariffs imposed in 2018 were formally still on the books during the 2022 marketing year. What made that year’s export flows robust was not the absence of tariffs but rather a systematic Chinese practice of granting waivers to state-owned enterprises — waivers that effectively neutralized the formal tariff rate and kept the export channel open. The operative deterioration in 2025 was the suspension of those waivers, not the introduction of a new tariff regime. Even after the late-2025 bilateral agreement partially restored purchases, tariff waivers have not been reinstated, and Brazil has used the intervening disruption to cement structural gains in the Chinese market that will not easily reverse.
The Iran conflict has added a new friction. A U.S.-China summit that soybean market participants had hoped would accelerate additional purchase commitments was delayed, and further Chinese purchases remain uncertain. China’s geopolitical alignment with Iran has complicated the bilateral relationship at precisely the moment that agricultural trade normalization was most needed.
The Brazil Factor: Structural Market Share Loss
Perhaps the most durable consequence of the 2025 trade disruption is the acceleration of Brazil’s position as the dominant supplier of soybeans to China. Brazil’s exports to China reached record levels in 2025. Once Brazilian infrastructure investment and acreage expansion capture a given level of Chinese demand, those trade flows tend to be sticky — the logistics chains, financing arrangements, and buyer relationships persist even after the policy environment that created them changes. Empirical trade research has consistently documented that trade disruptions of the type experienced in 2018-2019 and in 2025 produce persistent market-share losses that are not fully recovered when tariffs are lowered. The same structural forces are likely operating now.
For corn, a parallel picture has emerged with Mexico and Canada — the largest and third-largest export markets for U.S. corn, respectively. Tariff-related tensions with both neighbors have introduced uncertainty into U.S. corn export flows, though with less severity than the soybean-China disruption, given the regional logistics advantages U.S. corn maintains.
The Price Implication
The direct price implication is that the tightening market supply effects described in Section II — corn acreage shifting to soybeans, fertilizer rate reductions reducing yields — generates less of a boost to commodity prices than it would have in prior years when China was consistently importing large quantities of U.S. soybeans with little sensitivity to price fluctuations. When China faces a cost penalty for acquiring soybeans from the U.S. and has cost-effective options to source them elsewhere, the U.S. market price must fall considerably more than in previous years. Research from the National Corn Growers Association and FAPRI modeling found that Chinese tariff re-imposition at levels comparable to those in place in 2025 could depress U.S. soybean prices by approximately $0.60 per bushel below baseline on average, with price increases accruing instead to Brazilian and Argentine producers.
IV. The Biofuel Lifeline: Domestic Demand and Elevated Oil Prices
The partial foreclosure of the export demand channel puts downward pressure on commodity prices and makes domestic demand, specifically the biofuel sectors, a relatively important source of disappearance. This is another structural factor of U.S. grain and oilseed markets and – unlike export flows – not subject to retaliatory tariffs. High oil prices incentivize more biofuel production, driving demand for soybeans and corn. However, it is important to keep in mind that domestic demand for soybeans and corn for biofuels is considerably more price sensitive than pre-2025 Chinese demand for imported feedstuffs. That is, ethanol and biodiesel economics move directly with the oil-gasoline spread, whereas Chinese crushing demand for feed and food is driven by underlying livestock and consumption growth that is less responsive to short-run commodity price fluctuations.
The Oil-Ethanol-Corn Connection
Corn-based ethanol has, over the past two decades, become tightly linked to fossil fuel markets. University of Illinois economist Scott Irwin put it plainly in a recent commentary: “High crude oil prices are not necessarily bad for biofuels, and therefore not necessarily bad for Corn Belt agriculture.” He added that “ethanol is now driven by the economics of fossil fuels.” The practical implication is that sustained crude oil prices above $80 per barrel — the range that most current projections now assume for 2026 as a whole — strengthen ethanol margins, support crush demand, and provide a price floor for corn that operates independently of export market conditions.
The economic logic is straightforward: when gasoline prices rise, ethanol’s value as an octane-enhancing blending component rises with it. Blenders are willing to pay more for ethanol relative to unblended gasoline when crude oil is expensive, supporting the corn price through the crush margin. Furthermore, ethanol’s octane value makes it unlikely that blending volumes would decline significantly even if policy mandates were reduced — a point Irwin has made explicitly in policy discussions.
The current policy debate over summer sales of E15 (fuel blended with 15 percent ethanol rather than the standard 10 percent) would have little impact on 2026 prices, as the EPA has already waived the prohibition for 2026. Farm country advocates of year-round E15 are looking for the policy certainty that would foster increased E15 infrastructure that significantly expands the ~3 percent[1] of retail fuel suppliers currently selling the higher blend rate.
The Oil-Biodiesel-Soybean Oil Connection
For soybeans, the analogous mechanism runs through soybean oil, which is a primary feedstock for biodiesel and renewable diesel. When crude oil prices rise, the economics of vegetable oil-based fuels improve, supporting soybean crush demand and soybean oil prices. This price linkage has become more robust as the renewable diesel sector has expanded, creating a larger industrial demand for soybean oil beyond the food sector.
The regulatory dimension is now settled. On March 27, 2026, EPA finalized the “Set 2” rule establishing RFS volume obligations for 2026 and 2027 at the highest levels in program history. The final biomass-based diesel (BBD) applicable volume stands at 9.07 billion RIN gallons for 2026 and 9.20 billion for 2027 — a substantial increase from prior years that EPA estimates will require a 60 percent increase in domestic biodiesel and renewable diesel production relative to 2025 levels. Total renewable fuel obligations reach 26.81 billion gallons in 2026, up roughly 19 percent from the 2025 obligation.
Analysis by Hubbs and Irwin at the University of Illinois (farmdoc daily, April 16, 2026) characterized the scale of the BBD obligation as “unlike anything the biomass-based diesel sector has previously confronted,” with substantial implications for soybean oil demand as the primary domestic feedstock. These are legally binding mandates, and they operate entirely through domestic crush markets, unaffected by export tariff dynamics.
The practical implication of both channels together is that elevated oil prices in 2026 provide support for both corn and soybean prices that is isolated from export demand and does not require resolution of the tariff situation. This is not a complete substitute for robust Chinese export markets. The magnitude of price support is more modest, but it is the most reliable partial offset available given the current trade environment.
Figure 1 below illustrates the growth in domestic biofuel demand for corn and soybean oil over time.
Figure 1
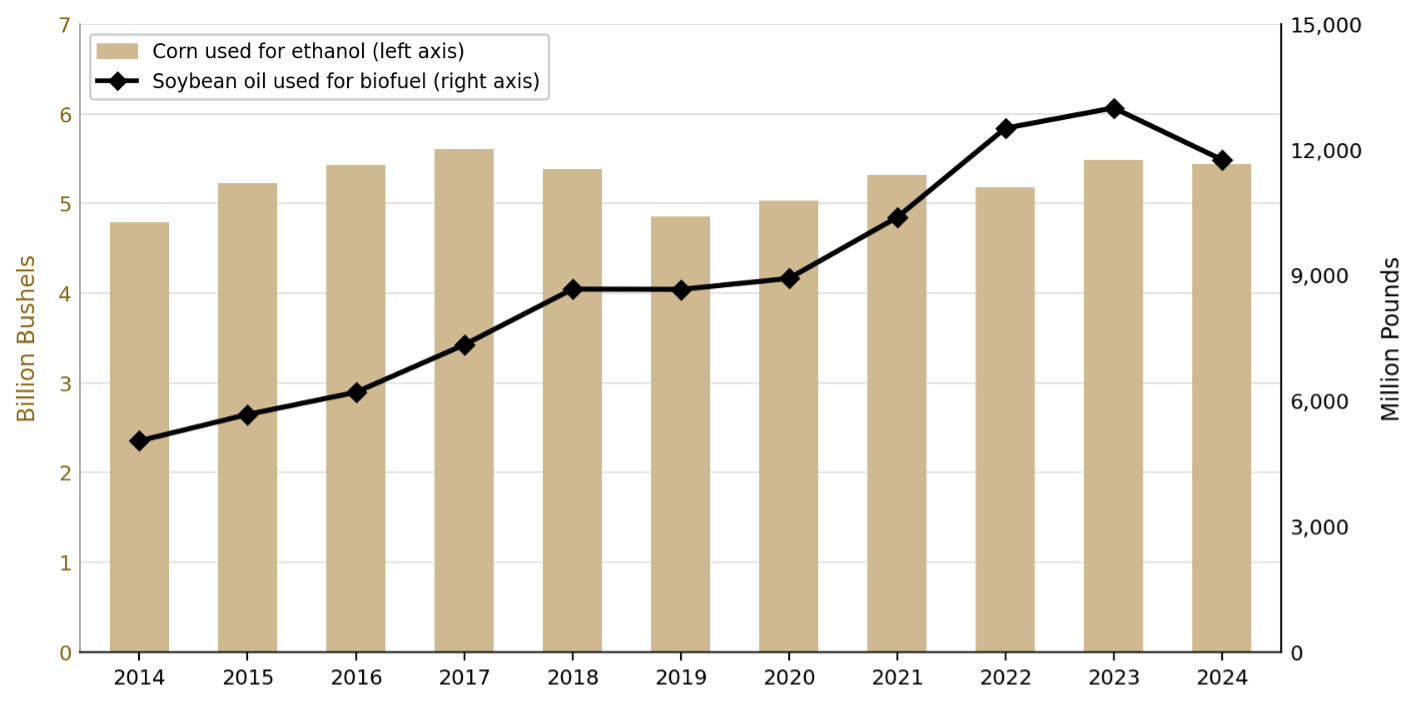
Corn used for fuel ethanol (billion bushels, left axis) and soybean oil used for biofuel (million pounds, right axis), marketing years 2014–2024. Soybean oil biofuel use is the product of the share of soybean oil used for biofuel and total soybean oil disappearance (Table 6). Corn marketing year runs September–August; soybean oil marketing year runs October–September, labeled by first year. The 2019 dip in corn reflects flood-delayed plantings; the 2024 dip in soybean oil reflects a partial drawdown from the prior year’s record. Sources: USDA Economic Research Service, U.S. Bioenergy Statistics, Table 1 (corn, marketing year September–August) and Table 6 (soybean oil, marketing year October–September); https://www.ers.usda.gov/data-products/us-bioenergy-statistics. Updated April 2026.
A lifeline that is conditional on oil prices
The biofuel support channel is, however, conditional on elevated oil prices. When oil prices normalize and return to their long-term downward trend, whether through conflict resolution, OPEC production expansion, or accelerating energy transition, voluntary blending above the RFS mandate floor will contract, and the marginal price support for both corn and soybean oil will diminish accordingly. The RFS mandate itself provides a demand floor, but at low oil prices, that floor supports crush volumes that are not backed by blending economics and will compress margins elsewhere in the supply chain.
V. The El Niño Wildcard: A 2026 Price Signal, Mostly a 2027 Supply Story
The El Niño Southern Oscillation (ENSO) cycle is relevant to the 2026 commodity price outlook, but the mechanism through which it matters is indirect, forward-looking and requires careful attention to timing.
What the Forecasts Say
After a La Niña phase that persisted into early 2026, Pacific sea surface temperatures (SST) have risen rapidly. NOAA’s Climate Prediction Center characterizes current conditions as ENSO-neutral, with El Niño likely to emerge in the May–July 2026 window and persist through year-end. As of mid-April 2026, the Niño 3.4 index — the primary monitoring region in the central equatorial Pacific — had just reached the +0.5°C threshold that formally defines El Niño onset, according to the International Research Institute for Climate and Society’s April plume forecast. Most climate models project continued intensification through the second half of 2026, reaching strong El Niño territory by the fourth quarter of the year (October–December). A minority of model approaches assign meaningfully lower probabilities to a strong event, and forecast uncertainty remains substantial through the spring barrier — the period of historically lowest ENSO predictive skill.
Why the 2026 U.S. Crop Is Largely Past the Window of Direct Risk
The critical point for commodity markets is the relationship between the timing of El Niño development and the U.S. growing-season calendar. Corn planting runs April through May; the most climatically sensitive stage — pollination — occurs in late July and early August; harvest begins in September. Against that calendar, the El Niño timeline is important: conditions are just crossing the threshold of official onset in May–July, meaning the crop will be planted under ENSO-neutral conditions, will pollinate during the early development phase of a still-intensifying event, and will be substantially harvested before El Niño approaches anything close to its projected peak.
A developing El Niño can influence Corn Belt weather, but the effects during the development phase are considerably weaker and less spatially predictable than during a fully established, peaked event. The historical record of analog years — particularly 2009, when a developing El Niño during the growing season produced broadly favorable Corn Belt conditions — counsels against assuming that development-phase El Niño is synonymous with yield-reducing drought. The direct production risk to the 2026 U.S. corn and soybean crop from El Niño, taken alone, is therefore likely modest under current projections.
The 6–12 Month Lag and the 2027 Supply Story
The more consequential agricultural channel runs through the relationship between El Niño’s development timeline and the growing season in key competitor regions. The agricultural consequences of El Niño are realized through growing season timing in each affected region, not through a fixed lag from the Pacific SST peak. Whether a given harvest is impacted depends on which phase of El Niño — developing, mature, or decaying — overlaps a region’s critical growth period. For Australia’s winter wheat and Brazil’s safrinha corn, the relevant exposure window falls in the second half of 2026, when El Niño will be intensifying but not yet at peak. For South and Southeast Asian oilseed crops, the critical monsoon exposure runs June–September 2026. The full global supply consequences — particularly for palm oil, where yield impacts on perennial crops accumulate over multiple seasons — are likely to extend well into 2027. The global oilseed supply tightening most relevant to U.S. soybean prices should unfold in 2027.
How El Niño Matters for 2026 Commodity Prices
The production impact of a strong El Niño on each of these competitor regions is adverse, though the severity is highly uncertain.
In Australia, El Niño is strongly associated with below-normal rainfall across the southern and eastern grain belt during the winter wheat crop’s planting and establishment window (May–July) and continuing through grain fill (August–October); strong historical events — notably 1982–83 and 1997–98 — produced wheat yield declines of 20–40 percent in affected regions, and a comparable outcome in 2026–27 would tighten world markets and modestly redirect import demand toward U.S. supplies.
For Brazil’s safrinha corn, El Niño reduces rainfall in the central production states during June–July grain fill; late-planted safrinha, which is common when the preceding soybean harvest runs long, is particularly exposed because it reaches its most moisture-sensitive stage deeper into the dry season, and significant shortfalls would tighten global coarse grain supply in ways that directly enhance U.S. corn export competitiveness.
In South and Southeast Asia, El Niño’s suppression of the South Asian monsoon (June–September) reduces planted area and yields for Indian groundnuts, rapeseed, and soybeans, increasing Asian import demand for vegetable oils; simultaneously, drier conditions in Indonesia and Malaysia reduce palm oil yields that compete as a partial substitute for soybean oil. The effect of palm supply tightening would be to additionally boost U.S. soybean oil prices, alongside the biofuel demand channel already discussed.
The important caveat is that a strong El Niño does not guarantee severe impacts across all of these regions simultaneously — the precise spatial pattern of rainfall anomalies varies considerably from one event to the next, and the 2026 event may be more consequential in some regions than others. The overall directional signal is price-supportive for U.S. corn and soybeans, but the magnitude of that support will depend on which competitor growing regions bear significant moisture stress and how well Southern Hemisphere producers have prepared through irrigation, variety selection, and other mitigating strategies.
The practical implication for 2026 commodity price analysis is that El Niño’s relevance operates primarily through futures markets and forward price expectations rather than through direct 2026 production losses in the United States. Commodity prices incorporate expected supply tightening in advance. If the SST trajectory continues to build as currently forecast, the farmers, traders and end-users will price developing 2027 supply risks into 2026 new-crop and deferred futures — providing upward pressure on 2026 marketing-year prices through the expectations channel, even absent near-term U.S. production shortfalls. This is a real path for stronger prices, but it is more fragile and more easily reversed than support driven by realized production losses. A monsoon that comes in near-normal, or a summer SST plateau rather than continued intensification, would substantially reduce the forward supply risk premium.
The NOAA CPC’s next ENSO Diagnostic Discussion, due in mid-May 2026, and the June International Research Institute model update will be the most important near-term data points for assessing whether the intensification trajectory remains on course. Readers monitoring this issue should consult NOAA CPC directly at www.cpc.ncep.noaa.gov.
VI. Synthesis: A Commodity Price Outlook by Scenario
Corn
Corn faces the most challenging price environment of the major field crops in 2026. The combination of nitrogen fertilizer price increases, export market uncertainty (China and Mexico), and below-trend pre-conflict prices creates a difficult starting point. USDA’s pre-conflict February 2026 Grains and Oilseeds Outlook projected the 2026/27 season-average corn price at $4.20 per bushel — a level that leaves thin or negative margins for many producers at current input costs, even when accounting for what are expected to be modest government payments.
The ethanol demand channel provides a partial floor, but it is not sufficient to fully offset the headwinds – especially given the ethanol blend wall. Corn’s least favorable scenario is likely a prolonged Iran conflict with persisting tariff headwinds and a late, weak El Niño that allows Corn Belt production to come in near trend — leaving the market to clear primarily through domestic demand adjustment at prices that may not cover costs for producers who did not pre-purchase inputs.
Table 1 below summarizes the directional price implications under four composite scenarios defined by conflict duration and El Niño intensity.
| Conflict resolves by mid-June | Conflict prolonged beyond 3 months | |
| Weak / Late El Niño (ENSO neutral through summer) | Corn: Modestly bearish — tariff headwind persists and limits commodity price response; ethanol demand provides a partial floor. Fertilizer and fuel costs partially retrace as the Strait reopens, moderating the input squeeze as the season progresses.
Soybeans: Near-neutral — biofuel demand supports soybean oil; China deal limits downside but structural export weakness remains. Easing input costs partially restore margins. Net: Prices near but below USDA pre-conflict baseline; cost relief on the input side is the key distinguishing feature. |
Corn: Bearish — elevated fertilizer and fuel costs persist through the full marketing year with no cost-side relief. Revenue support is limited to the ethanol demand floor. Producers who did not pre-purchase inputs face the full cost squeeze with no offsetting price response.
Soybeans: Mixed — finalized RFS mandates and China purchase commitment provide a price floor, but the tariff overhang caps upside and no input cost relief materializes. Margins remain under sustained pressure. Net: The prolonged conflict scenario is distinguished from the short conflict not by revenue differences but by the duration and severity of the input cost burden. |
| Strong / Early El Niño (developing by June–July 2026) | Corn: Mixed — U.S. Corn Belt dryness risk (July) introduces yield uncertainty; global palm/oilseed supply tightening supportive.
Soybeans: Modestly bullish — global oilseed supply constraint from El Niño plus biofuel demand; tariff headwind partially offset. Net: Soybean prices above baseline; corn outcome depends on U.S. Corn Belt moisture. |
Corn: Highly uncertain — yield risk layered onto cost and trade headwinds; could produce significant price support if U.S. acreage and yield both disappoint.
Soybeans: Most bullish scenario — global oilseed tightening, strong biofuel demand, and supply constraints converge; tariff headwind becomes secondary. Net: Widest range of outcomes; closest analog to the full 2022 income offset. |
Table 1. Directional commodity price implications for U.S. corn and soybeans under four composite scenarios defined by Iran conflict duration and El Niño intensity. All scenarios assume the current tariff and trade policy baseline (residual 10% Chinese supplemental tariff on U.S. soybeans; active RFS volume mandates). Scenarios are intended to be analytical reference points, not price forecasts. See text for assumptions underlying each cell.
Soybeans
Soybeans present a more nuanced picture than corn, with identifiable offset mechanisms that partially counter the export headwind. The biofuel demand channel — particularly the expanding renewable diesel sector and the finalized RFS volume mandates — operates through domestic crush demand and is not affected by tariff barriers. This provides a more durable price floor for soybeans than corn, because soybean oil’s use in renewable diesel has grown to a scale that materially influences the soybean complex price.
The China commitment of 25 million metric tons per year through 2028 sets a floor under U.S. export volumes, though not under prices, given the residual tariff wedge. The critical price risk for soybeans is that Brazil’s continued expansion — supported by record 2025 crop performance — keeps global soybean supplies ample enough that the China purchase commitment is met at prices unfavorable to U.S. producers. El Niño-related disruptions to global oilseed supply chains (palm oil, Indian oilseeds) represent the most significant upside price catalyst available, and one that could partially offset the trade headwind for soybean oil in particular.
The Soybean Oil vs. Meal Split
A structural feature of the current market deserves explicit attention: elevated biofuel demand for soybean oil is likely to widen the oil-meal price ratio in ways that favor soybean oil and put relative pressure on soybean meal. This has favorable implications for processors (who benefit from strong crush margins when oil is supported relative to meal) and for livestock producers, who benefit from the increase in meal availability for feed and corresponding downward pressure on meal prices that results from crush volumes expanding to meet oil demand. Producers and analysts monitoring the soybean complex should track both components separately, as the compositional demand shift toward oil may not be fully captured in aggregate soybean price summaries.
VII. Key Signals to Watch
Five data points and policy developments will do more than any model to determine the commodity price trajectory through the 2026 marketing year:
– S.-China trade relationship: The pace at which China meets its 2026 purchase commitments and any movement toward reducing the residual supplemental tariff are the single most important variables for soybean prices. A rescheduled U.S.-China summit and any announcement of tariff relief would be immediately price-supportive.
– RFS compliance and industry ramp-up: The “Set 2” final rule is settled, but compliance is not automatic. EPA projects a 60 percent increase in domestic biodiesel and renewable diesel production will be required to meet the 2026 BBD obligation — a target that will strain existing capacity, given that many facilities ran well below prior-year production in 2025 due to market uncertainty. Monitor monthly EIA biodiesel and renewable diesel production data to assess whether industry is actually ramping to meet the mandate. Shortfalls in compliance would reduce effective soybean oil demand below the mandated level; over-compliance is unlikely given the capacity constraints. Separately, the interplay between the RFS mandates and the §45Z Clean Fuel Production Credit merits attention, as uncertainty about that credit’s implementation could affect investment decisions and production timelines.
– NOAA ENSO updates through May–June: The timing and intensity of El Niño development through the critical May–July window will determine both U.S. growing-season risk and the global oilseed supply outlook. The NOAA Climate Prediction Center issues monthly ENSO outlooks (www.cpc.ncep.noaa.gov).
– USDA May 12 WASDE: The May World Agricultural Supply and Demand Estimates will be the first official USDA supply/demand report incorporating actual 2026 planting intentions from the March 31 Prospective Plantings report and initial 2026/27 foreign production projections. This report will anchor the market’s baseline price expectations for the marketing year.
– Crude oil trajectory: The strength of the biofuel demand channel depends critically on whether crude oil is sustained above $80 per barrel. A rapid return toward $65–$70 (as occurred after the brief June 2025 conflict) would weaken ethanol and biodiesel margins and remove the primary domestic price-support mechanism. Current market projections assume an average near or above $80 for 2026 as a whole, but that assumption should be treated as conflict-duration-dependent.
References and Data Sources
Current Situation and News Sources
- Tripp, C., American Ag Network / Agriculture of America. (2026, April 21). “Beyond the pump: Gas prices are shaping biofuel demand.” https://www.americanagnetwork.com/2026/04/21/beyond-the-pump-gas-prices-are-shaping-biofuel-demand/
- Luck, P., Center for Strategic and International Studies (CSIS). (2025, October). “When a Trade War Becomes a Food Fight.” https://www.csis.org/analysis/when-trade-war-becomes-food-fight
- Colussi, J., and Langemeier, M., Farmdoc Daily / (2025, November 17). “U.S.–China Soybean Deal: Comparing Past Export Levels and Global Market Impacts.” University of Illinois. https://farmdocdaily.illinois.edu/2025/11/us-china-soybean-deal-comparing-past-export-levels-and-global-market-impacts.html
- Glauber, J., American Enterprise Institute (2026, April). “Evaluating the Impact of Tariffs on U.S. Agriculture a Year After Liberation Day.” https://www.aei.org/research-products/report/evaluating-the-impact-of-tariffs-on-us-agriculture-a-year-after-liberation-day/
- Halderman Farm Management. (2026, April). “How Does the War with Iran Impact Agriculture in 2026?” https://www.halderman.com/iran-war-impact-agriculture-2026/
- Lakhanpal, V., MOST Policy Initiative. (2026, February 27). “Tariff Relief for Farmers.” https://mostpolicyinitiative.org/science-note/tariff-relief-for-farmers/
- Kelety, J. and Ferkenhoff, E., PBS NewsHour. (2026, April). “Already under financial pressure, farmers squeezed further by tariffs and Iran war.” https://www.pbs.org/newshour/nation/already-under-financial-pressure-farmers-squeezed-further-by-tariffs-iran-war
Industry and Government Data Sources
- USDA Economic Research Service. U.S. Bioenergy Statistics. Includes Tables on corn used for ethanol and soybean oil used for biodiesel/renewable diesel. https://www.ers.usda.gov/data-products/us-bioenergy-statistics
- USDA Foreign Agricultural Service. Production, Supply and Distribution (PSD) Online Database. Soybean trade flows by country of origin and destination. https://apps.fas.usda.gov/psdonline/app/index.html#/app/compositeViz
- USDA World Agricultural Outlook Board. (2026, February 19). “Grains and Oilseeds Outlook.” Pre-conflict USDA baseline projections for corn and soybean 2026/27 supply, demand, and prices. https://www.usda.gov/sites/default/files/documents/2026AOF-grains-oilseeds-outlook.pdf
- USDA Economic Research Service. Cost of Production / ARMS. Per-acre input cost breakdowns by commodity. https://www.ers.usda.gov/data-products/commodity-costs-and-returns
- U.S. Environmental Protection Agency. (2026, March 27). “Renewable Fuel Standard (RFS) Program — Standards for 2026 and 2027: Final Rule (‘Set 2’).” Published in Federal Register April 1, 2026; effective June 15, 2026. https://www.epa.gov/renewable-fuel-standard/final-renewable-fuel-standards-2026-and-2027
- NOAA Climate Prediction Center. ENSO Outlook (monthly updates). https://www.cpc.ncep.noaa.gov
- National Association of Convenience Stores (NACS), “Convenience Stores Sell the Most Gas,” https://www.convenience.org/Topics/Fuels/Who-Sells-Americas-Fuel
- Richman, S., “Nationwide E15 Sales Jump 23% In 2025, Setting New Record: As Gasoline Prices Soar, the Need for Federal Legislation Allowing Year-Round E15 Sales Is Clearer Than Ever Before,” Renewable Fuels Association. (2026, April 2). https://ethanolrfa.org/file/3078/2025%20Nationwide%20E15%20Sales_RFA_2026-04-02.pdf
Academic and Extension Research
- Carter, C., and Steinback, S. (2020). “The Impact of Retaliatory Tariffs on Agricultural and Food Trade.” NBER Working Paper 27147. https://www.nber.org/papers/w27147
- Grant, J., Arita, S., Emlinger, C., Johansson, R., and Xie, C. (2021). “Agricultural Exports and Retaliatory Trade Actions: An Empirical Assessment of the 2018-2019 Trade Conflict.” Applied Economic Perspectives and Policy, 43(2), 619-40.
- Iizumi, T., Luo, J., Challinor, A.J. et al. (2014), “Impacts of El Niño Southern Oscillation on the global yields of major crops,” Nature Communications, 5, 3712. https://doi.org/10.1038/ncomms4712
- Cao, J., Zhang, Z., Tao, F., Chen, Y., Luo, X., and Xie, J. (2023). “Forecasting global crop yields based on El Niño Southern Oscillation early signals.” Agricultural Systems, 205, 103564. https://doi.org/10.1016/j.agsy.2022.103564
- Scott, F. and Cooray, A., “Biofuel Policies Are Likely to Drive Future Demand for U.S. Corn and Soybeans.” Kansas City Federal Reserve. (2026, January). Economic Bulletin. https://www.kansascityfed.org/research/economic-bulletin/biofuel-policies-are-likely-to-drive-future-demand-for-us-corn-and-soybeans/
- Hubbs, T., and Irwin, S. (2026, April 16). “Rewriting the RFS Playbook: Final 2026–2027 RVOs for Biomass-Based Diesel.” farmdoc daily (16):66, Department of Agricultural and Consumer Economics, University of Illinois. https://farmdocdaily.illinois.edu/2026/04/rewriting-the-rfs-playbook-final-2026-2027-rvos-for-biomass-based-diesel.html
- Swanson, K., Gerlt, S., and Holland, J., “Trade Study: How Potential New Tariffs Could Impact U.S. Soybeans and Corn.” National Corn Growers Association / FAPRI, University of Missouri. (2024). https://www.ncga.com/stay-informed/media/the-corn-economy/article/2024/10/trade-study-how-potential-new-tariffs-could-impact-u-s-soybeans-and-corn
- Thayer, A., Sun, P., Tejeda, H., and Kim, M-K. (2025). “Exploring the Impact of China’s Retaliatory Tariffs on U.S. Soybean Exports with Machine Learning Techniques.” Journal of Agricultural and Applied Economics. Cambridge University Press. https:// doi:10.1017/aae.2025.6
- Tyner, W.E. (2010). “The integration of energy and agricultural markets.” Agricultural Economics, 41, 193–201. https://doi.org/10.1111/j.1574-0862.2010.00500.x
- Paulson, N., Schnitkey, G., Zwilling, B., and Zulauf, C., 2026 Crop Budgets, University of Illinois farmdoc. https://farmdocdaily.illinois.edu/2025/08/2026-illinois-crop-budgets.html
- Glauber, J., and Laborde, D. (2022). “How Russia’s invasion of Ukraine is affecting commodity markets and food security.” IFPRI Blog. https://www.ifpri.org/blog/how-will-russias-invasion-ukraine-affect-global-food-security/
- Westhoff, P., Whistance, J., Cooper, J., and Meyer, S. (2022). “Impacts of Russia’s Invasion of Ukraine on U.S. Agriculture.” Choices, 38(2). https://www.choicesmagazine.org/UserFiles/file/cmsarticle_862.pdf
[1] Authors’ calculation: 4,600 E15 stations per Richman (RFA), divided by 150,000 total fueling stations per NACS.
![]()
![]()
![]()
![]()
![]()