It’s All Lower: Cow numbers, Total Milk Production, Forecasted Domestic Use and Milk Prices Too
December 5, 2018
PAER-2018-18
Authors: Courtney Bir, Ph.D. Candidate and Research Associate and Nicole Olynk Widmar, Professor of Agricultural Economics
![]()
![]()
![]()
![]()
![]()
Milk price trends make reaching break-even look bleak for many farms. Recent news media related to dairy farming in the U.S. has been difficult to even see or hear, let alone to actually live though on the farm. Untimely and delayed harvests in many parts of the U.S. make predicting feed costs difficult, in addition to the lingering questions about quality. As of now, the verdict is still out on the quality of the new crop in many parts of the country. While not the focus here, continued developments with respect to grain trade, tariffs, and the Farm Bill also infuse uncertainty into grain markets. Grain markets necessarily impact livestock markets through feed prices, although the added stress of feed price uncertainty in a particularly tight margin situation for dairy farmers today seems to be ratcheting up concerns to (seemingly endless) market news. Prior to harvesting difficulties, feed prices had been down. The cost of hay is not necessarily a bright spot for U.S. dairy farmers in 2019. The price of Alfalfa hay in August of this year was $177 per short ton, up $30 dollars from August of last year (USDA, 2018). However, forage markets are notoriously localized. So, changes of the national average in hay prices can be forage costs, but individual locales may face different price scenarios.
Although the dairy cow herd size is decreasing, improvements in lbs of milk-per-cow is offsetting any potential decrease in milk production. Increased culling, while effectively reducing cows in production, should yield improvements in efficiency and improve overall milk production on a per-cow basis, as low-producers are eliminated from herds. As of September 2018 the dairy herd has decreased to 8.7 million, down from the record high of 9.4 million last year (USDA, 2018). However, production is up approximately 30 pounds per cow compared to September 2017 to 1,880 pounds (USDA, interpreted on the aggregate as pointing towards higher2018). The predicted total milk production for 2018 is 217 billion lbs (LMIC, 2018).
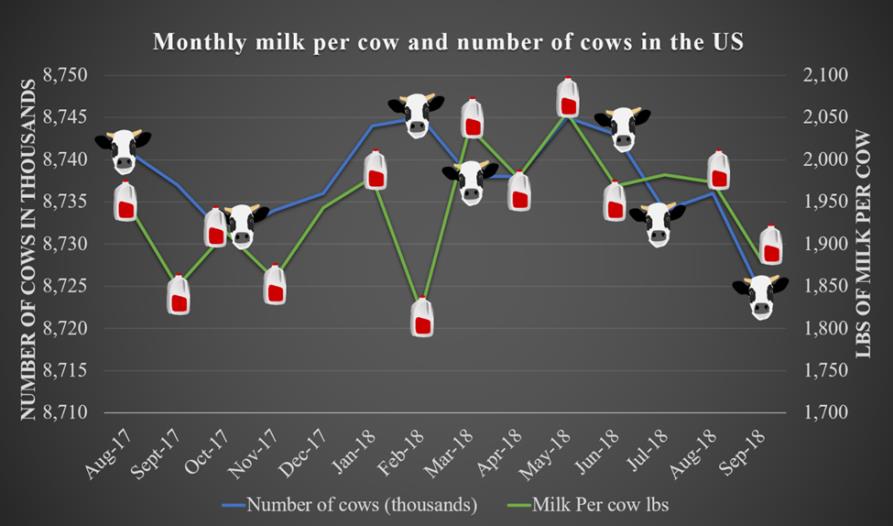
A look at the changing number of cows in the U.S. cowherd and pounds of milk produced per cow on a monthly basis. Data source: United States Department of Agriculture Economic Research Service, Dairy Data 2018. Graphic developed by Courtney Bir, 2018.
Consumption of last year’s (dairy products) shinning stars, butter and cheese, is remaining steady (USDA). The price of Grade AA butter on the Chicago Mercantile exchange has averaged $2.25 a pound as of September this year. On the Chicago Mercantile exchange 40 lb blocks of cheddar cheese have averaged $1.58 a pound as of September this year while 40 lb barrels have averaged $1.44 (USDA). Both butter and cheese prices have weakened compared to last year. Oceania export prices for butter have been trending downward, with a 28% decrease in price this October compared to October of 2017. Nonfat dry milk Oceania export prices have fared slightly better, trending upward with an 8% increase in price this October compared to October 2017.
The all-milk price remains low. The USDA last forecasted lowered Class III prices at $15.15-$16.05 per cwt and unchanged Class IV at $14.35-$15.35 per cwt. The results of the lowered Class III was an all- milk price for 2019 that was lowered 15 cents at the midpoint from the previous estimate, set in the November outlook at $16.70-$17.60 per cwt.
![]()
![]()
![]()
![]()
![]()
