Manufacturing in the Indiana Economy
May 12, 1998
PAER-1998-07
Steven McCoy, Graduate Student, and Kevin McNamara, Professor
![]()
![]()
![]()
![]()
![]()
Indiana’s favorable geographic location, large labor pool, and manufacturing-friendly state and local government policies have been instrumental in attracting and retaining manufacturing firms (Houin and McNamara, PAER, Nov. 1997). Employment growth in the Indiana manufacturing industry from 1983 to 1995 is evidence of this success. Indiana’s manufacturing employment growth rates are particularly impressive when compared to the national economy.
The U.S. economy grew by 34 mil-lion jobs from 1983 to 1995, a growth rate of 29%. The Indiana economy grew by 773,000 jobs, a growth rate of 36%. While a similar rate of eco-nomic growth occurred at both the national and state level, performance in the manufacturing sector was quite different. Nationally, manufacturing accounts for 13% of total employment and grew by 2% from 1983 through 1995. In Indiana, manufacturing accounts for 27% of all jobs and grew by 18% over the 1983-1995 period.
Manufacturing is not only a substantial source of employment but is an important source of revenue for the people and state of Indiana as well.
Of the $132 billion Indiana Gross State Product, 31% or $40 billion was attributable to the manufacturing sector (1994 Survey of Current Business). At the national level, manufacturing contributed 18% or$1.2 trillion of the Gross Domestic Product of $6.5 trillion in 1994. This article begins with a comparison of trends in national manufacturing sectors to the same sectors in Indi-ana over the 1983-1995 period. The manufacturing economy is broken into 20 standard industrial classification SIC (Standard Industrial Classification Manual) sectors for this paper . The second section dis-cusses Indiana manufacturing employment shares, and the paper concludes with a description of location quotients and what they mean in the context of the Indiana manufacturing economy.
U.S. and Indiana
Total employment in the U.S. was 149,445,500 in 1995, of which 19,218,600 workers were in the manufacturing sector. Employment in the manufacturing sector increased by 2% from 1983 to 1995, while total U.S. employment increased by 29%. The U.S. manufacturing sector employed about 13% of the national workforce, down from 16% in 1983. In 1995, the largest manufacturing sectors in terms of national employment were industrial machinery and equipment, food and kindred products, printing and publishing, and electrical and electronic equipment. Continued restructuring of the manufacturing sector since 1983 resulted in an increase in employment levels in 11 of the 20 manufacturing sectors (Figure 1). A manufacturing sector is defined by its SIC code. Firms producing simi-lar products are assigned the same SIC code. The SIC system enables economic data to be compared at the county, state, and national level.
Manufacturing employment in the transportation equipment and rubber/rubber products sectors increased by 37% and 29%, to 980,100 and 969,800 jobs, respectively, an addition of 484,000 jobs. Printing and publishing materials manufacturing added 308,300 jobs to the national economy over the same period. Other sectors with positive changes in employment levels added 819,800 jobs to the U.S. economy over the 1983 through 1995 period.
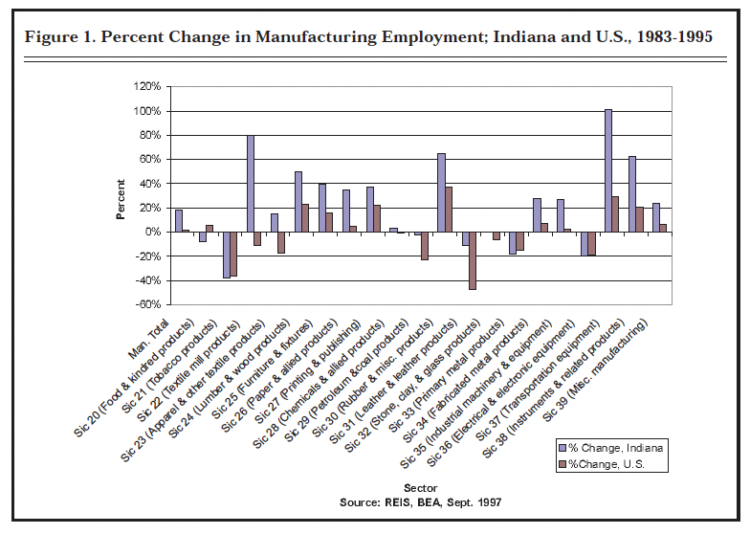
Figure 1. Percent Change in Manufacturing Employment; Indiana and U.S., 1983-1995
Over the same period employment in the leather and leather goods sector declined by 47% to 114,000 jobs in 1995. Employment in tobacco products and petroleum and coal products manufacturing decreased by 36% and 23%, respectively, a loss of 65,700 jobs. Other sectors with losses in employment had 815,600 fewer jobs.
The manufacturing industry in Indiana has experienced sustained economic growth since the manufacturing downturn in the early 1980s. Employment in the manufacturing sector increased by 18% between 1983 and 1995, from 590,569 to 696,239 jobs (Figure 1), in contrast to the 2% growth rate at the national level. Changes in the structure of the Indiana manufacturing sector mirrored national trends. Employment change rates in Indiana are larger than national rates in all but two manufacturing sectors, petroleum and leather products. Indiana trends differed from the nation’s in the food and kindred products, and apparel and other textile products sectors.
Indiana manufacturing employment in 1995 accounted for 696,239 of 2,549,312 jobs, representing 27%of Indiana employment, up from 23%in 1983. Manufacturing of transportation equipment, textile mill products, rubber and miscellaneous products, and instruments and related products exhibited the largest percentage change in employment.
The transportation equipment sector was the largest manufacturing employer in 1995, with 91,480 jobs, a 102% increase from 45,578 jobs in 1983. The second largest sector in terms of manufacturing employment was the industrial machinery and equipment sector, with 75,919 employees in 1995, a 23% increase from 59,969 in 1983. Employment in the electrical and electronic equipment manufacturing sector, the third largest manufacturing employment sector, was 68,642 in 1995, 19% less than in 1983. The primary metal products manufacturing sector lost 18% of its jobs as the number of employees went from 82,569 to 67,627. In 1995, the rubber sector employed 56,535 people, an increase of 65% over 1983 employment. Employment in the stone, clay, and glass products manufacturing sector was the only category to remain constant throughout the 13-year, period with 19,326 jobs.
Indiana Manufacturing Shares
Indiana firms in the manufacturing of transportation equipment employed 91,480 people in 1995, a 14% share of manufacturing employment in Indiana and a 3% share of total Indiana employment in 1995 (Figure 2). Industrial machinery, electrical and electronic products, and primary metal products manufacturing each accounted for more than 10% of the manufacturing employment, and together they employed 229,438 workers, more than 9% of all those employed in the state. The manufacturing of tobacco, textile, and leather products sectors accounted for 3,558 jobs, less than 1% of manufacturing employment in 1995.
Indiana Location Quotients: A Measure of Concentration
The location quotient (LQ) is a measure of the degree of an industry’s concentration in a state or region in comparison to the general economy. LQ values below compare manufacturing shares in the Indiana economy to national shares. The LQ is defined as:
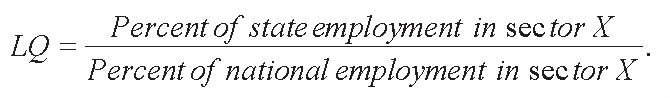
The LQ indicates whether a particular industry is more or less concentrated in the local economy than in the national economy. When an LQ has a value of one or more, the specified local sector has the same or a larger employment share as the same sector in the national economy. When an LQ is less than one, the sector’s employment share is smaller locally than in the national economy.
Manufacturing is concentrated in the state’s economy, as LQs for Indi-ana manufacturing sectors (Table 1) suggest. LQ values between .8 and 1.2 are interpreted as the manufacturing sector having the same concentration as the national economy.
LQs greater than 1.2 suggest the state has a greater concentration of the industry, while LQs below .8 suggest a lower concentration than in the national economy.
LQs for 10 of the 20 manufacturing sectors are greater than 1.2 . LQ values of 4.18 and 4.16 in SIC 33
(Primary Metal Products) and SIC 37 (Transportation Equipment), respectively, indicate strong concentrations in the Indiana economy. SIC 25 (Furniture and Fixtures) and SIC 30 (Rubber and Misc. Products) have LQs of 2.18 and 2.53, respectively, suggesting concentration in these sectors.
SIC 21 (Tobacco Products), SIC 22 (Textile Mill Products) and SIC 23 (Apparel and Other Textile Products) have LQs of .06, .08 and .46, respectively. These industries have little presence in the Indiana economy as compared to the national economy. LQs for the other 13 manufacturing sectors indicate the sectors have similar or slightly larger concentrations in the Indiana economy than in the national economy.
Location quotients also were calculated with the number of establishments (Table 1). The LQ gives an idea of the relative size of Indiana establishments in that sector com-pared to the size in the national economy. LQ values for the primary metal products sector are 4.18
(employment) and 2.19 (establishment). This suggests that Indiana establishments are larger by employees per plant in this sector than establishments in the national economy.
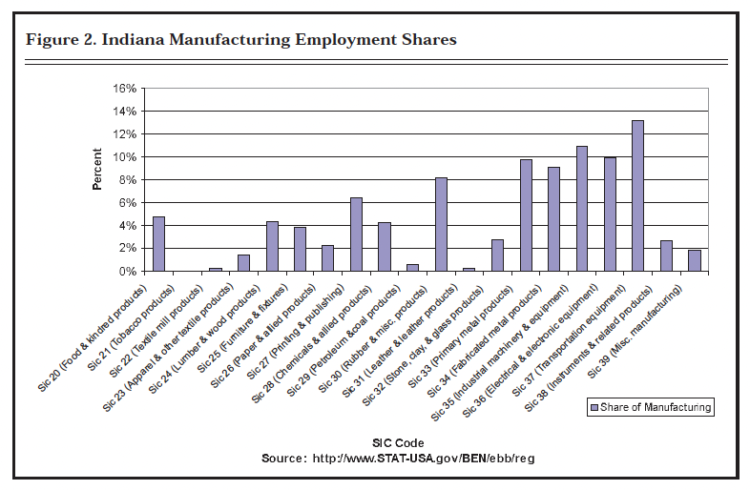
Figure 2. Indiana Manufacturing Employment Shares
Summary
Indiana has a strong manufacturing economy, employing 27% of the state’s workforce in 1995. Manufacturing employment increased by 18%from 1983 to1995, to 696,239 jobs. Fifty-three percent of employment in Indiana manufacturing occurs in five sectors; transportation equipment; industrial machinery and equipment; primary metal products; electrical and electronic equipment; and fabricated metal product products. In general, the Indiana manufacturing economy has mirrored national trends. Of the 20 manufacturing sec-tors in Indiana, 13 had positive growth rates, while 6 had negative growth rates. Location quotient values suggest that out of the 20 manufacturing sectors in Indiana, 10 had larger shares in the Indiana economy than in the national economy, 7 had shares similar to the national economy, and 3 had smaller shares.
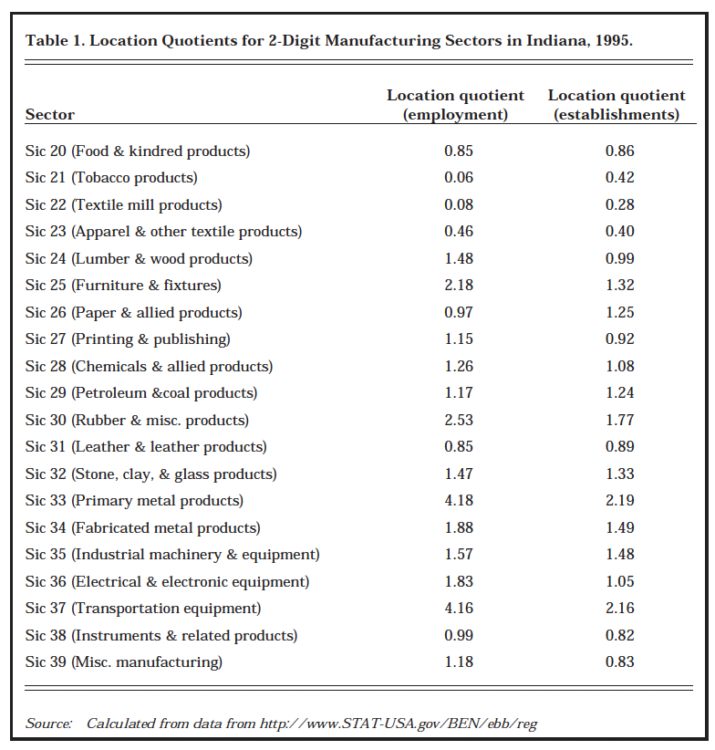
Table 1. Location Quotients for 2-Digit Manufacturing Sectors in Indiana, 1995.
![]()
![]()
![]()
![]()
![]()
