Producersʼ Adjustments to “Freedom to Farm”
September 13, 2000
PAER-2000-19
George F. Patrick, Professor and Kurt Collins, Graduate Research Assistant*
![]()
![]()
![]()
![]()
![]()
The 1996 Farm Bill, some-times referred to as the “Freedom to Farm Act,” substantially modified the economic environment for many producers. The standing disaster assistance pro-gram was eliminated, and major changes were introduced in crop insurance. Fixed production flexibility payments, that decline over time, were used in place of deficiency payments. Initially, commodity prices were well above levels that would have resulted in deficiency payments under the prior law. However, prices for 1998 crops declined sharply, and corn and soybean prices have continued at historically low levels. Loan deficiency payments (LDPs) were common in both 1998 and 1999, and the government has also responded with additional payments to increase farm income. Patrick and Musser found that participants in the 1997 Top Farmer Crop Workshop (TFCW) did give greater importance to price variability than producers in the 1991 or 1993 workshops. However, the average rating of 15 sources of risk was no higher in 1997 than in previous years. Similar results were obtained with respect to the importance ratings of responses to risk. Although the importance to producers of some marketing responses increased, the increase had occurred before the change in farm policy.
This article extends the analysis of producers™ responses to participants in the 1999 TFCW. Analysis is limited to those producers with $100,000 or more gross income from farming. Workshop participants are not a representative sample of all farmers, but their views and opinions are considered typical of large-scale commercial farmers. The average producer responding operated nearly 2,000 acres of crops, primarily corn and soybeans, was about 40 years of age, and had completed about three years of schooling beyond high school. Participants were asked to rate, on a scale of one (low) to five (high), their willingness to accept risk, views of changes in risk faced as a result of “Freedom to Farm,” and the importance of a number of sources of risk in their decision making. They were also asked to use a similar scale to rate the importance of a number of responses to risk and to indicate whether they were used in their farm operation.
Results indicate no change in TFCW participants’ willingness to accept risk between 1993, 1997, and 1999. How-ever, producers do view farming as more risky, especially with respect to price, after the 1996 policy changes. Crop price variability and the government commodity program have increased in importance as sources of risk. Producers give greater emphasis to being a low-cost producer and to participating in the government pro-gram as risk management responses. There is some increase in the rating of importance and use of some marketing and insurance-related responses to risk, but this is quite limited. Producers also indicate some decline in their debt-leverage management and use of financial/credit reserves, reflecting the current financial stress in agriculture.
Willingness to Take Risk and Perceptions of Riskiness
Participants in each of the Workshops were asked to self-assess their willingness to accept risks relative to other farmers on a scale of one (much less willing) to five (much more willing). The average values for participants were 3.66, 3.59, and 3.79 for the 1993, 1997, and 1999 TFCWs, respectively. The differences in the averages for the three Workshops are not statistically significant, indicating no change in farmers’ willingness to accept risk over the period. However, the 1999 TFCW participants are more willing to accept risk than farmers in general. The average value of 3.29 for willingness to accept risk for a stratified random sample of 342 Indiana crop producers with gross incomes of$100,000 or more is significantly lower than that of the TFCW participants.
Participants in both the 1997 and 1999 Workshops were asked to characterize the effect of the change in government farm policy with ‘Freedom to Farm’ on the price and income risk faced by their farm businesses as compared with five years earlier. Again, a five-point scale, with one indicating ‘much less risky’ and five indicating ‘much more risky,’ was used. In 1997, both price and income risk received identical average values of 3.83. In 1999, the average value for price risk was 4.19, significantly higher than in 1997. The average value for income risk was also higher in 1999, 3.96, but the difference is not statistically significant. These results suggest that producers have not changed in their willingness to accept risk as a result of ‘Freedom to Farm,’ but producers do view farming as involving more risk, especially with respect to price, after the changes in government farm policy.
Sources of Risk
Table 1 summarizes the averages and standard deviations (a measure of the dispersion of responses) of the nine most highly rated sources of variability from the 1993, 1997, and 1999 TFCW surveys. Crop price and crop yield variability have been the most highly rated sources of risk in both 1997 and 1999, and price was significantly higher than in 1993. Injury, illness, or death of the operator and environmental regulations were the most highly rated sources of risk in 1993. Although the importance rating of injury, illness, or death of the operator declined sharply, the decline was not statistically significant. In part, this is due to the large standard deviations (indicating wide differences among respondents) of the ratings. For environmental regulations, the high importance rating in 1993 appears to reflect the concern about conservation tillage practices and compliance. Although the decline in importance given to environmental regulations from 1993 to 1997 was statistically significant, the importance in 1999 was not significantly different from the value in 1993. However, it should be noted that most of the TFCW participants did not produce livestock and would not be affected by recent developments in livestock environmental regulations.
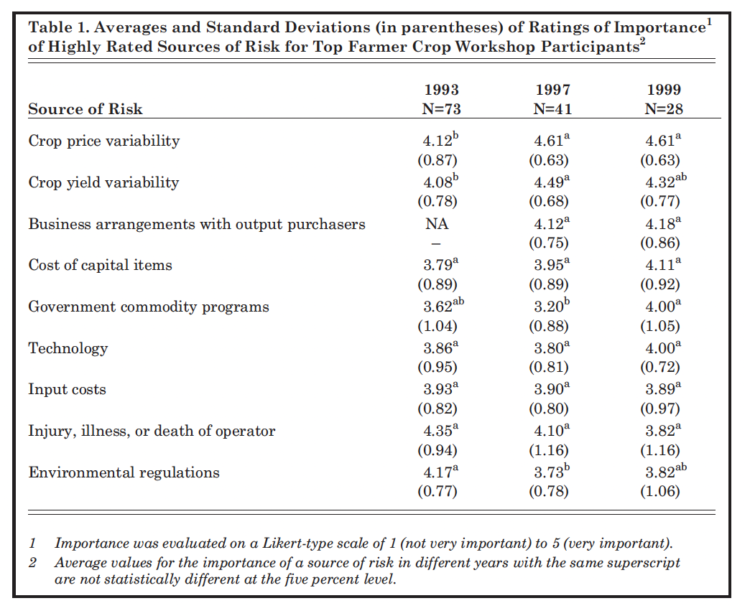
Table 1. Averages and Standard Deviations (in parentheses) of Ratings of Importance of Highly Rates Sources of Risk for Top Farmer Crop Workshop Participants
The possibility of changes in business arrangements with output purchasers, a source of risk not considered in the 1993 survey, was rated third in importance in 1999. The importance given to government commodity programs declined from 1993 to 1997, reflecting the change in government farm policy. However, the importance of government commodity programs was at its highest level in the 1999 survey. This is not surprising given the importance of governmental payments as a part of 1998 and 1999 farm income. The importance ratings given to technology and input costs as a source of risk in decision making were not significantly different over the three surveys.
It is common to classify risks faced by producers into the categories of production, market or price, financial, legal, and human risks. All five areas are represented in the nine most highly rated sources of risk. Crop yields and technology are directly related to production, while commodity prices reflect the market risk. Input costs and costs of capital items have a financial risk component. The legal area of risk is represented by changes in government commodity programs and environ-mental regulations. One aspect of human risk is represented by the possible injury, illness, or death of the operator.
The five sources of risk that were rated as the least important by producers are indicated in Table 2. For both 1997 and 1999, land rents received the lowest average score of any of the sources of risk considered, significantly below the value for 1993. Changes in the family labor force and family relations were also rated as relatively unimportant sources of risk, with no significant changes over time. The rating given to credit availability increased from 1993 to 1999, but the change was not statistically significant. Changes in business arrangements with input suppliers was added in the 1997 sur-vey, but the increase to 1999 was not significant. This suggests that mergers and changes in the supply industry apparently do not cause concern that changes in output purchasers do among farmers. Overall, the rating of 16 sources of risk considered in all three surveys did not differ significantly is spite of the different economic environment.
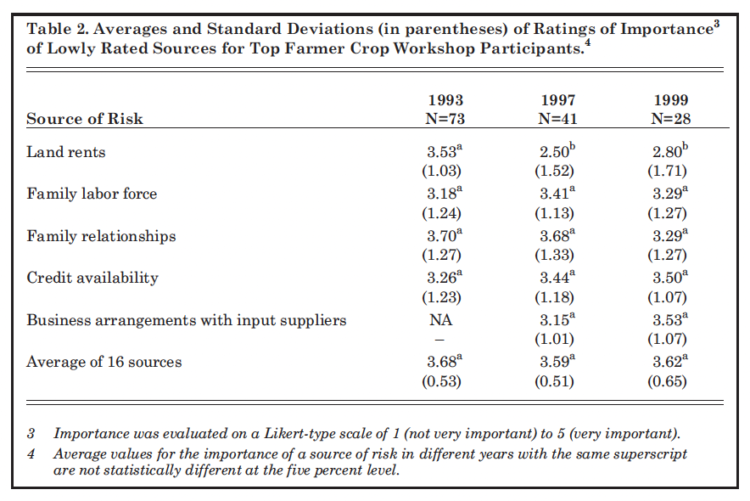
Table 2. Average and Standard Deviations (in parentheses) of Ratings of Importance of Lowly Rated Sources for Top Farmer Crop Workshop Participants
Responses to Risk
Producers may make a variety of responses to manage risk. The 1993 survey included 21 responses in the production, marketing, and financial areas. Both the 1997 and 1999 surveys considered 25 responses, with the additional responses in the marketing area. Table 3 summarizes averages and standard deviations for the seven responses rated at 3.85 or higher in 1999. Producers also indicated whether they used the response in their farm operation.
Being a low-cost producer was rated at 4.79 in 1999, significantly higher than in the earlier surveys. It is likely that this high rating reflects the economic stress felt by producers because of low crop prices. Nearly 77 percent of respondents indicated they used the response, up slightly from 71 percent and 67 percent in 1993 and 1997, respectively. Liability insurance, used by over 95 per-cent of producers, was the highest rated response in 1993 and 1997, and there was no significant difference among years. The largest absolute change, more than 0.8, was in the importance given to participation in the government commodity pro-gram. About 85 percent of producers used this response in all three years. The rating of using production techniques that work under a variety of conditions was significantly lower in 1999 than in 1997 or 1993. The per-centage of producers using this response slipped from 87 percent in 1993 to 77 percent in 1999.
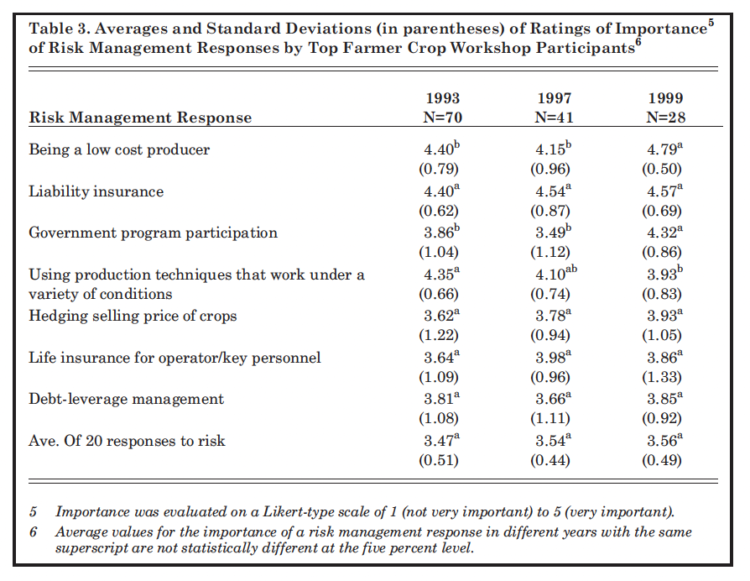
Table 3. Averages and Standard Deviations (in parentheses) of Ratings of Importance of Risk Management Responses by Top Farmer Crop Workshop Participants
There are no statistically significant changes in the ratings of the other three responses to risk in Table 3. More than 60 percent of producers are hedging the selling price of at least some of their production, while about 85 percent have life insurance for the operator and/or key personnel. Although importance given to debt-leverage management was unchanged, the percentage of producers indicating use of the response declined from about 64 per-cent in 1993 to 42 percent in 1999. Apparently, the tough economic times have resulted in a number of producers not being able to practice what they consider important. The percentage of producers indicating they maintained credit/financial reserves also declined from 70 per-cent in both 1993 and 1997 to 50 percent in 1999.
There were a number of responses to risk that were rated under 3.0 on the five-point scale of importance. Off-farm employment rated only 2.0, while hail and fire insurance for crops was 2.68. Minimum price contracts for the selling price of commodities and disability insurance were also rated less than 3.0.
Table 4 presents the average importance ratings and the percentage of producers using selected marketing and crop insurance responses to risk. Only those producers indicating use of at least one risk management response are included. There are no statistically significant changes in the rating of importance for any of the responses over the period. There was some decline in the use of forward contracting, probably reflecting the unfavorable prices in 1999. Written marketing plans and crop insurance showed some increase in use over the 1993 to 1999-period. However, there has been generally quite limited change in producers™ risk management responses as a result of Freedom to Farm.”
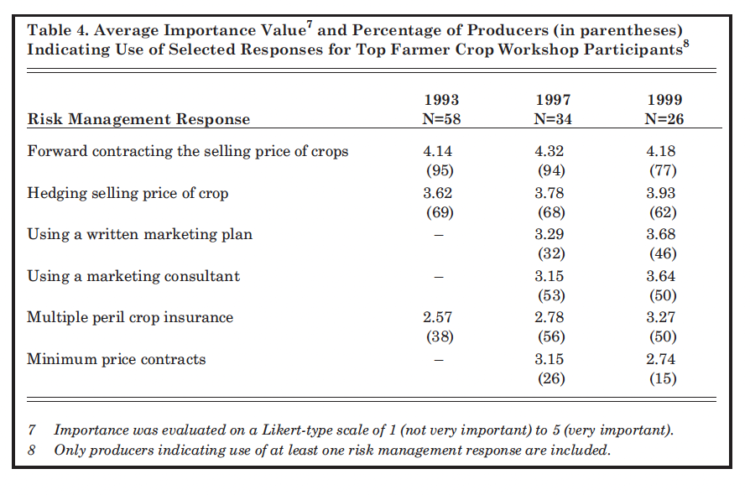
Table 4. Average Importance Value and Percentage of Producers (in parentheses) Indicating Use of Selected Responses for Top Farmer Crop Workshop Participants
Implications
There are no “right” or “wrong” answers with respect to the ratings of the importance of various sources of and responses to risk. Producers attending the TFCWs do tend to be more willing to accept risk than farmers in general. They also perceive that farming is riskier, especially with respect to price, than it was before passage of the “Freedom to Farm” legislation. Crop price variability and the government commodity program have increased in importance as a source of risk. Producers give greater emphasis to being a low-cost producer and to participating in government program as risk management responses. There is some increase in the rating of importance and use of some marketing and insurance related responses to risk, but this is quite limited. Producers also indicate some decline in their debt-leverage management and use of financial/credit reserves, that reflects the current financial stress in agriculture.
Although producers recognize that change has occurred and the economic environment is different, only limited adjustments appear to have been made. In some cases, such as disaster assistance and crop insurance, this may be due to inconsistent actions by the government. In other cases, such as revenue insurance, producers are gradually learning about the possibilities associated with the new risk management responses. There are a number of responses that farmers can make to manage risk. As the risk environment changes and new risk management tools are developed, a producer’s risk management strategy needs to be dynamic, adapting to the changes occurring. Both producers and those serving producers need to be aware of the changes that are occurring. These changes will impact producers as well as those servicing producers’ needs.
References
Patrick, G.F. and W.N. Musser, “Large-Scale Farmers’ Views of Sources and Responses to Risk,” Purdue Agricultural Economics Report, September 1999, pages 8-11. Available at <www.agecon.purdue.edu/ext ensio/Paer/paer0999.pdf>
![]()
![]()
![]()
![]()
![]()
