Results of the Indiana Farm Finance Survey for 1991
November 16, 1991
PAER-1991-13
Authors: Freddie L. Barnard, Associate Professor; Kevin T. McNamara, Assistant Professor; and Jeurene Falck, Computer Programmer
![]()
![]()
![]()
![]()
![]()
Financing for this study was provided by a Crossroads Research Project of the Purdue Agricultural Experiment Station. Thanks are extended to the farmers who completed the questionnaires and to, Ralph W. Gann, head of the Department of Agricultural Statistics at Purdue University, for helpful suggestions regarding design of the questionnaire and for supervising the collection of the survey information in March-April 1991. Helpful comments on the manuscript by Professors John E. Kadlec, David C. Petritz, and Lee F. Schrader are acknowledged.
The 1991 Indiana Farm Finance Survey suggests most Hoosier farmers were in good financial condition going into the 1991 planting season. The deterioration in growing conditions throughout Indiana, however, has increased the probability that Hoosier farmers will experience financial stress in 1991 and 1992. The financial impact of the 1991 drought will not be reflected in the survey results, since the 1991 Indiana Farm Finance Survey was conducted March-April 1991. The current financial condition of many Indiana farmers could be worse than the spring survey indicates.
Key indicators from the Indiana Farm Finance Survey for 1991 suggest financial conditions for many Hoosier farmers improved from 1990 to 1991. In particular, the delinquency rate for real estate loans, debt-asset ratios, percentages of respondents with debt-asset ratios exceeding 40 and 70%, percentage of respondents turned down when applying for a loan, and the percentage of debt held by respondents who were technically insolvent all fell to levels lower than those recorded for 1990. The delinquency rate for nonreal estate loans was higher in 1991 than in 1990, but. the rate was still much lower than in 1986. Farmers continued to adopt management practices that increase their efficiency, and purchased new/additional machinery in 1990 and early 1991. Respondents indicated they plan to continue this practice during the next 12 months. These intentions, however, may have changed in several areas of Indiana as a result of a poor 1991 harvest.
Indiana Farm Finance Surveys were conducted in March-May 1985, March-June 1986, March-June 1988, April-June 1990, and March-April 1991, by the Departments of Agricultural Economics and Agricultural Statistics at Purdue University. An abbreviated survey of a smaller sample was conducted in February-March 1989. This article reports on the 1991 survey, compares the 1991 results to the findings for 1990 and to selected findings for 1986, 1988, and 1989, and describes the financial condition of Indiana farmers.
Procedure
In March 1991, a farm finance questionnaire was sent to about 5,000 Indiana farmers by the Department of Agricultural Statistics at Purdue University. Approximately 1,000 farmers who had responded to the 1990 farm finance questionnaire were included in the sample, together with a random sample of an additional 4,000 farmers. Approximately three weeks after the initial mailing, a reminder questionnaire was mailed to farmers who had not yet responded to the mail questionnaire. In April 1991, a telephone survey of about 400 nonrespondents was conducted mainly to determine if the characteristics of the farmers who did not respond to the mail questionnaire differed from those who responded. Such an investigation helped to determine if the mail questionnaires produced a representative sample, particularly whether nonrespondents were in worse financial condition than respondents.
The respondents to the telephone survey farmed a slightly greater number of acres (402) than respondents to the mail survey (381). The financial measures were, for the most part, better for telephone respondents than for mail respondents; the delinquency rate for nonreal estate loans, debt-asset ratio and percentages with debt-asset ratios exceeding 40 and 70% were lower. The percentage turned down when applying for a loan was higher for telephone respondents (12.8%, 5 of 39 respondents) than for mail respondents (6.4%, 20 of 311 respondents), as was the delinquency rate for real estate loans (3.2% for mail and 4.6% for telephone). No other differences in characteristics could be detected in the responses obtained by telephone. Hence, the results obtained by telephone were included with those obtained by mail questionnaires to produce the summaries appearing in this article. The number of questionnaires containing completely usable or partially usable responses was 1,541 for a response rate of 31 %. However, as noted in the summary tables, the number of usable responses varied substantially from question to question.
Many results are reported below as averages for Indiana and for the northern, central, and southern regions of the state. As noted on the map (Figure 1):
- The northern region consists of the counties in the northwestern, north central, and northeastern agricultural statistics districts.
- The central region consists of the counties in the west central, central, and east central agricultural statistics districts.
- The southern region consists of the counties in the southwestern, south central, and southeastern agricultural statistics districts.
The state averages are weighted averages determined by weighting the responses for each region by the percentage of responses for each region.
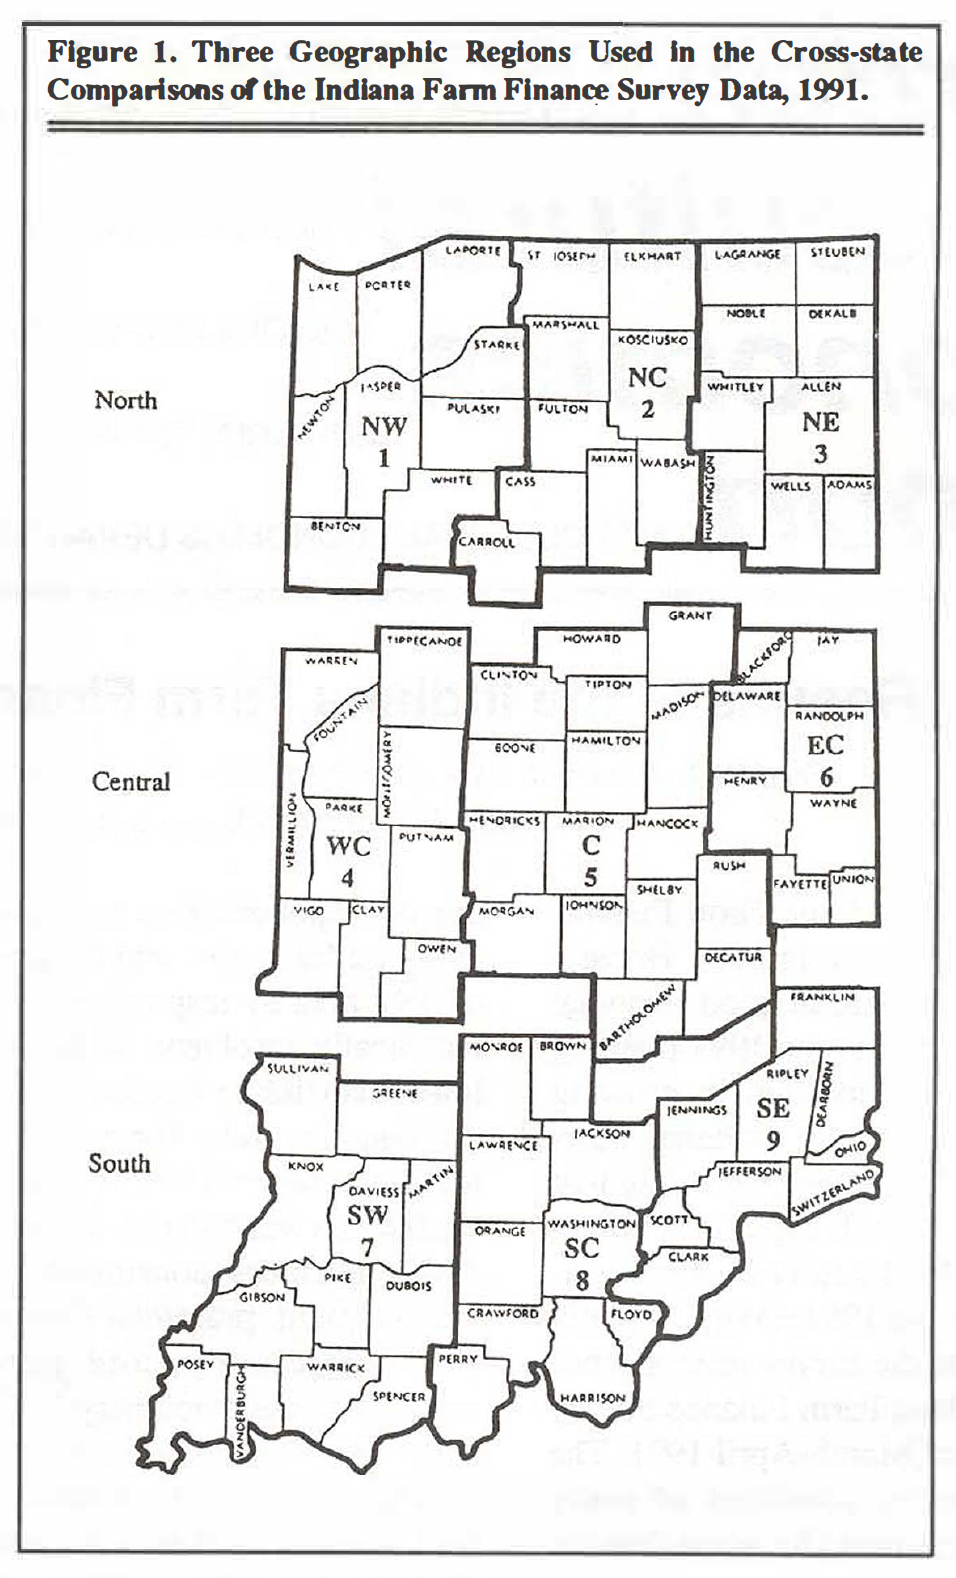
Figure 1. Three Geographic Regions Used In the Cross-state Comparisons or the Indiana Farm Finance Survey Data, 1991.
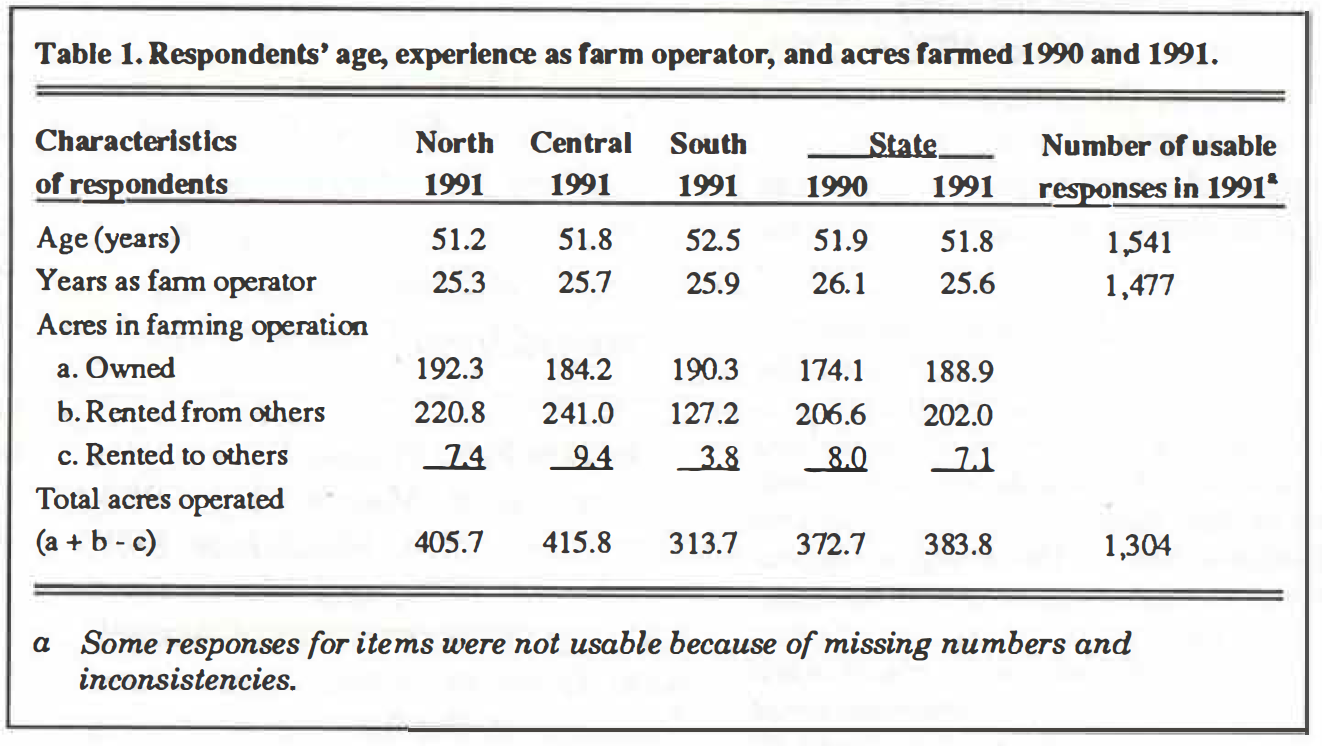
Table 1. Respondents’ age, experience as farm operator, and acres farmed 1990 and 1991.
Background Statistics on Characteristics of Respondents
The background statistics appearing in Table 1 were used for assessing the representativeness of the sample and for making certain cross-tabulations reported later.
The average age and average number of years of experience as a farm operator of respondents were 52 and 26 years, respectively, and did not vary substantially either across the three regions of the state or from the results of the 1990 survey (Table 1). The 415.8 average acres operated by respondents in the central region was about 2% greater than the 405.7 average acres operated in the north and about 33 % greater than the 313.7 average acres in the south.
Measures Describing the Financial Condition of Indiana Farmers
Several statistics from the Farm Finance Survey are used to draw inferences about the financial condition of Indiana farmers. Gross and net farm income, debt-asset ratios, nonfarm income, delinquency rates for loans, loan rejection rates, and principal payments in addition to scheduled payments statistics are used in this section to examine the general financial condition of Indiana farms.
Gross and Net Farm Income.
Gross farm income is the income generated by a farm before any expenses are subtracted. A gross farm income value of $100,000 was selected to differentiate between part-time and fulltime farms. About 30% of the respondents had gross farm incomes over $100,000 and 70% had gross farm incomes under $100,000 in 1990 (Table 2). The comparable figures for 1989 regarding full-time and part-time farmers were28% and 72%, respectively. In southern Indiana, 21 % of the respondents had gross farm incomes in 1990 greater than $100,000, compared to 34% and 33% in central Indiana and in northern Indiana, respectively. This suggests that the central and northern regions of Indiana have a larger share of large-scale operations.
Operators of many small, part-time farms in Indiana obtain large percentages of their incomes from nonfarm sources. Of the respondents to this survey, 60% of the operators for farms with less than $100,000 of gross farm income work at off-farm employment. Only 24% of the operators of farms with gross farm incomes of $100,000 and over work at an off-farm job. Because the financial characteristics of part-time farms differ from those of full-time farms, certain statistics will be presented separately in the article for farmers with gross incomes of$100,000 and over per year.
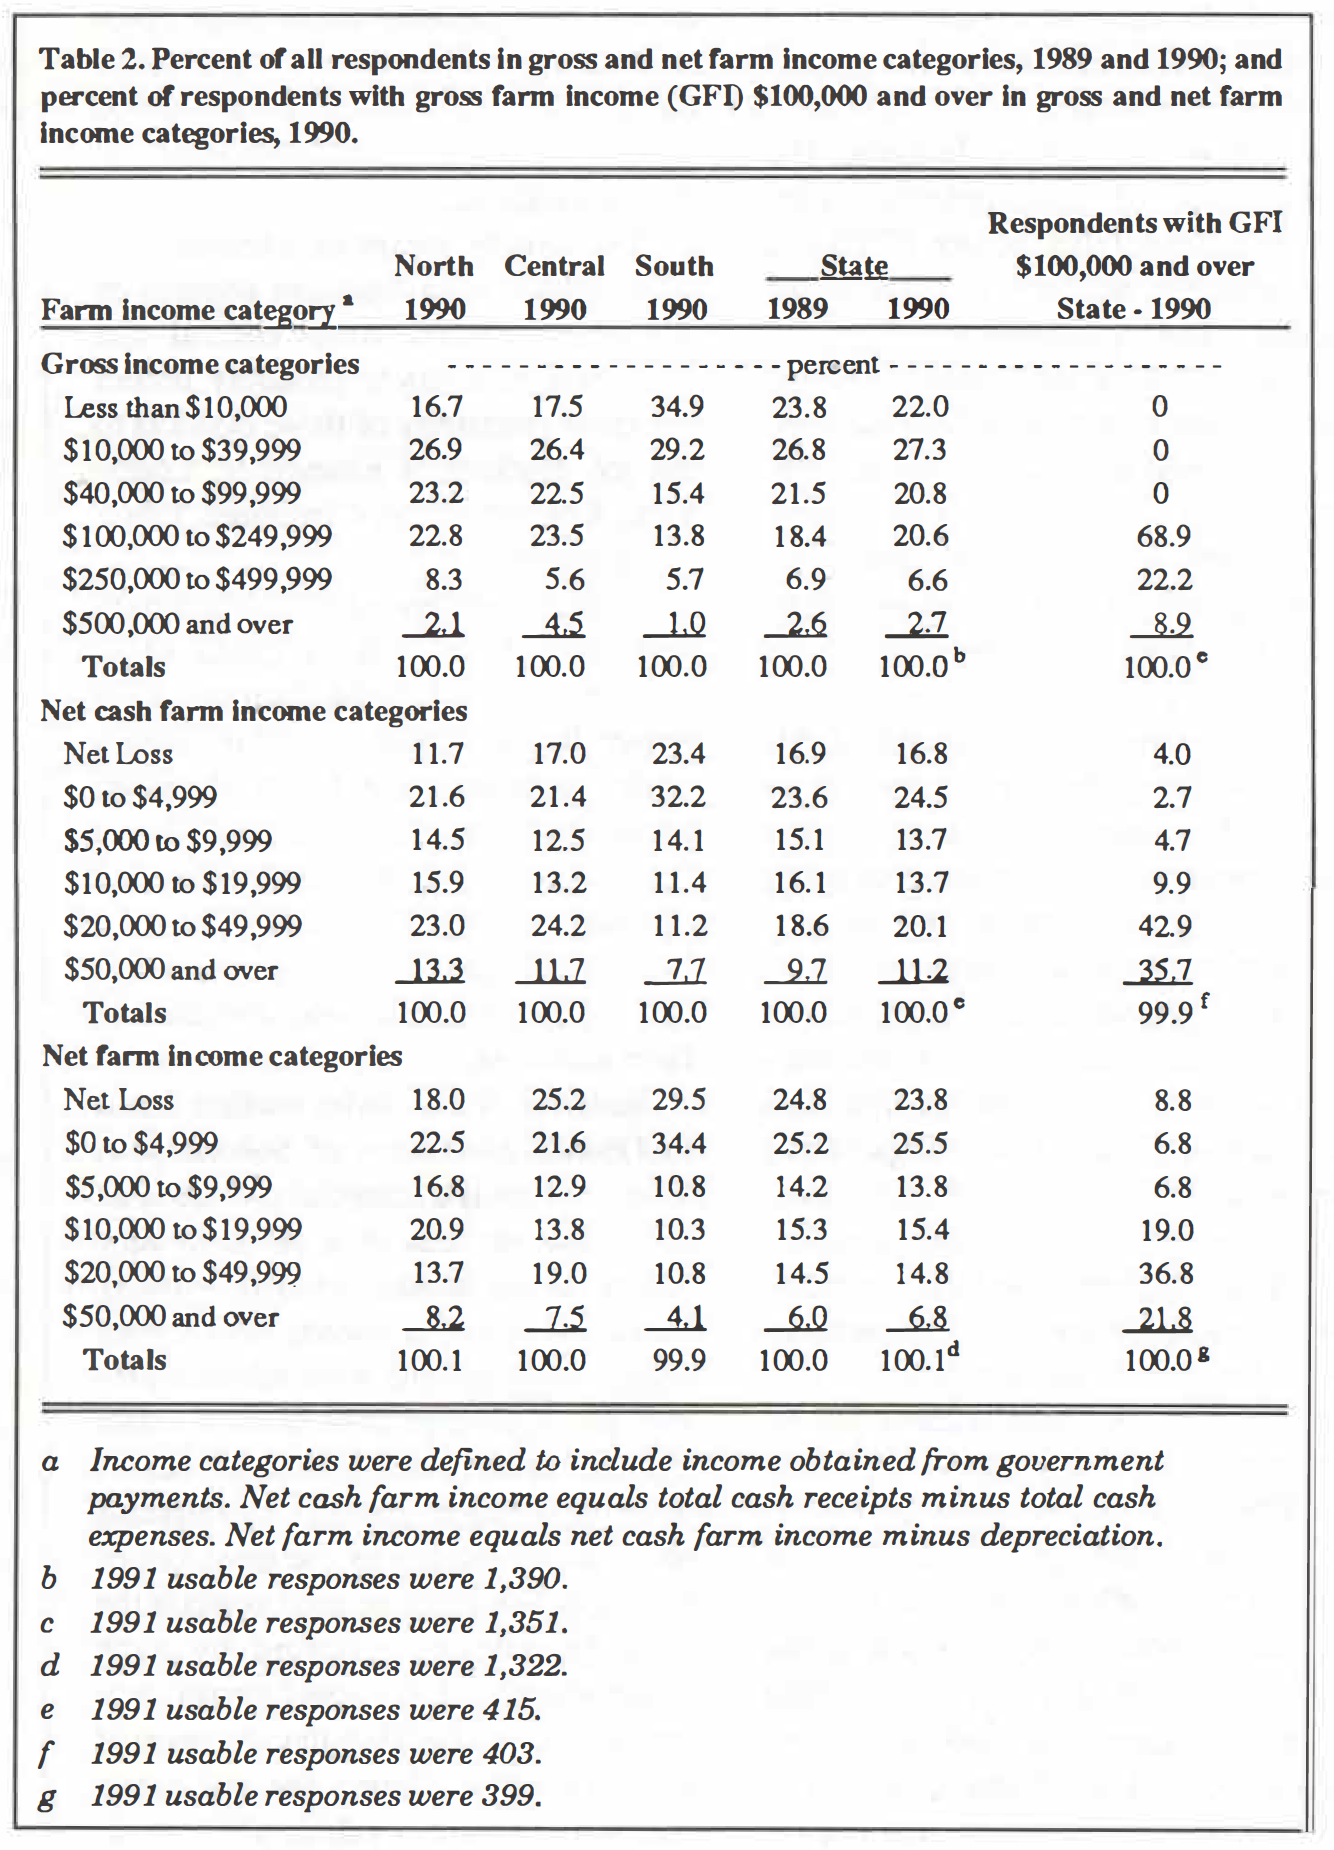
Table 2. Percent of all respondents In gross and net farm income categories, 1989 and 1990; and percent of respondents with gross farm income (GFI) $100,000 and over In gross and net farm Income categories, 1990.
Respondents reported net cash farm income and net farm income figures for 1990. For purposes of the survey, net cash farm income was defined as total cash receipts minus total cash operating expenses. Net farm income was defined as net cash farm income minus depreciation.
Net farm income is commonly defined as the return to unpaid operator and family labor, management, and equity capital. Net cash farm income represents the amount of money available to farmers to repay the principal on intermediate and long-term debt, purchase capital assets, pay family living expenses, pay income taxes, and retain in the farming operation as a financial reserve.
About 17% of the respondents reported negative net cash farm incomes for 1990; and about 24% of the respondents reported negative net farm incomes {Table 2). The percentage of respondents reporting net losses in 1990 was largest in southern Indiana. The percentage of respondents with $100,000 gross farm income (GFI) and over reporting net farm incomes in the net loss category is 8.8%.
About 78% of the respondents had net farm incomes of less than $20,000 in 1990, equal to the comparable number for 1989. The percentage of respondents with $100,000 GFI and over reporting net farm incomes less than $20,000 is 41 %. Given current levels of family living expenses, many of these farmers probably would have had difficulty making debt payments from 1990 net farm incomes. Of course, some could have made debt payments using depreciation allowances and income obtained from nonfarm sources.
Many Indiana farmers supplement farm income with income from nonfarm sources. Nonfarm income was defined to include the earnings of the farmer and spouse from off-farm jobs, earnings from sales of goods and services ( e.g., seed com, welding services, baked goods, sewing, etc.) and earnings from nonfarm investments. The average gross nonfarm income for all respondents reporting nonfarm income was $29,287.
The lowest average nonfarm income figure ($24,568) among the Indiana statistical reporting districts was in the northwestern district {Table 3). This finding may appear unusual since Gary, Hammond, and Michigan City-cities with higher wage off-farm job opportunities are located in the northern part of this agricultural statistics district. However, the central and southern parts of this district consist of predominantly rural Benton, Jasper, Newton, Pulaski, Starke, and White counties. Moreover, operators tend not to commute long distances to off-farm work; respondents commuted an average of 17 miles (one-way) to offfarm jobs. Hence, the rural character of the southern two-thirds of the district and the commuting practice of farmers may explain part of the low average nonfarm income of farmers in the northwestern district. The northwestern district also includes many large commercial farms. Operators of these farms cannot allocate time to off-farm activities because of management responsibilities.
The larger incomes obtained by respondents from nonfarm sources in the southwestern, south central and southeastern districts probably reflect the close proximity of those districts to the job markets of Evansville; Louisville, Kentucky; and Cincinnati, Ohio, respectively.
Nonfarm income of the farmers with less than $100,000 of gross sales exceeded that for the farmers with larger farms {Table 3). This pattern probably reflects the heavy demands placed on the operators of larger farms for on-farm work, the smaller number of cases on larger farms where both the farmer and spouse work off the farm, and higher returns io time allocated to farm activities.
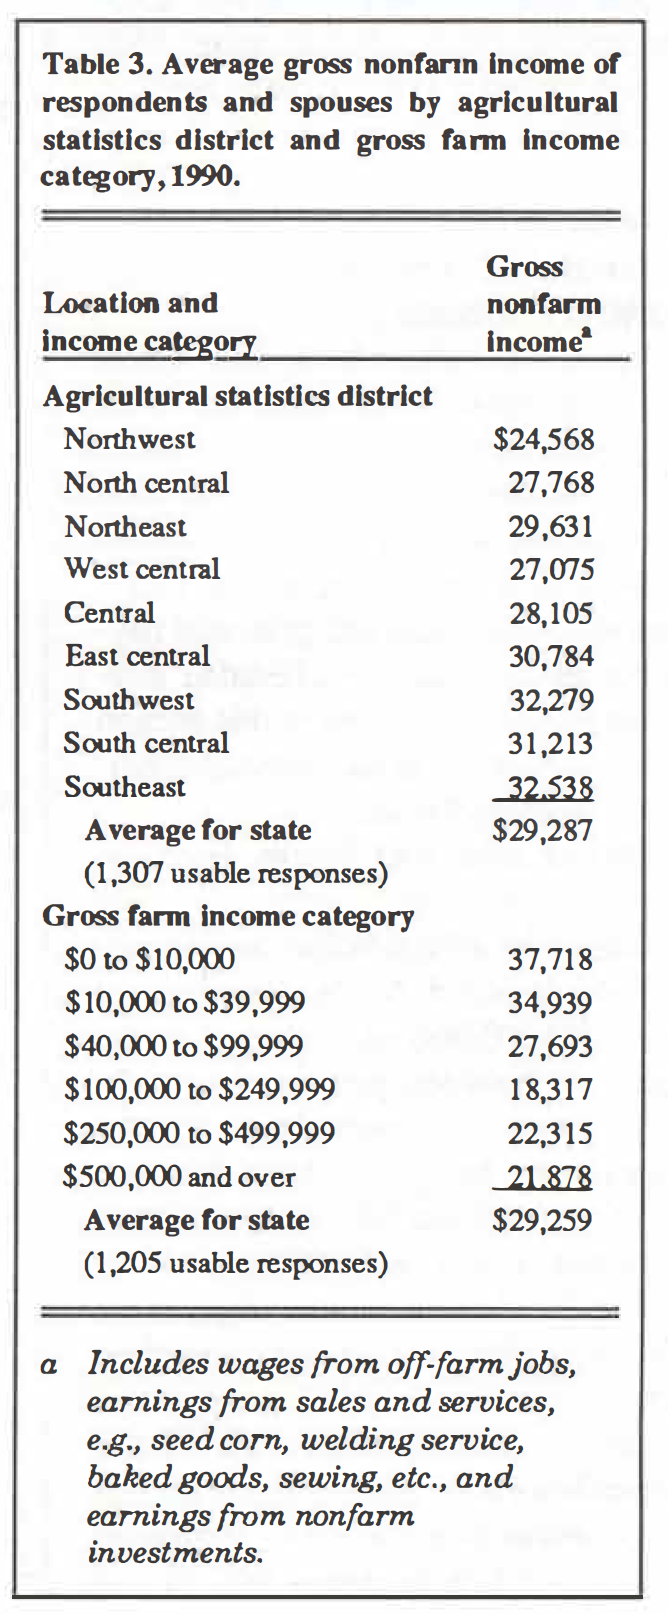
Table 3. Average gross nonfarm Income of respondents and spouses by agricultural statistics district and gross farm Income category, 1990.
Balance Sheet Information Used to Obtain Measures of Solvency. A balance sheet is a financial picture of an individual or firm at a point in time which shows assets (what is owned), liabilities (what is owed), and owner equity. Respondents were asked to provide an estimate of their nonreal estate and real estate assets and liabilities. A word of caution should be extended about the reliability of the asset values reported. The value of total assets is the average amount reported by each respondent and no mechanism was employed for checking the accuracy of these estimates. Hence, the real estate and farm machinery values which made up a large portion of each respondent’s balance sheet are subject to the possible biases of the individual respondents.
The average value of farm real estate assets reported by respondents as of January 1, 1991 was $303,187, ranging from $273,799 in southern Indiana to $334,916 in northern Indiana (Table 4). The average value of farm real estate assets reported by respondents with gross farm income (GFI) $100,000 and over was $605,506. Farm nonreal estate assets averaged $134,298 in value for the state, exhibiting their lowest value ($113,141) in southern Indiana and their highest value ($148,180) in northern Indiana Farm nonreal estate assets averaged $264,061 for farmers with GFI $100,000 and over.
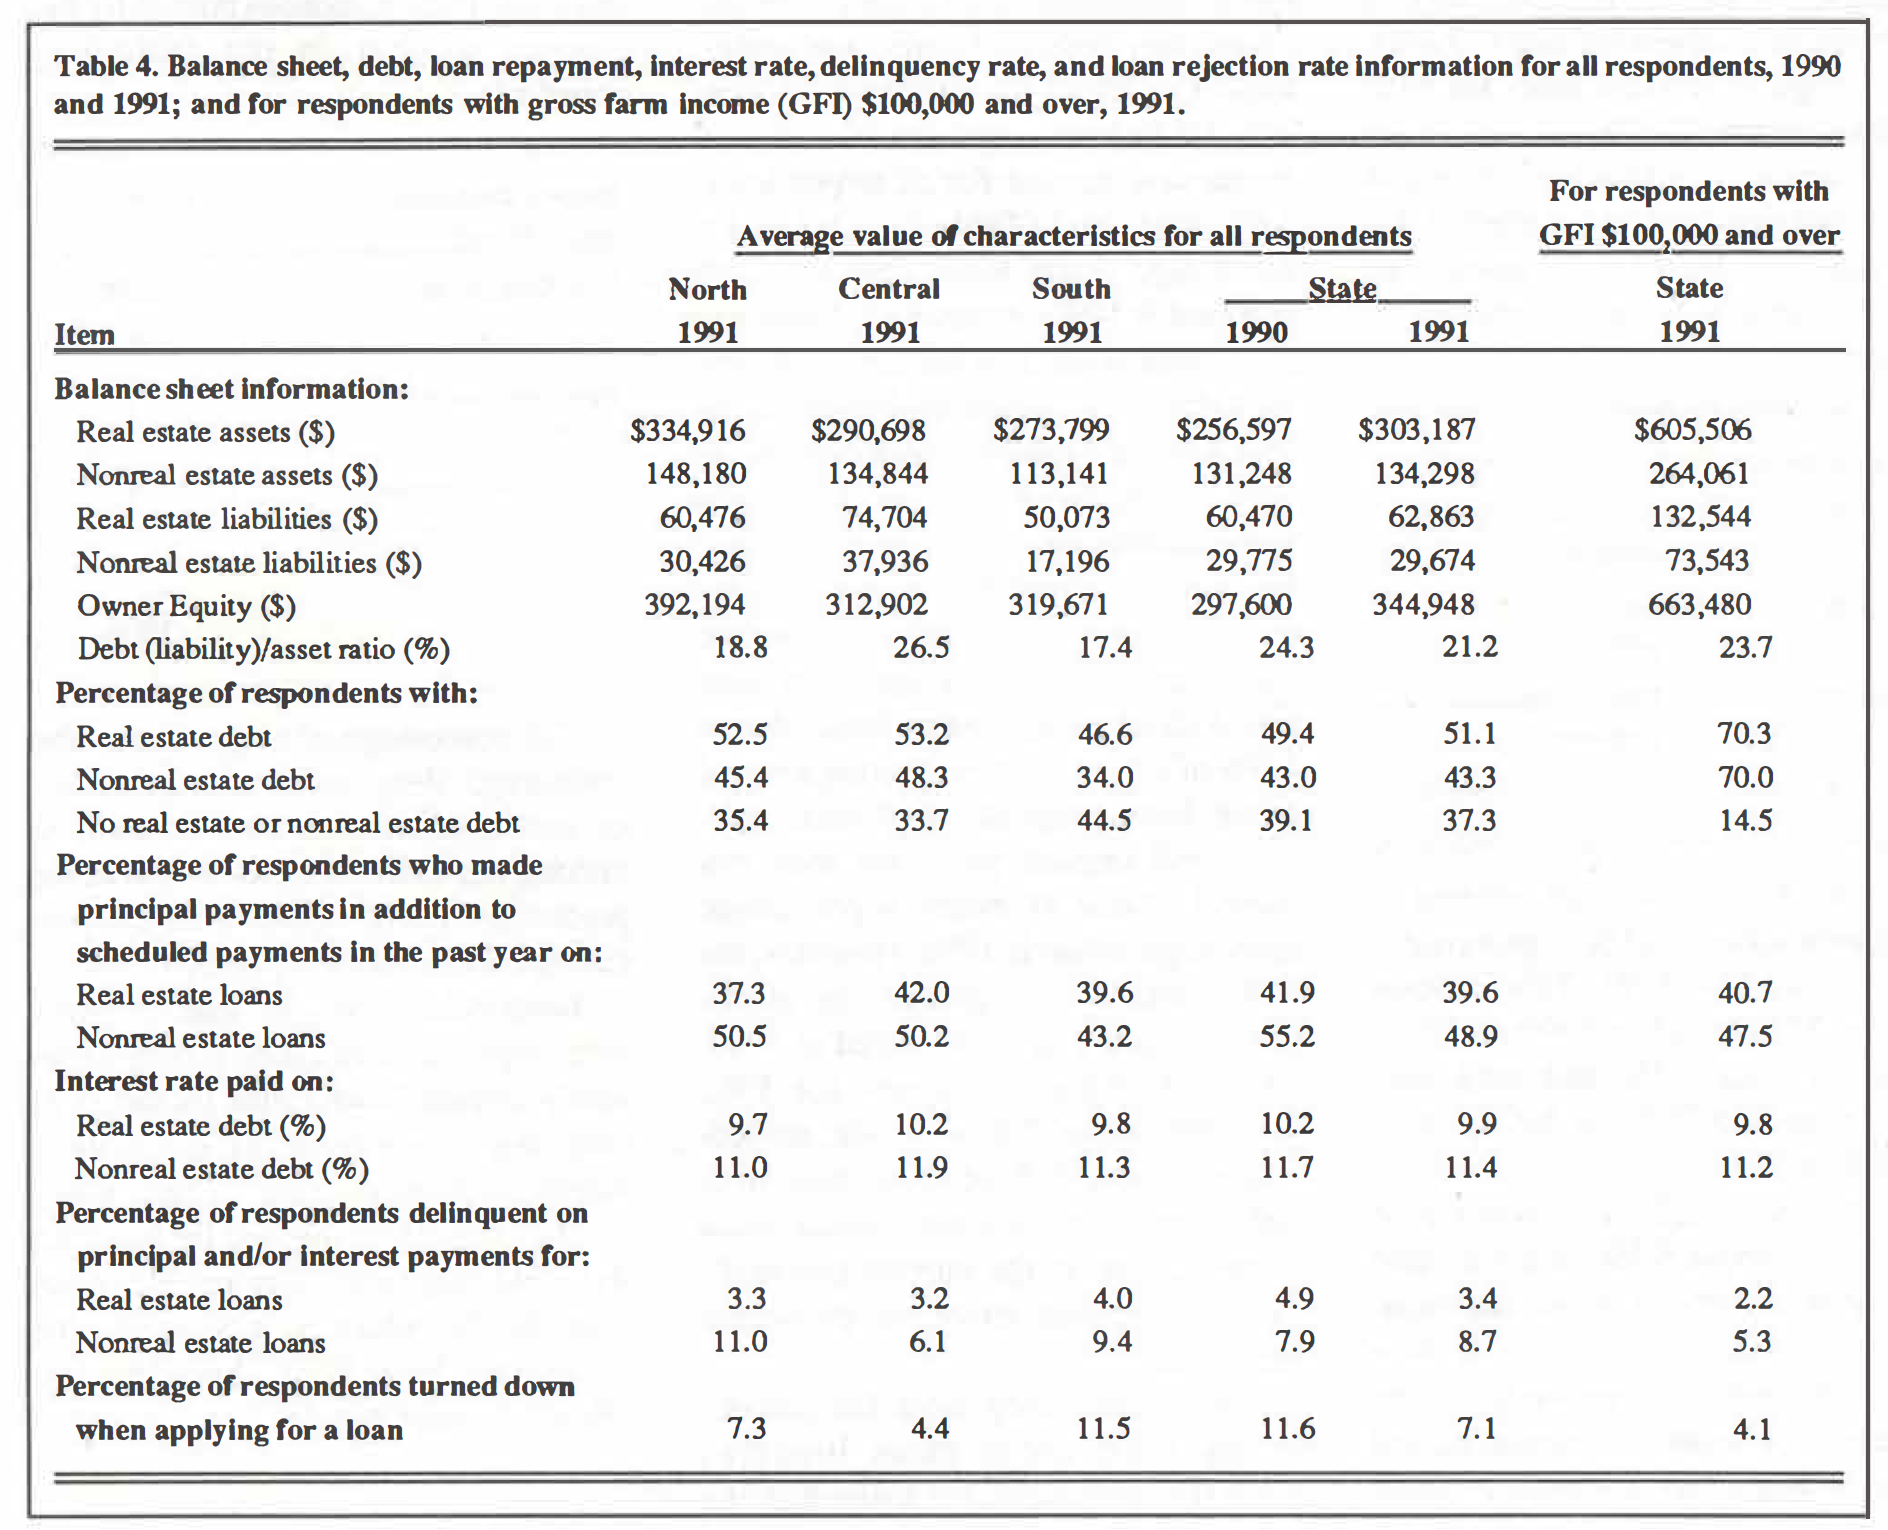
Table 4. Balance sheet, debt, loan repayment, Interest rate, delinquency rate, and loan rejection rate Information for all respondents, 1990 and 1991; and for respondents with gross farm Income (GFI) $100,000 and over, 1991.
For all respondents, the average amount of real estate debt was $62,863, ranging from $50,073 in southern Indiana to $74,704 in central Indiana. The average amount of real estate debt for farmers with GFI $100,000 and over was $132,544. The nonreal estate debt (state average) was $29,674, varying from $17,196 in southern Indiana to $37,936 in central Indiana. The average amount of nonreal estate debt for farmers with GFI $100,000 and over was $73,543.
The owner equity (total assets minus total liabilities) of respondents averaged $344,948 for the state. It was highest in northern Indiana ($392,194) and lowest in central Indiana ($312,902) (Table 4). The average owner equity of respondents with GFI $100,000 and over was $663,480.
The percentage of all respondents carrying real estate and nonreal estate debt in 1991 and the average interest rates paid by the respondents on the debt are listed in Table 4. Note that about 37% of all respondents reported zero debt in 1991. This zero debt figure is about two percentage points lower than the comparable number for 1990. About 45% of the respondents in southern Indiana reported they had no debt on January 1, 1991. About 15% of the respondents with $100,000 and over of gross farm income had zero debt in 1991, which is considerably lower than the percentage of all respondents.
Nearly 40% of the respondents made principal payments on real estate loans in addition to scheduled payments during the past year. The comparable figure was 49% for nonreal estate loans.
Respondents with GFI $100,000 and over also paid ahead; about 41 % and 48% made principal payments in addition to scheduled payments on real estate and nonreal estate loans, respectively.
For Indiana, respondents reported they paid interest rates on real estate and nonreal estate debt in 1991 which averaged 9.9% and 11.4%, respectively.
Solvency measures describe the amount of money a farmer would have remaining after all assets are converted to cash and debts retired. Solvency ratios measure the relationship between claims on the business (liabilities) and either total assets or owner equity. Interpretation of the debt-asset ratios obtained in this survey as an indicator of the financial condition of Indiana farmers requires caution. The total debt component of the ratio (liabilities) does not take into account how the debt is structured. Debt structure impacts farmers’ ability to service debt, and consequently, their financial condition.
Problems discussed earlier about the difficulty of establishing farm asset values also impact the reliability of the debt-asset ratio. Calculations of change in owner equity can be the result of a profit or loss in a previous year and/or the result of an increase or decrease in the asset values. Such a change also influences the ratio. Without an income statement and the knowledge of asset values on the previous balance sheet, it is difficult to identify the reasons for the change in owner equity for an individual operation.
The statewide average debt-asset ratio of 21.2% as of January 1, 1991 (Table 4) was more than three percentage points lower than in 1990. The ratio was highest in central Indiana (26.5%) and lowest in southern Indiana (17.4% ). The average debt-asset ratio for fulltime farmers was 23.7%.
Harrington [2] and other authors of USDA publications have used debtasset ratios to describe the amount of financial stress facing farmers, as follows:
Debt-asset ratio Status of farmer
Under 40% No apparent financial problems
40-70% Serious financial problems
70-100% Extreme financial problems
Over 100% Technically insolvent
About 24% of those responding to the Indiana survey had debt-asset ratios exceeding 40% in 1991. This is down from the 25% found in 1990 and 32% in 1985. About 6.5% had debt-asset ratios exceeding 70% in 1991, down from 8% in 1990 and 13% in 1985. The guidelines in the USDA classification suggest that about 6.5% of all Indiana respondents face extreme financial problems or technical insolvency; however, this tends to oversimplify the problem. For example, some skilled managers who carry a relatively small proportion of their debt in the form of land debt may be in satisfactory financial condition despite having a debtasset ratio exceeding 40%. Additional analyses involving subsets of respondents and cross-tabulations will be reported later in the article to assess more fully the meaning of the debt-asset ratio figures.
About 31 % of respondents reporting gross farm incomes of $100,000 or more had debt-asset ratios exceeding 40% in 1991, which is down from 33% in 1990. About 7.3% had debt-asset ratios exceeding 70% in 1991, down from 9.8% in 1990 and 12.6% in 1989. The USDA guidelines suggest that about 7% of Indiana respondents with $100,000 gross farm income and over could face extreme financial difficulties.
Delinquency Rates. A second measure of financial condition is the rate of delinquency of loan payments. Those respondents having real estate loans (51.1% of all. respondents) were asked if their principal and interest payments were current. For all respondents, 3.4% said “no” (Table 4). This is 1.5 percentage points lower than the 4.9% reported in 1990 and nearly 5.4 percentage points lower than the 8.8% reported in 1986. This figure underscores the
lessening of problems with real estate debt. Also, about 38% of those who were delinquent on their real estate loans were current on the interest payments and delinquent only on principal payments. The same question was asked about nonreal estate loans. About 8.7% of the respondents having nonreal estate loans indicated that their principal and interest payments were not current (Table 4), nearly a percentage point higher than in 1990. However, the 1991 rate is five percentage points lower than the figure reported in 1989, 13.7%. Comparable figures for 1985 and 1986 were 22% and 14%, respectively. About 60% of those who were delinquent on their nonreal estate loans were current on the interest payments and delinquent only on principal payments.
The delinquency rates for respondents with gross farm incomes $100,000 and over were lower than the delinquency rates for all respondents. The delinquency rate for real estate loans was only 2.2% and the delinquency rate for nonreal estate loans was only 5.3%.
Loan Requests Rejected. A third indicator of the financial condition of farmers is the percentage of loan applications turned down by the lender. Respondents were asked if they were turned down for a 1991 farm loan and, if so, why the loan request was rejected. Only results for respondents who actually applied for a loan were considered. Of the 362 respondents indicating they applied for a loan (25 % of all respondents), about 7.1 % indicated they were turned down, which is down from 11.6% in 1990 (Table 4), and down considerably from the more than 16% reported in 1986.
Respondents were asked to indicate the reasons their loan applications were rejected. Their responses ranked by frequency appear in the following schedule:
Reason loan request was rejected Percentage of total reasons
Low farm income 29%
Insufficient equity 26%
Previous loan repayment problems 18%
Lender not interested in making agricultural loans 9%
Other 18%
Total 100%
The percentage of respondents who indicated they were turned down because the lender is not interested in making agricultural loans, 9%, is seven percentage points lower than the percentage found in 1990, 16%.
Respondents whose loan requests were rejected were asked if they eventually obtained loan funds for the 1991 crop year. Sixty-three percent of these respondents said “yes.” Thus, about 2.5% of those who applied for loans for the 1991 crop year were unable to get loan funds, which is essentially the same as the 3 % in 1990. This is less than 1 % of all respondents. The sources of loan funds for the 63% who eventually received loans are ranked by frequency:
Source of loan funds Percentage of total sources
Lenders other than FmHA 26%
Relatives 21
Farm suppliers 16
FmHA 16
Machinery dealers 5
All other sources 16
Total 100%
The 16% of the respondents who received loans from FmHA is equal to the 16% reported in 1990 and is lower than the 20% reported in 1988. This finding probably reflects the trend in FmHA lending, which is to decrease the amount of direct loans and to increase the amount of guaranteed loans.
The percentage of respondents with GFI $100,000 and over who indicated they were turned down when applying for a 1991 farm loan was only 4.1 %. None of those turned down indicated they were turned down because the lender was not interested in making farm loans.
During the past 12 months, Indiana farmers have expressed concerns to the authors about the availability of loan funds. The concerns are that some lenders in Indiana have stopped making loans to farmers and this has resulted in a shortage of loan funds for farmers. No evidence was found in this study to support the position that there is a shortage of loan funds for farmers.
Additional lnformation on the Incidence of Farm Financial Stress
In this section, statistics are presented which show debt-asset ratios for all farms and those with gross incomes of $100,000 and over. Other statistics relate debt-asset ratios to debt owed by farm operators with different levels of gross income.
Debt-Asset Ratios for Different Size Farms.
Table 5 shows the percentage of all farmers and the percentage of farmers with gross incomes exceeding $100,000 per year that fell in the different debt-asset ratio categories in 1991. About one-fourth of all respondents had debt-asset ratios of 40% or more compared to about 30% of those with gross incomes of $100,000 and over. The percentage of respondents in this higher debt category declined about one percentage point for all farmers and about 2.5 percentage points for those with higher gross incomes (Table 5).
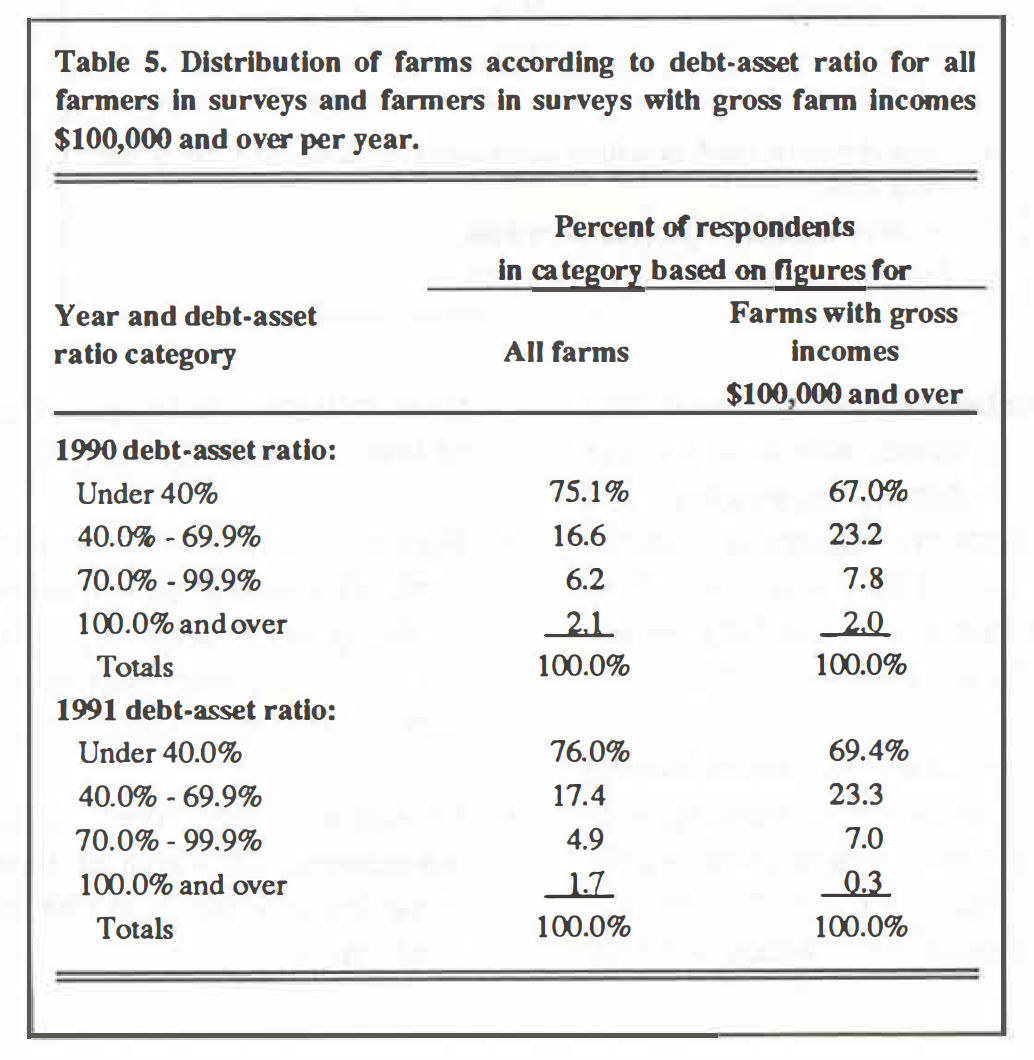
Table 5. Distribution of farms according to debt-asset ratio for all farmers in surveys and farmers in surveys with gross farm Incomes $100,000 and over per year.
Amount of Debt Owed by Respondents in Different Debt-Asset and Gross Farm Income Categories.
Debt is becoming less concentrated in the hands of respondents in the higher debtasset ratio categories. As noted in the figures for 1991, about 17% of the debt was owed by respondents with debtasset ratios of 70% or higher and about 3% of the debt was owed by respondents who were technically insolvent. The 3% is down from 6% in 1990 and from 9 .9% reported in 1988. The nearly 2% of the respondents who are technically insolvent and some respondents in the 70.0% to 99.9% debt-asset ratio category presumably are vulnerable to any future financial adversities encountered.
Debt-asset ratio category % of respondents % of Debt
Under 40% 76 42.6
40-69.9% 17.4 40.5
70-99.9% 4.9 13.7
100% and over 1.7 3.2
Total 100% 100%
Farm Adjustments
Farmers were asked to identify the adjustments they had made during the past 12 months and those they expected to make during the next 12 months. The adjustments checked by respondents, ranked according to frequency of mention using the state figures, appear in Table 6. Each adjustment made or expected to be made, which accounted for less than 5% of the total, was lumped together in the “other adjustments” item in Table 6.
Past 12 Months. The adjustments made during the previous 12 months that were most frequently mentioned by respondents were “reduced debt,” “purchased new/additional machinery,” “increased off-farm work,” “kept more complete records,” and four other adjustments (Table 6). Several of the adjustments made during the past 12 months can be categorized as changes which helped them to reduce costs ( e.g., those relating to reducing debt and hiring others to do custom work), to diversify and reduce risks ( e.g., used my machinery to do custom work for others, adding or expanding livestock enterprises, increasing off-farm work and buying crop insurance), and to more accurately measure farm costs and returns (e.g., keeping more complete records).
Next 12 Months. Many of the adjustments planned for the next 12 months by the respondents are similar to those made during the previous 12 months and to those reported on previous surveys.
“Reducing debt” topped the list followed by “purchasing new/additional machinery,” “increasing or adding a livestock enterprise,” “keeping more complete records,” “increasing offfarm work,” and “hiring others lo do custom work with their machinery.” Several of the adjustments planned for the next 12 months can be categorized as changes which will help them reduce costs (e.g., reducing debt, hiring others to do custom work with their machinery and reducing living expenses), more accurately measure farm costs and returns (e.g., keeping more complete records), diversify (e.g., increasing offfarm work and increasing or adding a livestock enterprise) and upgrade capital (e.g., purchasing new/additional machinery).
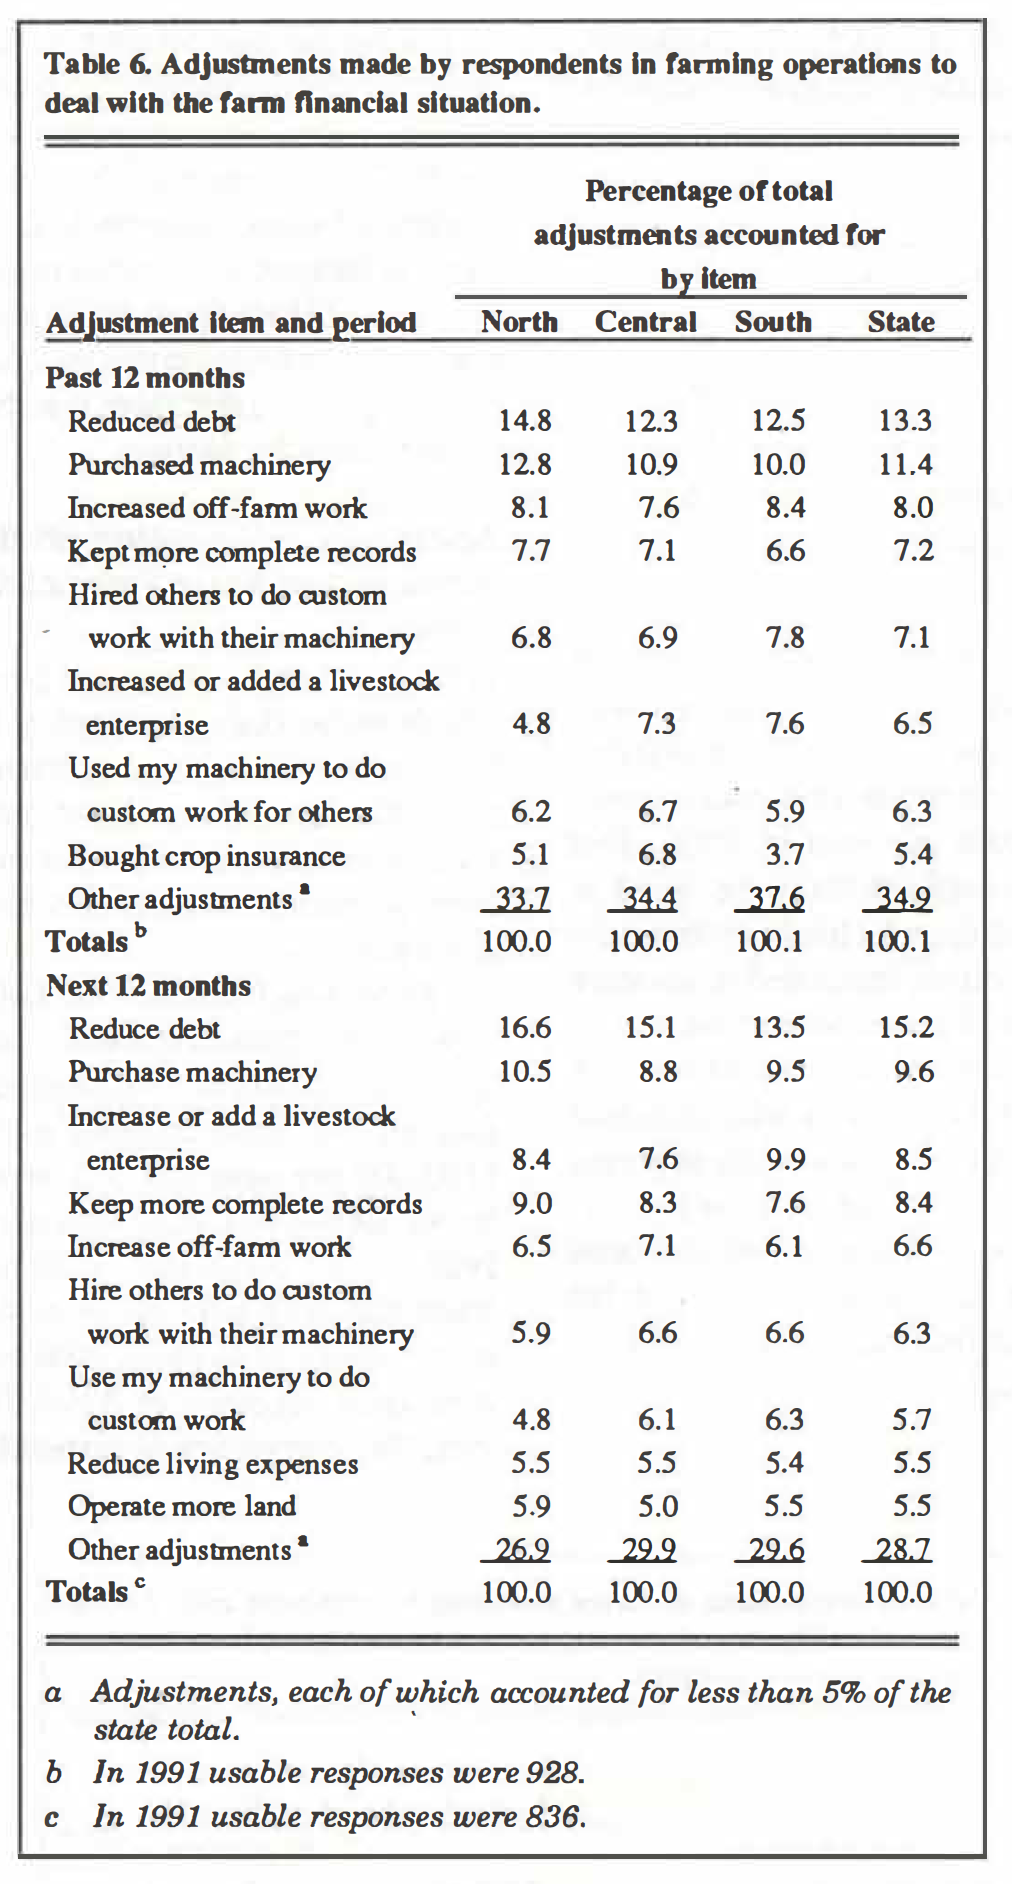
Table 6. Adjustments made by respondents in farming operations to deal with the farm financial situation.
Impact of Dry Growing Conditions In 1991 on the Financial Condition
The full impact of the dry growing conditions in 1991 on the financial condition of Indiana farmers obviously will not be known until crops are harvested and other factors affecting future farm costs and returns are assessed. Crop forecast suggests high variability in com and soybean yields by reporting district. However, certain positive and negative developments effecting the farm financial situations of individual farmers can be identified. Positive factors include the following:
- Many Indiana farmers have reduced debt, diversified, increased the use of risk-reducing strategies, and adopted other management practices during 1989-1991, which will help them to better withstand the impact of low farm earnings in 1991.
- Many agricultural lenders in Indiana gained experience in working with loan repayment problems during the “Farm Crisis” of the mid 1980s and the drought of 1988, which will help them to better deal with the impact of low farm earnings in 1991.
- Farmers have increased off-farm work. Depending on improvements in the general economy, off-farm employment opportunities may improve during the next year.
- Farmland prices have stabilized, maintaining the value of farm real estate assets. From June 1990 to June 1991, the average price of bare tillable land in Indiana increased by about 2% [1].
- Much debt restructuring and/or write off of debt by farm lenders occurred during the late 1980s and early 1990s. Only about 3% of the farm debt is owed by farmers who were technically insolvent on January 1, 1991, compared to 10%on January 1, 1988.
- Interest rates on farm loans reported by respondents in 1991 are lower than reported in 1990, and at some lenders interest rates are currently lower than what is reported in the article.
- FmHA has eased the emergency loan requirements for farmers. Farmers no longer have to suffer a qualifying loss on all crops to be eligible for an emergency loan. A substantial loss – normally 30% of normal production – of a single crop in a disaster is sufficient.
Negative factors include the following:
- Some producers will experience below-average crop yields. Increases in crop prices may not be sufficient to maintain earnings at a profitable level.
- Livestock producers may face higher than expected prices for feed.
- Lower hog prices are in prospect. Some analysts forecast prices for barrows and gilts in the mid-$40 range throughout the next 12 months.
- Farm production costs will likely increase for the 1992 crop year, led by increases in prices of purchased feeds.
- Cattle feeders have had substantial losses since June, which will reduce the abilities of cattle feeders to absorb increased feed costs this winter unless feeder cattle prices decline sharply.
Clearly, the net impact of these factors will vary from farm to farm, depending on how much damage is sustained from dry growing conditions, farmer’s financial reserves, how much nonfarm income the family earns, and a host of other factors. However, most Hoosier farmers are in a better position to withstand the problems created from the dry growing conditions in 1991 than they would have been in 1985, 1986, or even 1988.
Summary and Implications
Key findings and implications of the 1991 farm finance survey are that:
- The distribution of net farm incomes for respondents in 1990 is similar to the distribution found in 1989. About 22% of the respondents in 1990 had net farm incomes greater than $20,000, up slightly from the figure reported for 1989. The percentage of respondents in 1990 with a net loss, 23.8%, is slightly lower than the percentage with a net loss in 1989. The percentage of full-time farmers reporting a net loss in 1990 is 8.8%.
- The economic condition of farmers will be influenced strongly by conditions in the nonfarm sector, because many part-time farmers in this group depend heavily on offfarm work for income. The average total gross nonfarm income for respondents in 1990 was about$29,287.
- The average debt-asset ratio for respondents in 1991 is lower than the average ratio for respondents in 1990. The debt-asset ratio in 1991 is 21.2%, down from the 24.3%reported in 1990. The debt-asset ratio in 1991 for respondents with GFI of $100,000 and over is 23.7%.
- The delinquency rate on farm real estate debt in 1991, 3.4%, is down from the 4.9% reported in 1990. The 8.7% delinquency rate on farm nonreal estate debt in 1991 is up from 7.9% reported in 1990, but down from the 13.9% in 1986 and the
- The percentage of Hoosier farmers who applied for a new loan or additions to existing farm loans for the 1991 crop year and were turned down, 7.1%, is down from 11.6%reported in 1990, and from 16.3% in 1986. The percentage of full-time farmers who applied for a loan in 1991 and were turned down is 4.1 %. This figure is less than 1 % of all respondents.
- The percentage of all respondents in 1991 with debt-asset ratios less than 40%, 76.0%, is slightly higher than the percentage for 1990. The percentage of farmers in 1991 with gross farm incomes exceeding$100,000 and debt-asset ratios less than 40%, 69%, also was slightly higher than for 1990.
- The percentage of all respondents in 1991 with debt-asset ratios greater than 70%, 6.6%, is lower than the 8 .3 % reported in 1990. The percentage of farmers in 1990 with gross farm incomes $100,000 and over and with debt-asset ratios greater than 70%, 7.3%, is down from 9.8% in 1990 and 12.6% in 1989.
- The percent of debt held by all respondents in 1991 with 100% or higher debt-asset ratios, 3.2%, is down from 6.1 % reported in 1990 and 9.9% in 1988.
- During the past year, “purchasing additional machinery” was the second most frequently mentioned adjustment for respondents.
- There are no data to support the claim that there is a significant increase in the number of lenders in Indiana who have stopped making loans to farmers or that there is a shortage of loan funds available to farmers. The percentage of applicants in 1991 who applied for a loan but were turned down because the lender was not interested in making agricultural loans, 9%, is down from 16% in 1990. The percentage of respondents unable to get a loan for the 1991 crop, 2.5% of those who applied, is down slightly from the percentage in 1990.
In summary, several findings noted above are interpreted as signaling general improvement in the financial condition of Hoosier farmers, but survey data were collected prior to the deterioration in growing conditions. However, two qualifications should be mentioned. First, farmers in the higher debt-asset ratio categories could experience major financial problems in the future if they encounter any substantial adversity, such as low earnings from reduced yields. Second, a group of Hoosier farmers continue to experience financial problems and will likely require additional debt restructuring and/or write-off. Thus, all Hoosier farmers should continue efforts to reduce costs, improve efficiency, and reduce risks. Such adjustments will enable them to better withstand financial problems that may occur in 1991 and 1992.
References
[1] Atkinson, J. H. and Kim Cook, “Indiana Farmland Values Edge Upward,” Purdue Agricultural Economics Report, August 1991.
[2] Harrington, David H., “A Summary Report on the Financial Condition of Family-Size Commercial Farms,” ERS-USDA, Ag. Info. Bul. No. 492, March 1985.
![]()
![]()
![]()
![]()
![]()
