The Economic Situation of the North Central Region and a Zoom in on Indiana: An Analysis Using the NCR-Stat Baseline Survey
March 23, 2026
PAER-2026-05
Authors: Ivanna Carrillo-Siller, Agricultural Economics Graduate Research Assistant; Laura Montenovo, Agricultural Economics Assistant Professor, State and Local Finance
![]()
![]()
![]()
![]()
![]()
Main Takeaways
- Hoosiers are as likely as the rest of the North Central region to receive government financial assistance, but are more likely to receive living assistance. In contrast with these groups, workers in farming, fishing and forestry have 20% higher financial assistance participation, particularly participating in tax assistance.
- Although Indiana has a slightly lower percentage of residents on federal food assistance programs, it follows a very similar trend when compared to the rest of the North Central region. Up to two-thirds of individuals receive no food assistance, while the majority of food assistance programs have a participation of less than 2%.
- While the largest group of Indiana insured residents is occupied by those on Medicaid or government assistance, workers in farming, fishing and forestry are insured through their current employer at a much higher percentage than the rest of the region.
Quantitatively understanding the socio-economic characteristics of an area conveys important information on its capacity for financial self-sufficiency, resistance to economic shocks, and overall quality of living. The level of dependence on public support and the degree of economic distress across different geographical areas may provide policymakers with useful insights into how to target programs to different subgroups and how families cope with economic scarcity or uncertainty.
In this report, we provide key socio-economic information on the states of the North Central region of the United States (which we colored in Figure 1), with a more careful look at Indiana. We use data from the baseline survey developed by the North Central Regional Center for Rural Development (NCRCRD), one of four Regional Rural Development Centers in the United States. It covers 12 states in the North Central region of the United States.[1] As part of their main contributions to researchers and the broader community, they developed NCR-Stat, an open-access database with, among others, two baseline questionnaires distributed in 2022 and 2024.
Figure 1
The North Central Region
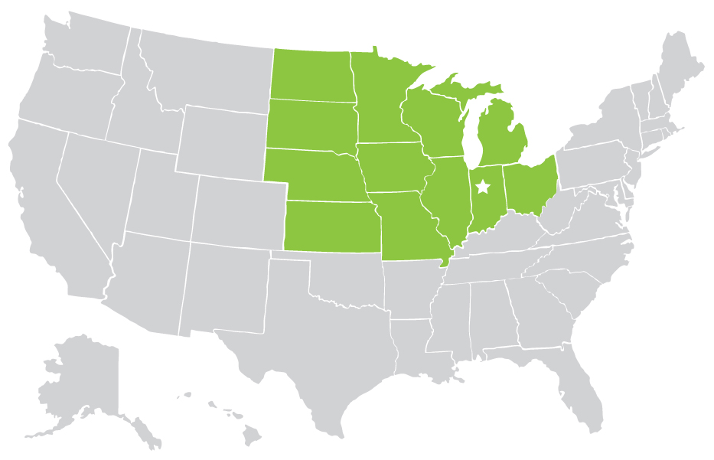
Note: Credit to Regional Rural Development Centers (https://ag.purdue.edu/rrdc/north-central-regional-center.html)
From the baseline questionnaire, we pull information on socio-demographics, financial public assistance programs, and health insurance in the North Central region overall and in Indiana in particular. We summarize the descriptive statistics on the basic demographic composition of the sample, its coverage, access and the distribution of public programs and health insurance plans, and compare changes over time between 2022 and 2024. We aim to provide a quantitative picture of the economic resiliency of these areas, on the financial security of the households and how Indiana compares to other states in the North Central region.
The region’s economic landscape exhibited that 22% of the respondents made less than $25,000 in 2022, 31.7% made between $25,000 and $49,999, 19.3% made between $50,000 and $74,999, and 12.4% made between $75,000 and $99,999. The remaining 13% made more than $100,000. Based on income data from the American Community Survey,[2] the respondents of the NCR-Stat are disproportionately of lower income.[3] Moreover, in our overall sample, 31.4% of the respondents were male in 2022, a percentage that increased to 43.7% in 2024, indicating an increase in the sex-representativeness of the respondents, with about 50% of the individuals being males and the other half being females. With the mean age of the respondents around 51 years old, the sample is about 10 years older than the US mean; however, this is in large part explained by the fact that the NCR-Stat respondents are at least 18 years old. The majority of the sample is in suburban areas, followed by urban and then rural areas. In 2022, 43% lived in suburban areas, 31.28% in urban areas, and almost 26% in rural areas. Two years later, the share in suburban areas decreased to about 37%, for urban areas it increased to almost 36% and in rural areas it increased to almost 29%. Due to the difference in our sample composition that emerges in the economic and demographic variables summarized above, our results should be interpreted with those key differences in mind.
NCR-Stat includes a question about whether the respondent has received financial assistance from the government, and, if so, of what type. Figure 2 shows the answers for the entire sample in the North Central region, amounting to 4,272 respondents. The pie chart shows that around 70% of the population stated having received no financial assistance from the government in the past 12 months. This number is slightly higher than the national average. The remaining share is largely comprised of those receiving other non-listed governmental assistance (9.9%), those on multiple assistance programs (5.9%), and the living and insurance assistance categories (5.5% and 5.24%, respectively). The least common financial assistance category was that of loan payment, with only 0.91% of the total.
Figure 2
Governmental Financial Assistance by Type in the North Central Region (2024)
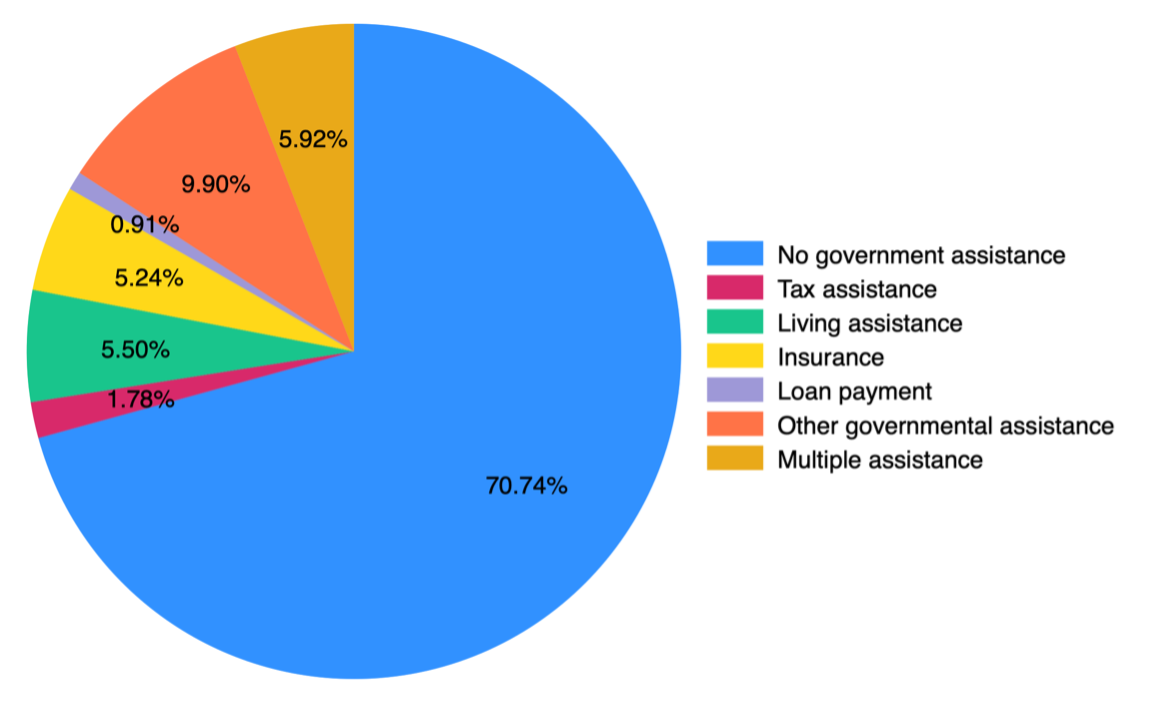
Note: The survey question asks whether the respondent has received any governmental financial assistance in the last 12 months, with N= 4,272. The color-coded categories indicate different types of assistance. The categories, which we number from top to bottom in the legend, include (2) e.g., Education and training, disaster relief and recovery, life events, military, childcare and support, (3) Temporary Assistance for Needy Families, the Housing Choice Voucher program, Transition from Homelessness, (4) e.g., unemployment insurance, crop insurance, health and medical assistance, housing loans, Veterans’ Group Life Insurance, National Flood Insurance Program, (5) e.g. educational loan repayment, and (7) Captures all respondents that stated having received more than one of the listed forms of assistance.
Indiana is closely aligned with the rest of the North Central region regarding the share of individuals who are not receiving any government assistance (around 70.6%). However, for those who are, there are some differences. A smaller share of Hoosiers, relative to the rest of the region, receives tax assistance, insurance from the government and is on “other” government assistance. Instead, a much larger percentage of Hoosiers receive living assistance. Though with a smaller difference relative to the rest of the region, Indiana residents are also more likely to benefit from multiple forms of assistance.
We also consider the distribution of governmental financial assistance after selecting workers in farming, fishing and forestry in the North Central region (N=58). The responses are summarized in Figure 3. Compared to the overall sample, there are substantial differences. First, almost 20 percentage points fewer individuals in farming, fishing and forestry do not use any government financial assistance, making this subpopulation more dependent on public financial programs, at least in the North-Central region. Second, almost 14% of this subpopulation uses tax assistance from the government, while that category is less than 2% of the entire sample. Third, although with slimmer differences, the workers in farming, fishing and forestry use more living assistance, loan payment programs and multiple assistance programs. Instead, the overall population tends more to rely on insurance and other non-listed government assistance programs.
Figure 3
Governmental Financial Assistance by Type for Workers in Farming, Fishing and Forestry in the North Central Region (2024)
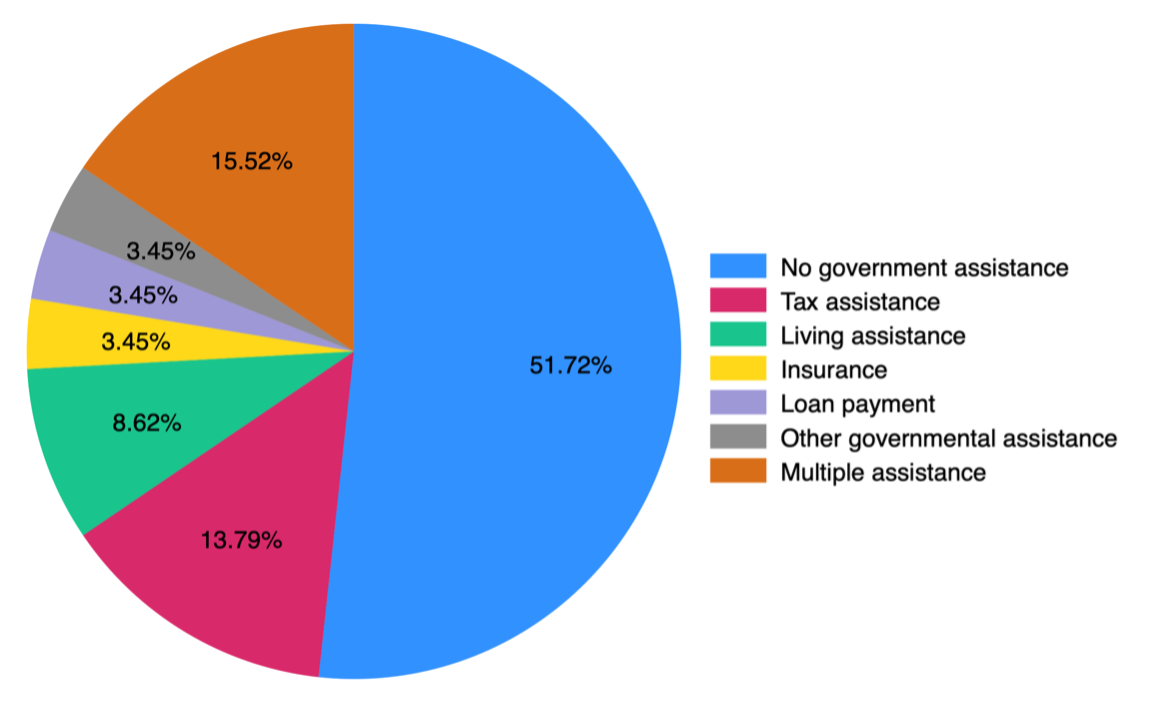
Note: The survey question asks whether the respondent employed in Farming, Fishing, and Forestry has, in the last 12 months, received any governmental financial assistance, with N= 58. The color-coded categories indicate different types of assistance. The categories, which we number from top to bottom in the legend, include (2) e.g., Education and training, disaster relief and recovery, life events, military, childcare and support, (3) Temporary Assistance for Needy Families, the Housing Choice Voucher program, Transition from Homelessness, (4) e.g., unemployment insurance, crop insurance, health and medical assistance, housing loans, Veterans’ Group Life Insurance, National Flood Insurance Program, (5) e.g. educational loan repayment, and (7) Captures all respondents that stated having received more than one of the listed forms of assistance.
Using other questions from the 2024 survey, we show that about 67% of the households in the North Central region did not receive state-specific Supplemental Nutrition Assistance Program (SNAP) or Food Stamp Benefits in the past 12 months, with the remaining 33% of the households receiving SNAP benefits. Among Hoosiers, the percentage of non-recipients was 68.8%, about 2 percentage points higher than the North Central average. Instead, for workers in farming, fishing and forestry in the North Central region, the percentage of recipients is substantially higher, at 45.6%.
We also consider a more detailed breakdown of the type of federal food assistance programs individuals participated in. In 2024, among all recipients of federal food assistance, we see the vast majority are on food stamps, followed by the second-largest share being on multiple programs. Just about 1% is on the Women, Infants, and Children nutrition program (WIC), while other programs like the National School Lunch Program, Meals on Wheels, the School Breakfast Program and the Summer Food Service each cover less than 1% of respondents. Relative to 2022, there has been a slight increase in food stamp recipients, a decrease in individuals enrolled in multiple programs and a 1-percentage-point decrease in WIC recipients.
One area that has been highly debated and policy-relevant at both the federal and state levels is health insurance coverage. NCR-Stat collects information on the types of health insurance and their coverage for the North Central region, and we report the respondents’ answers in Figure 4. The data suggest that the largest share of health insurance coverage is provided by a current or former employer or union (24%), closely followed by Medicaid or government assistance (22%), and Medicare (21%). Instead, 15.5% have multiple coverage plans, 8% purchased it from a private company, and 6.4% are uninsured. Given that the share of individuals without insurance nationally was 8.2% in 2024, the North Central region is characterized by a broader rate of health insurance coverage.
Relative to 2022, somewhat considerable changes occurred. First, the share of individuals insured through a current or former employer (or union) decreased by over 2.5 percentage points between 2022 and 2024. Instead, the share of people on Medicaid or government assistance increased by over 3 percentage points, the share on Medicare increased by over 1.5 percentage points, and the share purchasing private insurance increased by about 1 percentage point. Instead, the share of people who have multiple coverage decreases by almost 4 percentage points. Finally, the share of people without health insurance coverage remained largely unchanged.
Figure 4
Types of Health Insurance Coverage in the North Central Region (2024)
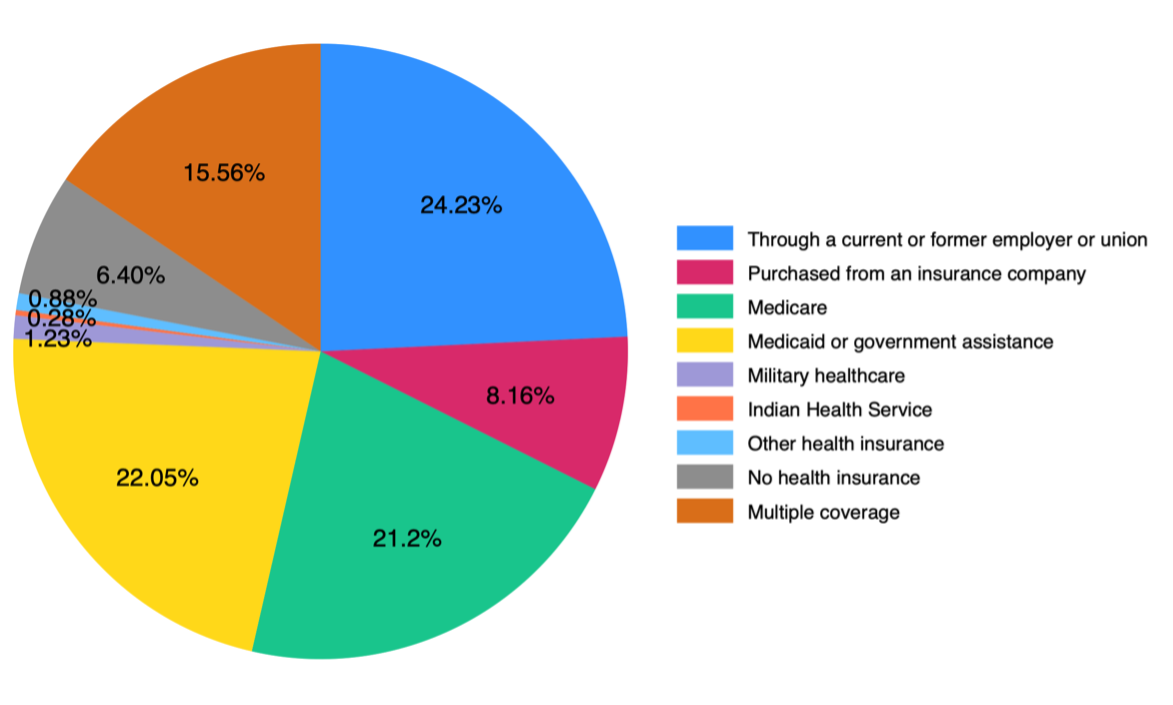
Note: The survey question asks whether the respondent is currently covered by any of the possible categories of health insurance or is not currently enrolled in health insurance coverage, with an N= 4,312. The categories, which we number from top to bottom in the legend, include: (1) and (2) Through yourself or another family member, (5) TRICARE, Veteran Affairs, Champ, and (9) Captures all respondents that stated they are currently covered by two or more of the coverage options.
Figure 5 exhibits the information plotted in Figure 4, but this time selecting only Indiana residents (N=416). Hoosiers are 2.5 percentage points less likely to get coverage through their job, about 2 percent less likely to purchase private insurance, over 5 percentage points more likely to be covered by Medicaid or government assistance and 2 percentage points less likely to be on Medicare. The rates of uninsured individuals and of those on multiple coverage plans in Indiana are roughly in line with the North Central region.
Figure 5
Types of Health Insurance Coverage in Indiana
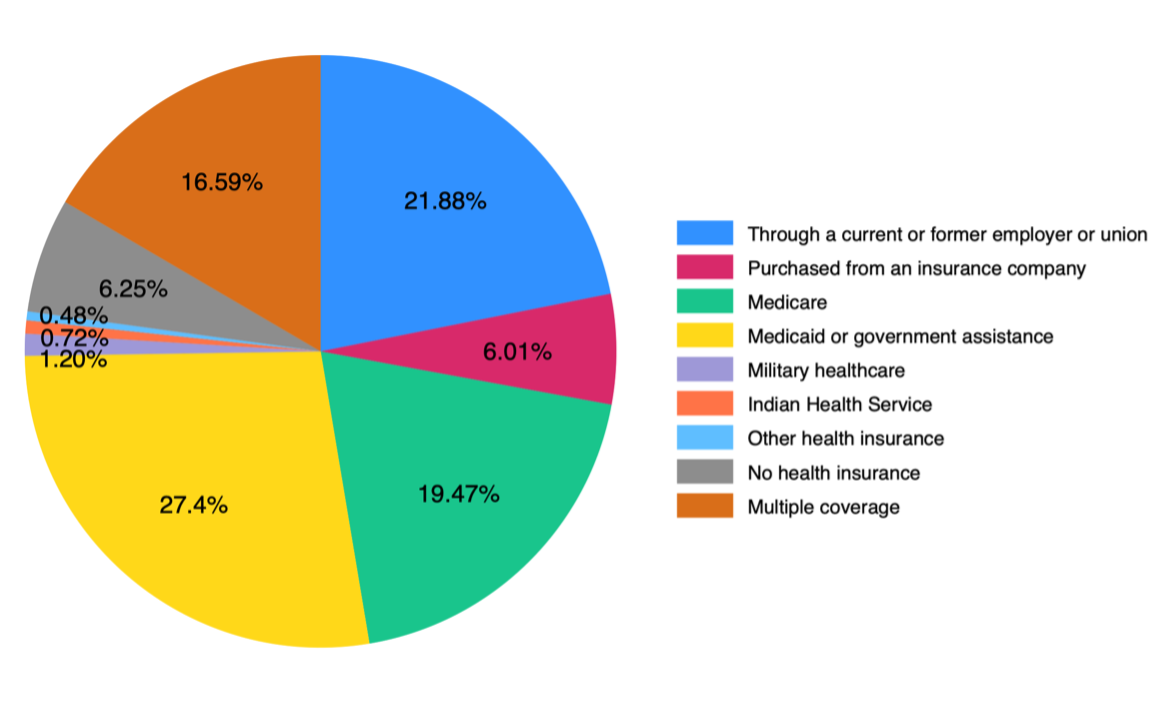
Note: The survey question asks whether the respondent, an Indiana resident, is currently covered by any of the possible categories of health insurance, or is not currently enrolled in health insurance coverage, with an N= 416. The categories, which we number from top to bottom in the legend, include: (1) and (2) Through yourself or another family member, (5) TRICARE, Veteran Affairs, Champ, and (9) Captures all respondents that stated they are currently covered by two or more of the coverage options.
Next, we select the subsample of full-time or part-time employees of the agriculture, forestry, and hunting industry in 2024. In Figure 6, we plot their health insurance coverage share in the North Central region. In this subsample of employed individuals, the share of those with coverage through their job is about 45%, and those who purchased it through an insurance company is 12%. In this sample, 5% are on Medicare, about 8.5% are on Medicaid and over 21% are on multiple coverage plans. Finally, about 8.5% are without health insurance coverage.
Figure 6
Types of Health Insurance Coverage for Workers in Farming, Fishing and Forestry in the North Central Region (2024)
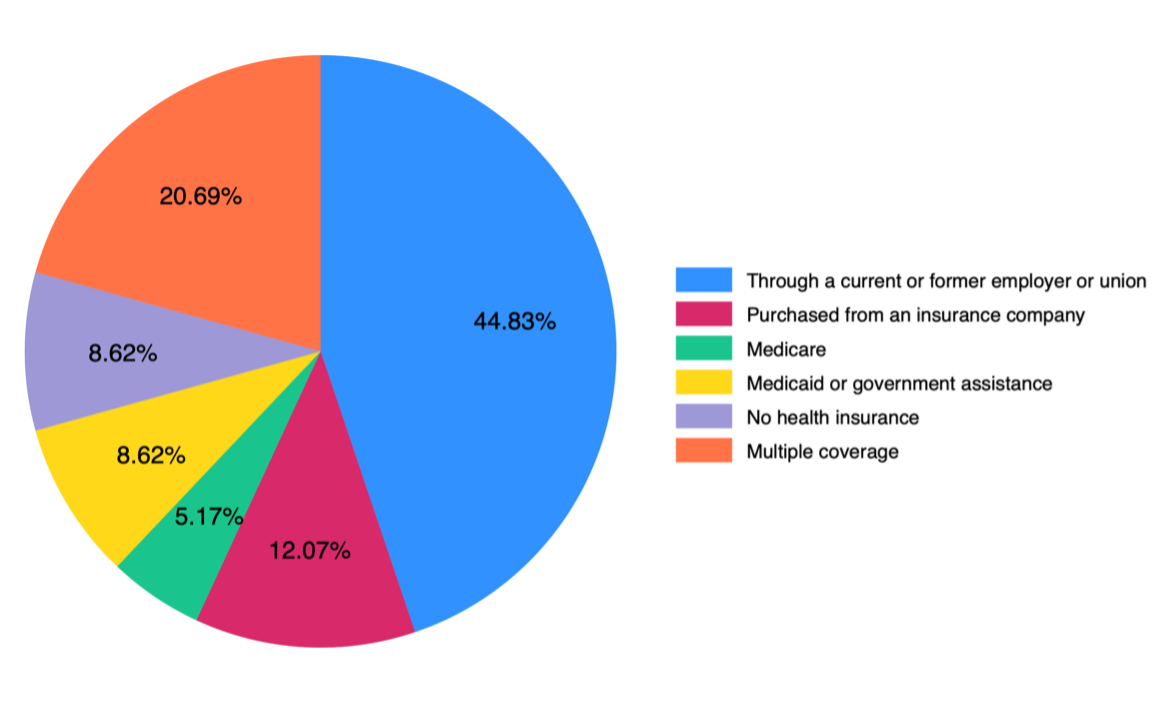
Note: The survey question asks whether the respondent, employed in Farming, Fishing, and Forestry, is currently covered by any of the possible categories of health insurance or is not currently enrolled in health insurance coverage, with an N= 416. The categories, which we number from top to bottom in the legend, include: (1) and (2) Through yourself or another family member, and (9) Captures all respondents that stated they are currently covered by two or more of the coverage options.
The descriptive analysis in this report summarizes trends in the receipt of public financial assistance by the residents of the North Central region, in general, and of Indiana specifically. Moreover, we report information on how these residents obtain health insurance coverage and the share of those who do not have access to such coverage. Within our sample, the share of individuals receiving no government assistance (i.e., about 70%) is similar between Indiana and the broader North Central region, which is also approximately in line with the national share. However, Indiana residents, differently from the North Central region, use more living assistance. Further, workers in farming, fishing and forestry are 20 percentage points less likely to use public financial assistance, at least in part, possibly explained by their having income from employment. When we focused on the share of individuals receiving food-related public assistance, we showed that about 33% of residents in the North Central region and in Indiana received SNAP or Food Stamps, while the percentage increases to 45.6% among workers in farming, fishing and forestry. Finally, we report information on health insurance coverage, and we find that in the North Central region, the shares of surveyed individuals receiving insurance from an employer, Medicare or Medicaid are very similar. In Indiana, 27% of the respondents receive insurance through Medicaid, and about 20% receive it through an employer, with a similar percentage getting it through Medicare.
The summarized information we collected from NCR-Stat provides a useful picture of the most utilized forms of public financial assistance, their geographic distribution, and the types of subpopulations that are most targeted by each. This picture of public program utilization and health insurance coverage provides both policymakers, extension communities, and local constituencies with key information for decision-making.
[1] Illinois, Indiana, Iowa, Kansas, Michigan, Minnesota, Missouri, Nebraska, North Dakota, Ohio, South Dakota and Wisconsin.
[2] According to the data from the US Census Bureau, 34% of Hoosier households made less than $50,000, about 32% made between $50,000 and $99,999, and about 34% made over $100,000.
[3] Similar considerations apply to the NCR-Stat data in 2024.
![]()
![]()
![]()
![]()
![]()
