The Iran Conflict and Consumer Food Prices: A Broad but Lagged and Sticky Shock
March 31, 2026
PAEPB-2026-02
Ken Foster, Professor of Agricultural Economics and Director, Purdue Farm Policy Study Group; Bernhard Dalheimer, Assistant Professor of Macroeconomics and Trade
![]()
![]()
![]()
![]()
![]()
Key Takeaways
-Unlike a drought or crop disease, the current shock originates in geopolitics, spills into energy markets and propagates through every link of the food supply chain at once — transportation, packaging, processing, refrigeration, and retail operations all face simultaneous cost pressure.
-This breadth means that consumers’ normal escape route — substituting away from expensive food categories toward cheaper ones — is largely closed. There are no “low-energy” food categories in the modern food system.
-Yet the farm share of the consumer food dollar is only about 16 cents in aggregate (24 cents for food at home). The farm-cost channel alone does not mechanically drive large retail food price increases.
-Price stickiness cuts both ways: cost shocks take three to six months to fully reach grocery shelves — but once embedded in retail prices, they are slow to come back down, even after the underlying cost pressure eases.
-History suggests a broad energy shock of this scale, if sustained, could add 3–6 percentage points to food-at-home inflation over 12–18 months. A short conflict resolved quickly will leave a much smaller footprint.
-The burden falls disproportionately on lower-income households, who spend a larger share of income on food, and who cannot easily substitute away from food inflation when it is broad-based.
The Farm Share Argument: Why Simple Pass-Through Overstates the Obvious
The initial public reaction to an oil price shock reaching $110 per barrel is often to project near-immediate, dramatic increases in grocery prices. This instinct overstates the direct farm-to-retail transmission channel in a straightforward and measurable way. The USDA Economic Research Service tracks how each dollar of consumer food spending is distributed across the supply chain in its Food Dollar Series. The picture it reveals is sobering for those who expect large, rapid retail food price responses driven purely by higher farm input costs.
For 2023, the farm share was only 15.9 cents of every food dollar spent by consumers — the remaining 84.1 cents went to the marketing system: food processing, packaging, transportation, wholesale and retail trade, foodservice operations, finance, and advertising. For food-at-home purchases (grocery stores and supermarkets), the farm share rises to about 24 cents per dollar, but for food away from home — restaurants and foodservice — it falls to only 5.4 cents of each dollar.
The arithmetic discipline this imposes is important. If farm-level commodity costs rise 20 percent due to higher fertilizer and fuel costs — which would be a historically large shock — the first-order effect on retail food-at-home prices is roughly 4–5 cents per dollar, or a 4–5 percent increase, all else equal. For restaurant meals, it is closer to 1 cent per dollar. The farm-input cost channel, taken alone, does not mechanically produce a food price crisis at the grocery checkout counter.
Figure 1
Where Does Your Food Dollar Go? and Energy Sensitive Shares of the Consumer Food Dollar
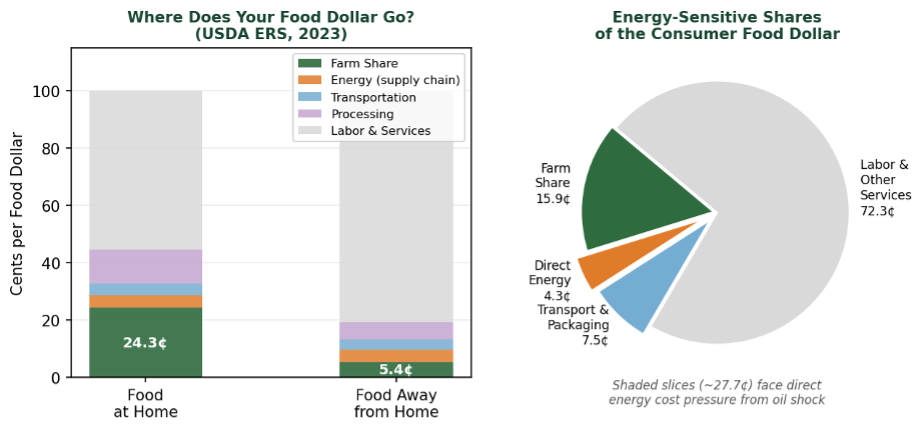
Left: Distribution of the consumer food dollar between farm share and marketing components for food at home vs. food away from home (USDA ERS, 2023). Right: Energy-sensitive slices of the total food dollar — direct energy use (4.3¢), transportation and packaging (est. 7.5¢), and the farm share (15.9¢) together account for roughly 27–28 cents of every food dollar exposed to the current shock.
Why This Shock Is Different: Energy Closes the Substitution Escape
The standard consumer response to a food price increase for a specific item or category is substitution: switch from beef to chicken when beef gets expensive; buy private-label instead of branded pasta when grain prices spike; shift spending from fresh produce to canned goods. This behavioral flexibility is real and important, and it is one reason that food price increases — while painful — typically moderate over time as consumers adapt.
The Iran conflict presents a fundamentally different problem. Because the shock originates in energy markets and crude oil affects every link in the food supply chain simultaneously, there is no food category that is meaningfully insulated from the cost pressure. Consider the energy-intensive activities embedded in virtually every food product a consumer might buy:
-Diesel powers every truck that moves food from farm to processor, processor to warehouse, and warehouse to retail store. There is no “low-transportation” food category — even locally grown produce travels by fuel-powered vehicle, and fuel is a key input to farm production.
-Petrochemicals are the feedstock for the plastic wraps, films, bottles, trays, and containers that package virtually all processed food. When crude oil rises, packaging costs rise across all categories regardless of what is inside.
-Higher crude oil prices activate a demand-side channel that compounds the supply-side cost pressure: as energy prices rise, crop-based biofuels become more profitable, pulling corn toward ethanol and vegetable oils toward biodiesel and sustainable aviation fuel.
-Refrigeration — from farm cold storage through trucking, warehouse, and grocery display cases — runs on electricity increasingly generated by natural gas, the price of which has also spiked with the Gulf disruption.
-Food processing is energy-intensive: cooking, sterilization, drying, freezing, and baking all require substantial direct energy inputs. These costs rise for canned goods, frozen foods, baked products, dairy, and meat processing alike.
-Restaurant and foodservice operations face rising costs for cooking energy, HVAC, and delivery logistics — explaining why food-away-from-home prices tend to respond to energy shocks even though the farm share of a restaurant meal is tiny.
Research across 36 OECD economies confirms this channel formally: energy CPI inflation has a statistically significant positive effect on food CPI inflation, and critically, the effect is larger when a country’s energy dependency is higher. A broad, multi-fuel energy shock — of precisely the kind created by the Strait of Hormuz closure, which cuts off oil, LNG, and refinery inputs simultaneously — activates this transmission more powerfully than an oil-only or gas-only disruption.
The practical implication is that consumers cannot easily substitute their way out of broad energy-driven food inflation. When beef gets expensive, chicken is a viable substitute. When energy gets expensive, there is no affordable “non-energy” food option.
Price Stickiness: The Two-Edged Sword
One of the most important practical realities of food price dynamics — and one often overlooked in commentary focused on spot energy prices — is the stickiness of retail food prices. Prices in grocery stores and restaurants do not adjust continuously in response to input cost changes the way commodity futures prices do. This stickiness has important implications that cut in two directions for consumers and policymakers.
Why Retail Prices Are Slow to Rise
The food supply chain is long, layered and operates substantially on fixed-term procurement contracts. A major food manufacturer may have locked in grain, packaging, and logistics costs months in advance. A grocery retailer operates on category management cycles that reset prices quarterly or even annually for staple items. The result is that a commodity or energy price shock hitting farm and wholesale markets today typically takes three to six months to fully propagate to retail shelf prices — and for some products dependent on seasonally stored commodities (grains, canned goods, frozen vegetables), the lag can extend to twelve months or beyond.
Several additional factors dampen the speed of pass-through. Labor costs, which account for the largest single share of food marketing costs at approximately 45 cents per food dollar, do not rise immediately with an energy shock. Retail grocery competition is intense, creating strong incentives for chains not to be the first to raise prices. And retailers often absorb short-term cost increases in margin compression rather than pass them through, betting on a cost reversal that would otherwise require a second, embarrassing price reduction.
This means that in the first weeks and months of the Iran conflict, grocery store price increases will be modest and concentrated in the most energy-visible categories — gasoline (obviously), some fresh produce transported by refrigerated truck, and items with high packaging cost content. The broad food inflation story will take time to develop.
Why Retail Prices Are Slow to Fall
The same institutional structure that slows price increases also slows price decreases — but the asymmetry tends to favor slower reductions. This phenomenon, sometimes called “rockets and feathers” in the price transmission literature (prices rocket up and fall like a feather), has been documented across many food and energy markets. Several mechanisms drive it.
Menu costs — the administrative burden of changing price tags, updating systems, and re-printing materials — are real and create a natural ratchet effect. More importantly, retailers who have raised prices and maintained margins at higher levels have little competitive incentive to be first to cut, preferring instead to restore margins that were compressed during earlier periods of cost absorption. Consumers, once accustomed to a higher price point, may not exert the same pressure to reverse it as they did to resist the initial increase.
For food items dependent on seasonally produced and stored commodities — canned tomatoes, frozen corn, dried beans, wheat-based products — the price of the underlying commodity can fall dramatically before the retail price reflects it, because processors have committed to purchase the stored supply at the earlier, higher price. These supply chain inventories insulate the consumer from immediate price spikes when commodity prices rise, but symmetrically insulate the retailer’s cost structure from falling commodity prices when the supply situation eases.
The policy implication is significant: if the Iran conflict persists long enough that retail food prices incorporate the energy and commodity cost shock — roughly 6 to 12 months of sustained pressure — those prices are likely to remain elevated for a substantial period after the conflict ends and energy prices normalize. The consumer food price burden from this shock could easily outlast the geopolitical shock itself by 12 to 18 months.
Figure 2
Price Transmission Lag: From Energy Shock to Retail Food Prices
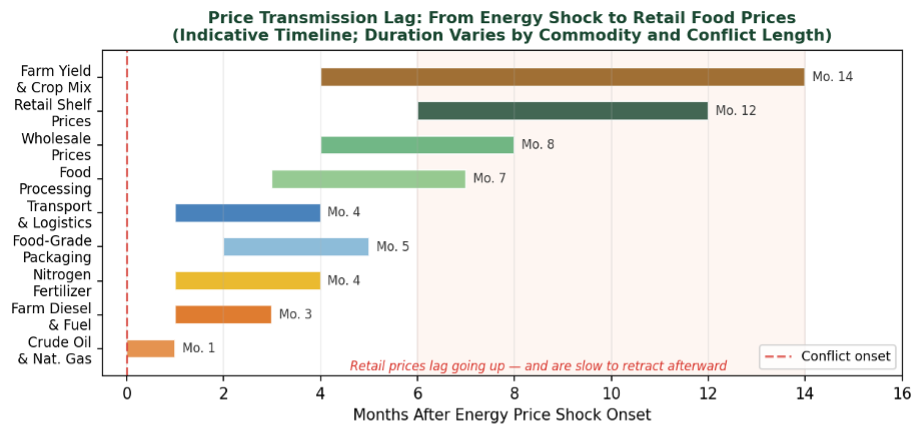
[1] Indicative price transmission timeline from energy shock onset to retail food prices. Each supply chain node introduces additional delay, with retail shelf prices typically reflecting the full cost pressure 6–12 months after the initial energy price event. The shaded region highlights the period of retail price stickiness — prices are slow to rise and slower still to fall. Note that farm yield and crop mix adjustments (the supply response) extend the price signal furthest out in time.
Historical Parallels
Two recent historical episodes provide the most useful benchmarks for assessing the likely food price impact of the current conflict. Both involved broad energy shocks that simultaneously raised costs across the food supply chain.
The 2007–2008 Global Food and Energy Crisis
Between early 2007 and mid-2008, crude oil prices climbed from roughly $55 per barrel to nearly $130–140 per barrel, driven by strong global demand and geopolitical tensions. This was accompanied by the simultaneous implementation of the U.S. Renewable Fuel Standard, which diverted substantial corn volumes into ethanol production, creating a structural linkage between energy and food commodity markets that amplified the cost signal. U.S. food-at-home CPI rose approximately 6.4 percent in 2008, with the largest increases in bread and cereals (+10%), dairy (+8%), and fats and oils (+8%). These increases were mostly driven not by an energy shock but by income and population growth on the demand side; however, when oil prices collapsed in the second half of 2008, food prices did not fall commensurately — consistent with the price stickiness dynamics discussed above.
The 2007–08 episode is relevant to 2026 because the biofuel linkage is again active: with crude above $100 per barrel, soybean oil, corn, and other vegetable oils face elevated demand from the biofuel sector, adding a demand-side food price push on top of the supply-side energy cost pressure. Bloomberg reported that soybean oil jumped more than 5 percent and palm oil surged in the days immediately following the current conflict’s onset. The mitigating aspect is that in the intervening years, substantial new crop acreage in other countries has filled the supply gap created by the Renewable Fuel Standard. The increased production capacity may temper some food price shocks arising from the current crisis.
Russia’s Invasion of Ukraine, 2022–2023
The 2022 episode accompanied the most severe food price inflation in the United States since 1979, with food-at-home CPI rising 11.4 percent for the full year. This shock combined a massive energy price surge — natural gas prices nearly doubled in Europe, crude oil spiked to $130 per barrel — with the direct removal of Ukraine’s wheat, corn, and sunflower exports from world markets (Ukraine supplied roughly 10–12 percent of global wheat exports), plus pandemic-era supply chain disruptions and labor market tightness. It is worth a precaution that the impact here is confounded with those of COVID-19 and post-pandemic market disruptions and market rebounding.
The 2022 episode should be treated as an upper bound for the current situation. Ukraine was a major grain supplier; Iran is not. The grain supply disruption that added so much fuel to the 2022 commodity price fire is absent from the current shock. But the energy cost structure of the 2022 episode — broad-based, multi-fuel, hitting every node of the food supply chain — closely parallels the current situation. The 2022 food price response provides a ceiling estimate; the 2007–08 episode (a pure energy shock without a direct grain supply disruption) may be the more appropriate structural analog.
Importantly, the 2022 price increases did not reverse when energy prices began falling in late 2022 and into 2023. Food-at-home CPI remained well above its pre-shock trend through mid-2024 — roughly 18 months after energy prices peaked. That persistence is the clearest available evidence of the price-stickiness dynamics discussed in this brief.
Figure 3
Food-at-Home CPI During Major Energy-Driven Shocks: Historical Comparisons and 2026 Elasticity-Based Projections
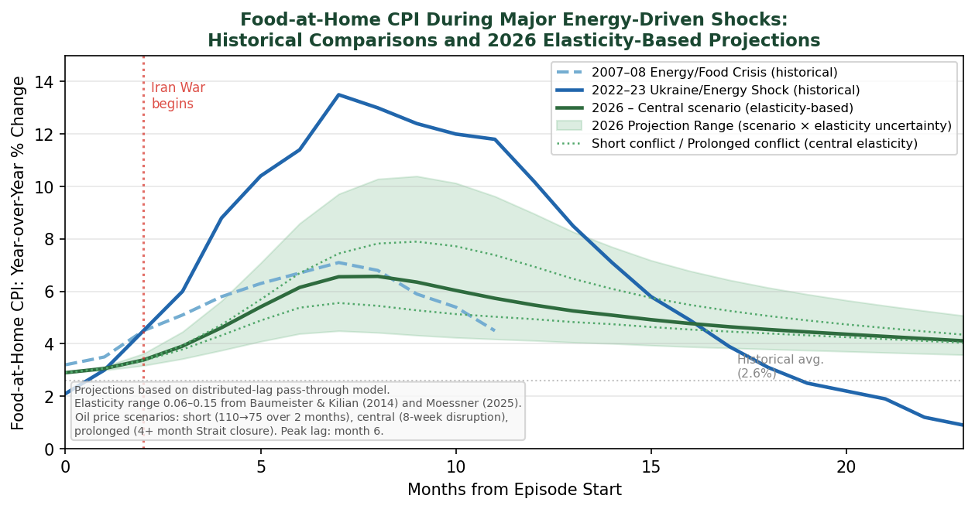
Food-at-home CPI year-over-year percent change during the 2007–08 global food crisis and the 2022–23 Russia-Ukraine shock, with elasticity-based projections for the 2026 Iran conflict. Historical series are from USDA ERS Food Price Outlook and BLS CPI data. The 2026 projections are derived from a distributed-lag pass-through model in which the food CPI effect of the oil price shock is accumulated over a 14-month lag structure peaking at month 6, consistent with the supply chain transmission lags discussed in the text. The central green line represents the central oil price scenario (8-week Strait disruption) at the median transmission elasticity of 0.10, drawn from Baumeister and Kilian (2014). The shaded projection range spans from the low-elasticity/short-conflict scenario (elasticity = 0.06; 4-week disruption) to the high-elasticity/prolonged-conflict scenario (elasticity = 0.15; 4+ month disruption); dotted lines show the short- and prolonged-oil-price paths at the central elasticity. The 2022–23 episode serves as a structural upper bound for the current shock, as it combined the energy-cost channel with a direct grain-supply disruption absent from the Iran conflict. Pre-conflict baseline food CPI: 2.9% year-over-year (January 2026). 2026 values are author projections; see text for methodology. Source for historical data: USDA ERS Food Price Outlook; 2026 projections are author’s estimates.
Who Bears the Burden?
Food price inflation is not experienced equally across the income distribution. Lower-income households in the United States spend a substantially larger share of their income on food — particularly food at home — than higher-income households. For households in the lowest income quintile, food expenditures can represent 25–35 percent of after-tax income. For the highest quintile, the figure is closer to 7–10 percent. A broad food price shock that raises grocery bills 5 percent means a dramatically different welfare impact depending on where in the income distribution a household sits.
The structure of the current shock compounds this distributional concern. Broad energy-driven food inflation, as argued above, closes off the substitution escape that lower-income consumers normally rely on: trading down to cheaper protein, buying private-label or shifting toward lower-cost carbohydrates. When energy costs have pushed up the prices of chicken, rice, bread, and canned beans simultaneously — along with beef, premium brands, and fresh produce — the usual defensive moves are less effective.
A further complication is that food away from home, while accounting for only 5.4 cents of every restaurant dollar in farm share, absorbs very substantial energy-cost pressures through cooking, utilities, and delivery logistics. The 4.0 percent year-over-year increase in food-away-from-home prices already observed in January 2026 reflects cost pressures that predate the Iran conflict; that figure is likely to rise further over the coming months. For lower-income workers who rely on fast food and cafeteria meals as a primary food source, this channel is particularly important.
The Bottom Line: Duration and Stickiness Determine the Outcome
The consumer food price impact of the Iran conflict is genuinely uncertain, but the key parameters that determine the outcome are now identifiable. Duration of the Strait of Hormuz disruption is the single most important variable. A conflict resolved within four to six weeks — with the Strait reopening to commercial shipping before the full pipeline of cost increases reaches retail shelves — may produce food price increases in the range of 1–3 percentage points above the pre-conflict baseline for a quarter or two, fading as supply chains normalize. That would be painful but manageable.
A sustained conflict extending through the spring and summer planting and growing season is a materially different scenario. In that case, the combination of direct energy cost pressure propagating through the supply chain, higher commodity prices from tightened crop supplies, and the biofuel demand premium on vegetable oils could push food-at-home inflation to the 5–7 percent range on an annual basis — elevated, but still well below the 2022 experience because the direct grain supply shock that drove that episode is absent.
In either scenario, the price stickiness dynamics mean the consumer-level burden will persist longer than the conflict itself. Prices that rise in response to a four-week supply shock do not fall four weeks after it ends. Contract structures, menu costs, and the competitive dynamics of food retail all create a natural downward price rigidity. Consumers and policymakers should plan for food price impacts that outlast the geopolitical episode by at least 12 to 18 months.
Three indicators are worth monitoring with particular care. First, the trajectory of crude oil and natural gas prices over the next four to eight weeks — the critical window for whether cost increases propagate into food manufacturing contracts. Second, USDA ERS monthly food price index reports, which will show the leading edge of the transmission by category as it develops. Third, the Producer Price Index (PPI) for processed foods and feeds, which is the intermediate-market signal that precedes retail CPI movements by two to four months and serves as the most reliable early warning indicator of where retail food prices are headed.
The broad message for consumers is this: do not expect dramatic grocery price increases this week or next month — the supply chain lag provides a meaningful buffer. But do not expect the Iran conflict’s energy shock to leave food prices untouched, and do not expect those prices to quickly recede if the conflict extends. The food system’s long supply chains, seasonal commodity stocks, and contractual rigidities mean this is a slow-moving but broad and persistent threat to household food budgets.
[1] The lag values in Figure 2 are hypothetical, reasonable schematic approximations — they were not drawn from any specific source. The chart is a Gantt-style conceptual diagram based on illustrative lag ranges. These are directionally consistent with the price transmission literature cited elsewhere in the brief — particularly Reed et al (2002), Meyer & von Cramon-Taubadel (2004), Peltzman (2000), and Baumeister & Kilian (2014)
References and Data Sources
USDA and Government Data Sources
USDA Economic Research Service. Food Price Outlook: Summary Findings. Monthly updates. https://www.ers.usda.gov/data-products/food-price-outlook/summary-findings
USDA Economic Research Service. Food Dollar Series. Annual input-output analysis of U.S. food supply chain cost distribution. Updated November 2024. https://www.ers.usda.gov/data-products/food-dollar-series
Baker, Q. and Zachary, J. (2023, December). “ERS Food Dollar’s Three Series Show Distributions of U.S. Food Production Costs.” Amber Waves. USDA Economic Research Service. https://www.ers.usda.gov/amber-waves/2023/december/ers-food-dollar-s-three-series-show-distributions-of-u-s-food-production-costs
Zachary, J. (2023). “Farm establishments received nearly a quarter of each food-at-home dollar in 2023.” Charts of Note. USDA Economic Research Service. https://www.ers.usda.gov/data-products/charts-of-note/chart-detail?chartId=110871
Canning, P. (2011). A Revised and Expanded Food Dollar Series: A Better Understanding of Our Food Costs. Economic Research Report No. 114. USDA Economic Research Service. https://ers.usda.gov/sites/default/files/_laserfiche/publications/44825/7758_err114_reportsummary.pdf
S. Bureau of Labor Statistics. Consumer Price Index for All Urban Consumers: Food at Home (CPIFABSL). Federal Reserve Bank of St. Louis FRED Database. https://fred.stlouisfed.org/
S. Bureau of Labor Statistics. Producer Price Index by Industry: Processed Foods and Feeds. FRED Database. https://fred.stlouisfed.org/
Academic Research on Energy-Food Price Transmission
Baumeister, C., and Kilian, L. (2014). “Do oil price increases cause higher food prices?” Economic Policy, 29(80), 691–747. https://doi.org/10.1111/1468-0327.12039
Kilian, L., and Zhou, X. (2023). “A broader perspective on the inflationary effects of energy price shocks.” Energy Economics, 125, 106893. https://www.sciencedirect.com/science/article/abs/pii/S0140988323003912
Kilian, L., and Zhou, X. (2022). “The impact of rising oil prices on U.S. inflation and inflation expectations in 2020–23.” Energy Economics, 113, 106228. https://doi.org/10.1016/j.eneco.2022.106228
Moessner, R. (2025). “Effects of Energy Prices on Food Consumer Price Inflation.” CESifo Working Paper Series No. 11682. https://ideas.repec.org/p/ces/ceswps/_11682.html
Peersman, G., Rüth, S.K., and Van der Veken, W. (2021). “The interplay between oil and food commodity prices: Has it changed over time?” Journal of International Economics, 133. https://users.ugent.be/~gpeersma/gert_files/research/PRV_JIE.pdf
Clark, T.E. (2011). “Food and Energy Price Shocks: What Other Prices Are Affected?” Federal Reserve Bank of Cleveland Economic Commentary, 2011-14. https://www.clevelandfed.org/publications/economic-commentary/2011/ec-201114-food-and-energy-price-shocks-what-other-prices-are-affected
Choi, S., Furceri, D., Loungani, P., Mishra, S., and Poplawski-Ribeiro, M. (2018). “Oil prices and inflation dynamics: Evidence from advanced and developing economies.” Journal of International Money and Finance, 82, 71–96. https://doi.org/10.1016/j.jimonfin.2017.12.004
Baba, C., and Lee, J. (2022). “Second-Round Effects of Oil Price Shocks: Implications for European Monetary Policy.” IMF Working Paper WP/22/173. https://www.imf.org/-/media/Files/Publications/WP/2022/English/wpiea2022173-print-pdf.ashx
Nuefeld, D. (2022). “The Inflation Factor: How rising energy and food prices impact the economy.” Visual Capitalist, World Economic Forum. https://www.weforum.org/stories/2022/09/inflation-rising-food-energy-prices-economy/
Algieri, B., Kornher, L., and von Braun, J. (2025). “The changing drivers of inflation — the case of food: Macroeconomics, speculation, climate change and war.” Structural Change and Economic Dynamics. 75: 782-800. https://doi.org/10.1016/j.strueco.2025.10.006
Price Transmission and Stickiness Literature
Reed, A., Elitzak, H., and Wohlgenant, M. (2002). “Retail-Farm Price Margins and Consumer Product Diversity.” USDA ERS Technical Bulletin No. 1899. https://ers.usda.gov/sites/default/files/_laserfiche/publications/47412/35380_tb1899.pdf
Peltzman, S. (2000). “Prices rise faster than they fall.” Journal of Political Economy, 108(3), 466–502. https://doi.org/10.1086/262126
Meyer, J., and von Cramon-Taubadel, S. (2004). “Asymmetric price transmission: A survey.” Journal of Agricultural Economics, 55(3), 581–611. https://doi.org/10.1111/j.1477-9552.2004.tb00116.x
Current Events and Conflict-Specific Sources
Bussewitz, C., Anderson, M., and Rugaber, C. (2026, March 19). “How the Iran war and surging oil prices are affecting consumers at the gas pump and beyond.” AP/ClickOrlando. https://www.clickorlando.com/business/2026/03/09/how-the-iran-war-and-surging-oil-prices-are-affecting-consumers-at-the-gas-pump-and-beyond/
Brown, C. (2026, March 9). “Iran war oil, gas price shock is likely to spiral economy-wide.” Axios. https://www.axios.com/2026/03/09/oil-prices-gas-iran-war
Center for American Progress. (2026, March 11). “The War in Iran Will Raise Fuel Prices and Costs Throughout the Economy.” https://www.americanprogress.org/article/the-war-in-iran-will-raise-fuel-prices-and-costs-throughout-the-economy/
Sheldon, I. (2026, March 10). “What Does the Iran Conflict Mean Beyond Higher Oil Prices?” Ohio State University Extension. https://farmoffice.osu.edu/blog/tue-03102026-1027am/what-does-iran-conflict-mean-beyond-higher-oil-prices
Hanrahan, R. (2026, March 9). “Prolonged Iran War Could Shrink US Corn Acres, Analysts Say.” Farm Policy News, University of Illinois. https://farmpolicynews.illinois.edu/2026/03/prolonged-iran-war-could-shrink-us-corn-acres-analysts-say/
The Purdue Farm Policy Study Group | Department of Agricultural Economics | Purdue University
![]()
![]()
![]()
![]()
![]()