The Iran Conflict, Energy Prices, and U.S. Farm Profitability: A Balanced Assessment
March 31, 2026
PAEPB-2026-01
Ken Foster, Professor of Agricultural Economics and Director, Purdue Farm Policy Study Group; Bernhard Dalheimer, Assistant Professor of Macroeconomics and Trade
![]()
![]()
![]()
![]()
![]()
Key Takeaways
-The Strait of Hormuz closure has driven crude oil above $110/barrel and nitrogen fertilizer prices up more than 30% — a severe shock arriving at the worst possible time for spring planting.
-However, farmers are not passive. Adjustments in fertilizer application rates and crop mix will moderate yield losses while simultaneously tightening grain supplies and supporting output prices.
-Farmers who pre-purchased or contracted fertilizer before the conflict are largely protected for the 2026 growing season — cost exposure is heavily determined by purchasing timing.
-Historical precedent (notably 2022) shows that sustained energy-driven cost shocks often produce enough commodity price response to preserve, and sometimes improve, net farm income.
-Duration is everything: a short conflict resolved in weeks is likely a manageable cost squeeze; a prolonged Strait closure would eventually push grain prices high enough to partially offset margins.
The Shock: Energy and Fertilizer Costs Under Pressure
The conflict that began on February 28, 2026, with U.S.-Israeli airstrikes on Iran triggered the closure of the Strait of Hormuz — the narrow chokepoint through which approximately 20 percent of the world’s traded oil and significant volumes of liquefied natural gas (LNG) flow. Within days, Brent crude oil surged from roughly $70 per barrel to over $110, the highest level since Russia’s 2022 invasion of Ukraine. Gasoline prices at the pump rose roughly 17 percent in the first two weeks of the conflict, and diesel — the lifeblood of farming operations — followed closely.
For farmers, the more consequential channel may not be diesel fuel but nitrogen fertilizer. Natural gas is the primary feedstock (roughly 70–80 percent of production cost) for urea and anhydrous ammonia via the Haber-Bosch manufacturing process. The Gulf region is a major global supplier of nitrogen fertilizers, ammonia, sulfur, and phosphate; ship owners and insurers have been unwilling to transit the Strait, cutting off those shipments. The result: nitrogen fertilizer prices at the Port of New Orleans jumped from approximately $516 per metric ton before the conflict to $683 per metric ton within a week — a 32 percent increase — with analysts warning prices could go higher if shipments cannot reach U.S. ports before the spring planting window closes.
As StoneX analyst Josh Linville observed: “Literally, this could not happen at a worse time of the year.” Fertilizer is typically 20–30 percent of total corn production costs — far larger than diesel’s roughly 5–10 percent share — making the fertilizer channel the primary financial concern. However, for the time being, there does not appear to be widespread risk of a fertilizer shortage for the current years’ crop in the U.S.
Figure 1
Brent Crude Oil Price Response to Three Geopolitical Shocks EIA Europe Brent Spot Price FOB – actual daily closing prices
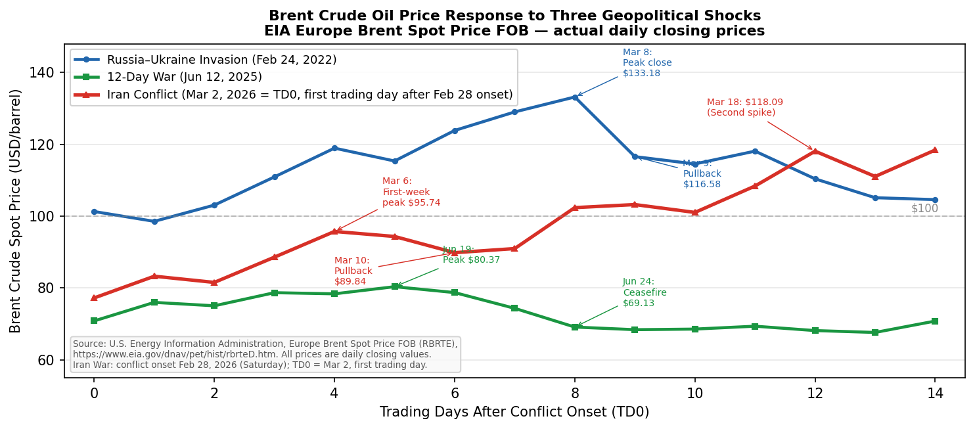
Comparative crude oil price trajectories following major geopolitical shocks, measured in trading days from conflict onset. All three series plot actual daily Brent closing prices from the EIA Europe Brent Spot Price FOB series. The Iran Conflict series runs through TD14 (March 20, 2026) and reveals a W-shaped double-spike pattern: a first-week surge peaking at $95.74/barrel on TD4 (March 6), a partial pullback to $89.84 by TD6 as early hopes for resolution circulated, and a second escalation to $118.09 on TD12 (March 18) and $118.42 on TD14 (March 20) driven by Iran’s strikes on Qatar’s LNG infrastructure and Iraq’s declaration of force majeure. The 12-Day War of June 2025 illustrates a sharply contrasting trajectory: a modest spike peaking at $80.37 by TD5, with rapid reversion following the ceasefire — prices had nearly fully retraced to pre-conflict levels by TD8. The Russia-Ukraine invasion produced the largest and most sustained shock within this window, reaching a closing high of $133.18 on TD8 (March 8, 2022), though that episode combined the energy-cost channel with direct disruption of Ukrainian grain exports — a supply-side amplifier absent from the current conflict. Source: U.S. Energy Information Administration, Europe Brent Spot Price FOB (RBRTE), https://www.eia.gov/dnav/pet/hist/rbrteD.htm. All values are daily closing prices. Prices as of March 23, 2026; situation remains fluid
Figure 2
U.S. Nitrogen Fertilizer (Urea) and Corn Prices, 2018-2026
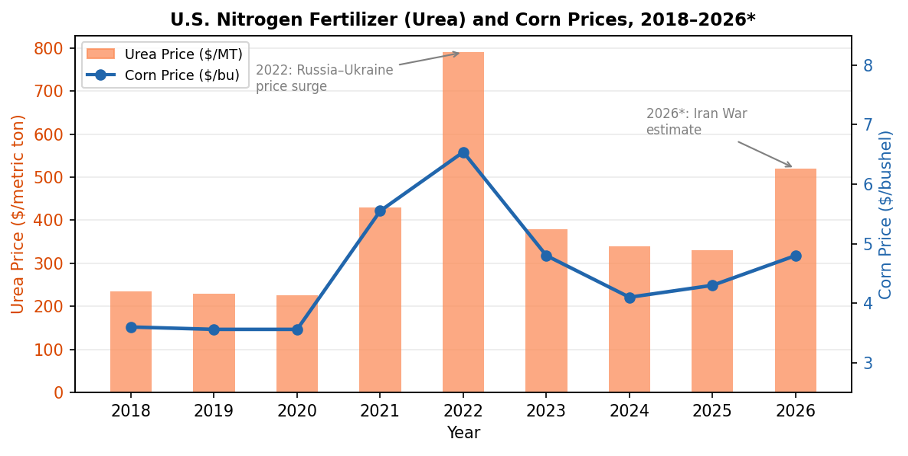
U.S. nitrogen fertilizer (urea) and corn prices, 2018–2026. The 2022 episode demonstrates how energy-driven fertilizer cost spikes can coincide with — and be partially offset by — higher output prices. The 2026 values reflect early post-conflict estimates; the corn price response is still developing. *2026 values are preliminary estimates. The 2026 urea estimate reflects approximately a 30% increase over pre-conflict prices, consistent with observed NOLA spot price moves in the first week of the conflict; the corn price is anchored to December 2026 new-crop futures as of early March 2026.
How Farmers Will Adapt: Two Key Responses
A simple first-order analysis that holds everything else constant — “fertilizer is more expensive, therefore farm income falls” — misses the dynamic responses that farmers make routinely in the face of shifting input-output price ratios. Two responses are especially important and, critically, both partially support output prices at the same time they reduce costs.
Fertilizer Rate Adjustments
Farmers who have not yet purchased fertilizer for the 2026 season face a direct economic incentive to reduce application rates below agronomically optimal levels. When the cost of an additional unit of nitrogen exceeds the value of the marginal yield it produces, the profit-maximizing response is to apply less. This is not irrational — it is precisely how economically rational producers respond to changed price signals. The practical consequence is somewhat lower yields on affected acres, but also materially lower input expenditures per acre, partially preserving margins. The corn fertilizer-to-price ratio — the number of bushels of corn needed to pay for a unit of nitrogen — is currently near historically poor levels, reinforcing this incentive.
Crop Mix Shifts: Corn Acres to Soybeans
Nitrogen-intensive crops, especially corn, become relatively less attractive when nitrogen fertilizer prices spike sharply relative to output prices. Soybeans, which fix their own atmospheric nitrogen, carry a substantial cost advantage when nitrogen prices are elevated. Even before the current conflict, USDA’s February baseline already projected U.S. farmers would plant 4.8 million fewer corn acres (94 million total) and 3.9 million more soybean acres (85 million total) in 2026. The Iran shock amplifies this incentive. Acreage response elasticities for the corn-soybean margin are well-documented in the agricultural economics literature and are typically in the range of 0.2–0.5 with respect to the corn-to-soybean price ratio — meaning meaningful shifts in response to the current relative price signals are to be expected.
Both responses — lower fertilizer use and acreage shifts away from corn — reduce total production relative to what it would otherwise have been. This supply tightening provides upward pressure on commodity prices, partially offsetting the cost shock on the revenue side. In addition, a biofuel demand channel reinforces this: crude oil above $100 per barrel makes crop-based biofuels more economically attractive, elevating demand for corn (ethanol) and vegetable oils (biodiesel, sustainable aviation fuel). Bloomberg reported that soybean oil rose more than 5 percent and palm oil jumped the most since 2022 in the days immediately following the conflict’s onset.
Historical Precedent: What Past Shocks Tell Us
The natural instinct when confronted with a chart showing fertilizer prices up 30 percent and diesel up 17 percent is to project a painful year for farm profitability. But history counsels against that simple conclusion — particularly when the shock is driven by energy markets rather than direct disruptions to grain production.
Russia’s Invasion of Ukraine, 2022
The 2022 episode is the most instructive recent precedent. Fertilizer prices roughly doubled from 2021 to 2022 as natural gas prices surged globally. Diesel costs rose sharply. Yet U.S. net farm income reached approximately $160 billion — a near-record — because corn and soybean prices surged in parallel, driven by the simultaneous loss of Ukraine’s grain and oilseed exports from world markets. The revenue response more than offset the cost shock for most producers. Farmers who had forward-contracted grain at pre-invasion prices left money on the table; those with open positions benefited.
The key structural distinction in 2026 is that Iran is not a major grain producer. The current shock removes energy and fertilizer supply from world markets, but it does not directly subtract grain or oilseed production. The commodity price support must come indirectly — through the biofuel channel, through acreage response, and through global food security concerns prompting precautionary buying — rather than from the direct supply shock that powered the 2022 commodity rally. This makes the output price response somewhat less certain and potentially more modest than in 2022.
The 12-Day War, June 2025
A more recent comparison is instructive precisely because it represents the optimistic scenario. The June 2025 conflict produced roughly a 10 percent spike in crude oil prices that reversed itself as the hostilities ended within two weeks. Farm input costs barely moved, crop markets absorbed the signal with equanimity, and the episode had essentially no measurable impact on 2025 farm profitability. If the current conflict is resolved comparably quickly, the energy and fertilizer price effects may prove similarly fleeting, particularly because many U.S. farmers will have already locked in input purchases for the coming crop year.
As can be seen in Figure 1, the current pattern is emerging differently from the comparisons. Whereas oil prices settled back to pre-conflict levels rather quickly in the historical cases, the added risk of supply constraints through the Straight of Hormuz appears to be holding crude oil prices well above pre-conflict levels. Whether they decline to pre-conflict levels depends on how quickly the conflict is resolved and the degree to which that resolution eliminates risk of further supply chain disruption.
Who Is Protected, and Who Faces Exposure?
One of the most important practical realities of this situation is that the cost impact is not uniformly distributed across the farm sector. The timing of input purchasing decisions — made months ago, in many cases — is a primary determinant of cost exposure this crop year.
-Farmers who contracted anhydrous ammonia or urea in fall 2025 or early winter 2026, when prices were in the $330–$380/MT range, face essentially no direct fertilizer cost increase from this conflict for the 2026 season. Their cost structure is mostly locked in.
-Farmers who delayed fertilizer purchases — whether by choice, cash-flow constraints, or logistical circumstances — potentially face the full brunt of the current price spike and must decide whether to proceed at current prices, reduce rates, or shift acres to soybeans.
-Corn-heavy cash grain operations carry the greatest vulnerability, given both higher nitrogen intensity and greater dependence on corn prices recovering to offset costs.
-Operations with existing crop insurance coverage at pre-conflict revenue guarantees have some downside protection on the revenue side, though this does not directly offset input cost increases.
-Livestock producers face a more complex picture: higher feed grain input costs weigh on margins.
Figure 3
U.S. net farm income, 2010–2026
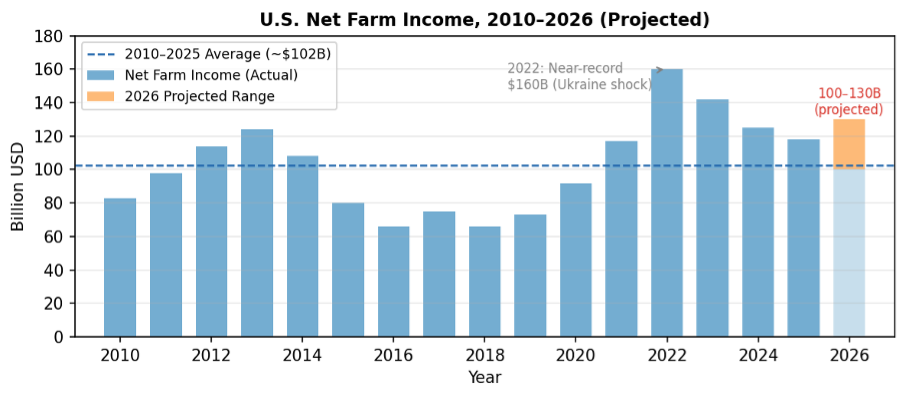
U.S. net farm income, 2010–2026. The 2022 Russia-Ukraine shock produced near-record farm income of $160 billion as commodity price gains exceeded input cost increases. The 2026 projection range of $100–$130 billion reflects significant uncertainty; resolution of the conflict and the degree of commodity price response are the key determinants. *2025–2026 values are estimates/projections.
The Bottom Line: A Nuanced Outlook
The honest answer to “what does this mean for farm profitability?” is: it depends heavily on three things — how long the conflict and Strait closure last, how much commodity prices respond to tightened supply, and when individual farmers purchased their inputs.
A simple cost-accounting exercise says this is bad: fertilizer up 30 percent, diesel up 17 percent, farm income down. But that framing ignores the output-price response that has historically accompanied energy-driven agricultural input shocks, and it ignores the adaptive capacity of producers. The full equilibrium picture is considerably more nuanced.
If the conflict is resolved within four to six weeks and the Strait reopens to commercial shipping, fertilizer and fuel prices will likely retrace a significant portion of their gains, and the 2026 growing season may conclude with results not far from pre-conflict expectations. Many farmers will have incurred little if any additional cost due to pre-purchased inputs. The shock, while jarring in financial press coverage, will have passed before it fully propagates into farm-level economics.
If the conflict extends through summer — the more concerning scenario — the economics shift materially. Fertilizer shortages during the spring application window could genuinely constrain yields. Commodity markets would likely respond with sustained price increases. The parallel to 2022 becomes more apt: higher costs, but also higher output prices, with the net effect on profitability depending on the relative magnitudes and individual farm characteristics. In that scenario, history suggests the outcome for U.S. agriculture is painful in the short run but not catastrophic, and potentially supportive of farm income over the full marketing year.
What is clear is that the agricultural community should monitor three data points with particular care over the coming weeks: the USDA Prospective Plantings report due March 31 (the first survey-based reading of how farmers are actually adjusting acreage), the trajectory of crude oil prices (the $70–80 range flagged by analysts as the threshold for manageable macroeconomic impact), and the reopening status of the Strait of Hormuz to commercial tanker traffic. Those three signals will do more than any model to determine the ultimate farm income impact of the 2026 Iran conflict.
References and Data Sources
Current Events and News Sources
Associated Press / PBS NewsHour. (2026, March 10). “War with Iran delivers high oil prices and another shock to the global economy.” https://www.pbs.org/newshour/world/war-with-iran-delivers-high-oil-prices-and-another-shock-to-the-global-economy
Center for American Progress. (2026, March 11). “The War in Iran Will Raise Fuel Prices and Costs Throughout the Economy.” https://www.americanprogress.org/article/the-war-in-iran-will-raise-fuel-prices-and-costs-throughout-the-economy/
Hanrahan, R. (2026, March 9). “Prolonged Iran War Could Shrink US Corn Acres, Analysts Say.” Farm Policy News (University of Illinois). https://farmpolicynews.illinois.edu/2026/03/prolonged-iran-war-could-shrink-us-corn-acres-analysts-say/
Gu, H. Listiyorini, E., and Kozlov, P. (2026, March 9). “Crop Prices Jump as War Snarls Trade and Risks Tightening Supply.” Bloomberg News. https://www.bloomberg.com/news/articles/2026-03-09/chicago-soy-oil-jumps-4-as-crude-s-rally-boosts-biofuel-demand
White, E. (2026, March 13). “Iran war deprives US farmers of affordable fertilizer as spring planting looms.” Reuters. https://www.reuters.com/business/iran-war-deprives-us-farmers-affordable-fertilizer-spring-planting-looms-2026-03-13/
McMillan, D. (2026, March 10). “War in Iran sends farmer’s fuel, fertilizer costs soaring.” The Western Producer. https://www.producer.com/markets/war-in-iran-sends-farmers-fuel-fertilizer-costs-soaring/
(2026). “Economic impact of the 2026 Iran war.” https://en.wikipedia.org/wiki/Economic_impact_of_the_2026_Iran_war
USDA and Government Data Sources
USDA Economic Research Service. Farm Income and Wealth Statistics. Annual net farm income estimates. https://www.ers.usda.gov/topics/farm-economy/farm-sector-income-finances/
USDA Economic Research Service. (2026, February). USDA Agricultural Projections to 2035. Baseline corn and soybean acreage projections. https://ers.usda.gov/sites/default/files/_laserfiche/outlooks/113817/OCE-2026-1.pdf?v=39134
USDA Economic Research Service. Cost of Production accounts (ARMS). Per-acre input cost breakdowns by commodity. https://www.ers.usda.gov/data-products/commodity-costs-and-returns
USDA National Agricultural Statistics Service. (2026, March 31 forthcoming). Prospective Plantings Report. https://www.nass.usda.gov/
Federal Reserve Bank of St. Louis (FRED). Crude Oil Prices: West Texas Intermediate (WTI); Producer Price Index: Nitrogenous Fertilizer Manufacturing; Consumer Price Index: Food at Home. https://fred.stlouisfed.org/
Academic and Extension Research
Goodwin, B. K., and Mishra, A. K. (2006). “Are ‘decoupled’ farm program payments really decoupled? An empirical evaluation.” American Journal of Agricultural Economics, 88(1), 73–89. https://doi.org/10.1111/j.1467-8276.2006.00839.x
Tyner, W. E. (2010). “The integration of energy and agricultural markets.” Agricultural Economics, 41(S1), 193–201. https://doi.org/10.1111/j.1574-0862.2010.00500.x
Tyner, W. E., and Taheripour, F. (2008). “Policy options for integrated energy and agricultural markets.” Review of Agricultural Economics, 30(3), 387–396. DOI:10.1111/j.1467-9353.2008.00412.x
University of Illinois farmdoc. Crop enterprise budgets and fertilizer cost sensitivity analyses. https://farmdoc.illinois.edu/
Purdue University Center for Commercial Agriculture. Crop budgets and break-even analysis. https://ag.purdue.edu/commercialag/home/
Food and Agricultural Policy Research Institute (FAPRI), University of Missouri. U.S. Baseline Briefing Book: Projections for Agricultural and Biofuel Markets. Annual. https://www.fapri.missouri.edu/
Iowa State University Extension and Outreach. Estimated Costs of Crop Production in Iowa. Annual. https://www.extension.iastate.edu/agdm/crops/html/a1-20.html
Historical Comparisons
Glauber, J., and Laborde, D. (2022). “How Russia’s invasion of Ukraine is affecting commodity markets and food security.” IFPRI Blog, March 9, 2022. https://www.ifpri.org/blog/how-russias-invasion-ukraine-affecting-commodity-markets-and-food-security
Westhoff, P., Whistance, J., Cooper, J., and Meyer, S. (2022). “Impacts of Russia’s Invasion of Ukraine on U.S. Agriculture.”Choices, 38(2). https://www.choicesmagazine.org/UserFiles/file/cmsarticle_862.pdf
Saccone, D., and Vallino, E. (2025). “Global food security in a turbulent world: reviewing the impacts of the pandemic, the war and climate change.” Agricultural and Food Economics, 13(47). https://link.springer.com/article/10.1186/s40100-025-00388-0
The Purdue Farm Policy Study Group | Department of Agricultural Economics | Purdue University
![]()
![]()
![]()
![]()
![]()