The May 2026 CPI and PPI Reports: The Food Price Pipeline Is Loading at Record Rates
June 12, 2026
PAERPB-2026-10
Ken Foster, Professor of Agricultural Economics and Director, Purdue Farm Policy Study Group; Bernhard Dalheimer, Assistant Professor of Macroeconomics and Trade
![]()
![]()
![]()
![]()
![]()
Key Takeaways
-
- – May all-items CPI rose 0.5% for the month and 4.2% over 12 months — the highest annual rate since April 2023. Energy accounted for more than 60% of the monthly increase; gasoline rose 7.0% at the consumer level and is up 40.5% year-over-year.
- – Food-at-home rose only 0.1% in May, decelerating from April’s 0.7%. This is softer than the central scenario projected — but the BLS collection window closes approximately May 18, placing most of the 3-to-6-month transmission lag outside the measurement period.
- – The PPI pricing date is May 13. Both CPI and PPI measure conditions in the first half of May. Any oil price movements in the final two weeks of May — including any ceasefire-related moderation — are not captured. Even if captured, the downstream transmission to chemicals, resins, and logistics would itself take additional months.
- – The domestically produced farm food index was unchanged for the month (0.0%). This is the clearest single-number confirmation that farm-level commodity costs are not driving retail food prices.
- – CPI energy is not retreating. Gasoline rose 7.0% in May after 5.4% in April. The PPI confirms the same: final demand energy rose 10.7% for the month; diesel is up 105.9% over 12 months.
- – May PPI final demand goods rose 2.8% — the largest monthly increase since BLS began these calculations in December 2009. The 12-month final demand PPI reached 6.5%, the highest since November 2022.
- – The PPI production flow gradient confirms the pipeline is advancing at record rates: Stage 1 (most upstream) rose 3.2% — also a record since December 2009 — while Stage 4 (inputs to food retail and service producers) rose 1.1%. The gap is cost pressure that is loaded but not yet discharged to retail.
- – Plastic resins rose 14.0% for the month; industrial chemicals rose 7.6%. These packaging and processing inputs are 2–4 months from retail food prices and are accelerating, not moderating.
- – Processed foods and feeds for intermediate demand rose 0.7%, exceeding the 0.5% threshold set in Brief #2026-8. The food supply chain has begun to transmit cost increases. June CPI (July 14) is the first clean full-month test.
Two Data Releases, One Coherent Story
The Bureau of Labor Statistics (BLS) released two major price indexes on consecutive days this week: the Consumer Price Index (CPI) for May 2026 on June 10, and the Producer Price Index (PPI) for May 2026 on June 11. Read separately, each tells a partial story. Read together, they deliver the most complete picture yet of where the Iran Conflict’s cost wave is in the food supply chain — and what is coming.
The CPI says: quiet at the shelf. Food-at-home prices rose only 0.1 percent in May, and the domestically produced farm food index was flat. These readings are consistent with what three months of supply chain lag economics would predict: costs accumulating upstream have not yet cleared the wholesale-to-retail transmission threshold at scale.
The PPI says: loading at record rates upstream. Final demand goods posted their largest monthly increase since the BLS began calculating the series in December 2009. The most upstream stage of intermediate demand hit a record monthly advance. Plastic resins surged 14.0 percent. Diesel is up 105.9 percent over the prior year. The pipeline is not moderating — it is intensifying.
The gap between these two readings is not a contradiction. It is the lag structure, and it is closing.
A Critical Timing Caveat: What Both Reports Can and Cannot Tell Us
| Methodology Note — Collection Dates
The CPI prices are collected during approximately the first 18 days of each calendar month, making the May CPI reflect conditions roughly between May 1 and 18. The PPI pricing date is the Tuesday of the week containing the 13th — May 13, 2026, for the May release. Both indices, therefore, measure conditions in the first half of May; any oil price movements in the final two weeks of the month are not captured in either release. |
The timing of both releases is analytically important in the same direction: both capture conditions in the first half of May, approximately 11 weeks after the conflict began on February 28. The supply chain lag for most retail food categories runs 3 to 6 months; the 3-month threshold falls in late May, mostly after both collection windows close. The 4-to-6-month window falls in June through August — entirely absent from either May release.
A second timing consideration applies specifically to the PPI and the ceasefire question. The PPI pricing date is May 13. Even if crude petroleum prices moderated in the final two weeks of May — whether reflecting early diplomatic signals or market positioning — that moderation would not appear in the May PPI. More fundamentally, any moderation in crude oil would take additional time to transmit downstream through petroleum refining, industrial chemical manufacturing, plastic resin production, and logistics contracts. The downstream pipeline effects of a crude oil price change are themselves lagged from the upstream crude price movement. The May PPI data are not the ceiling of what the pipeline will deliver; they are a snapshot of conditions on May 13.
The CPI: The Food Pipeline — Quiet at Retail, Consistent with the Framework
Food-at-home rose 0.1 percent in May after the 0.7 percent surge in April. The all-items CPI rose 0.5 percent for the month and 4.2 percent over the prior 12 months — the highest annual rate since April 2023 — driven primarily by energy, which accounted for more than 60 percent of the monthly increase.
The soft May grocery reading is consistent with the pipeline transmission model. April’s 0.7 percent reflected pre-conflict cost clearance — tariff pass-through, drought-driven beef dynamics, and avian influenza base effects. Those pressures do not repeat in May. The conflict-era cost wave — diesel, packaging, processing — is loaded in the system and advancing through the supply chain, but has not yet cleared the retail threshold in force. That arrival is expected in the June–August window. The first full test will be the June CPI, released July 14.
Figure 1 illustrates the monthly food-at-home trajectory since December 2025. The color coding distinguishes pre-conflict months from the post-onset collection windows and highlights April’s clearance event against May’s softer reading.
Figure 1
Food-at-Home CPI: Monthly Seasonally Adjusted % Change, December 2025 – May 2026
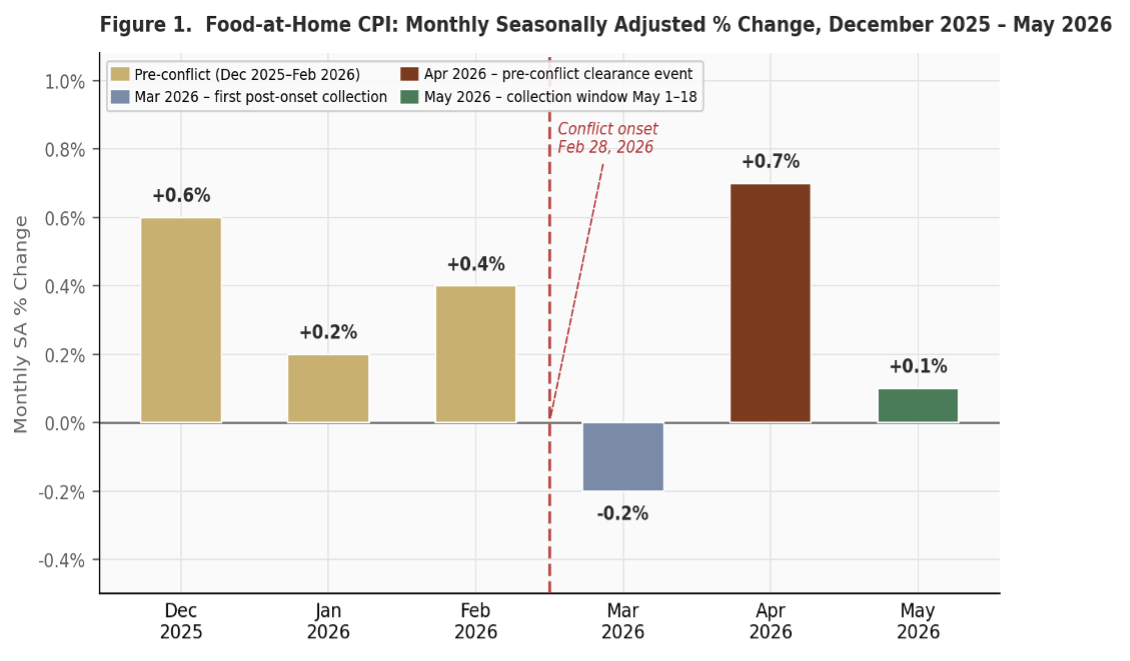
The vertical dashed line indicates the onset of the conflict (February 28, 2026). The BLS CPI collection window for May closes approximately May 18; the PPI pricing date is May 13. Both releases, therefore, measure conditions in the first half of May. Source: U.S. Bureau of Labor Statistics, Consumer Price Index — May 2026 (USDL-26-0824, released June 10, 2026), Table A.
The Farm Food Index: The Clearest Confirmation
The BLS special aggregate for domestically produced farm food recorded 0.0 percent for the month and +2.2 percent over the prior 12 months. This index is the most direct measure of whether farm-level commodity costs are transmitting to retail food prices — and in May, they are not.
The farm share of the consumer food dollar is approximately 16 cents in aggregate (24 cents for grocery store food). A 20 percent increase in farm commodity costs would add, at most, 4 to 5 cents per grocery dollar. The 0.0 percent monthly farm food reading confirms that the current 2.7 percent 12-month food-at-home reading is coming entirely from the marketing system — logistics, processing, packaging — not the farm gate. For farms, the story is about 2027, not 2026: many commercial-scale farmers pre-contracted or pre-applied their 2026 inputs before the conflict began, and Iran is not a grain exporter, so commodity supplies remain relatively unaffected. The 2027 planting cycle, when operators must repurchase inputs at current prices, is where the conflict’s farm income effect will be most acute.
Energy: Still Advancing — The PPI Confirms No Moderation
Gasoline rose 7.0 percent for the month in May’s CPI after 5.4 percent in April, and is now 40.5 percent above its year-ago level. Fuel oil is up 58.9 percent 12-month. Energy accounted for over 60 percent of the monthly all-items CPI increase.
The May PPI confirms that there is no relief at the producer level. Final demand energy rose 10.7 percent for the month. No. 2 diesel fuel — the transportation fuel that moves every food product in the supply chain — rose 15.7 percent in May and is now 105.9 percent above its year-ago level. Jet fuel rose 22.5 percent for the month, 174.5 percent 12-month. Gasoline at the producer level rose 23.4 percent for the month. These are the input prices that food manufacturers, distributors, and retailers are paying on contracts repriced in and after May 2026. The CPI energy data and PPI energy data are fully consistent: the level shock is not moderating at any stage of the supply chain.
Figure 2 shows the composition of monthly all-items CPI contributions across March, April, and May. Energy has remained the dominant contributor in all three months. Food’s contribution rose modestly in April (the clearance event) and is again very small in May. The “Other Core” component rose slightly in May, consistent with the early broadening of cost pressure into manufactured goods that the PPI data confirms at the upstream level.
Figure 2
Contributions to Monthly All-Items CPI Change, March – May 2026 (percentage points)
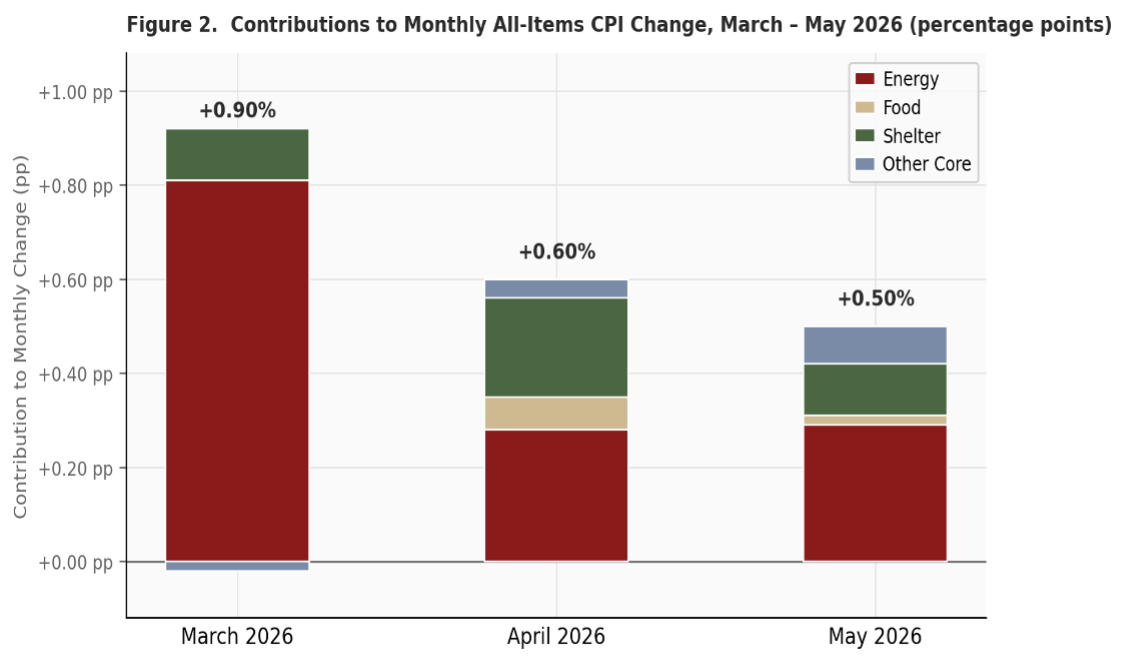
Energy, Food, Shelter, and Other Core components shown as stacked bars. Total monthly change shown above each bar. March and April contributions estimated from published monthly percent changes (Table A) and relative importance weights (Table 1, April 2026); May contributions are BLS-computed values from Table 6 of the CPI release. Source: U.S. Bureau of Labor Statistics, Consumer Price Index — May 2026 (released June 10, 2026).
The PPI: A Record Loading Rate
The May 2026 Producer Price Index contains the most analytically important new information in the combined two-day data release. The index for final demand goods rose 2.8 percent for the month — the largest single-month advance since BLS began calculating these data in December 2009. The overall final demand PPI rose 1.1 percent for the month and 6.5 percent over the prior 12 months, the highest annual rate since November 2022. Final demand less foods, energy, and trade services — the PPI’s closest analog to core inflation — rose 0.8 percent, its largest advance since March 2022. These are not moderate readings from a gradually building pressure. They are exceptional readings against historical benchmarks.
Approximately 80 percent of the May final demand goods advance traces to a 10.7 percent jump in final demand energy. But the energy component alone does not capture the full breadth of the shock. Final demand goods, excluding foods and energy, also rose 0.8 percent — consistent with broad cost pressure advancing toward retail across multiple categories.
The production flow section of the PPI — which tracks price changes across four stages of the supply chain, from the most upstream (Stage 1) to inputs that feed directly into final-demand industries (Stage 4) — provides the most direct test of the pipeline transmission framework. Figure 3 presents the results for March, April, and May.
Figure 3
PPI Intermediate Demand by Production Flow: Monthly Seasonally Adjusted Percent Change, March–May 2026
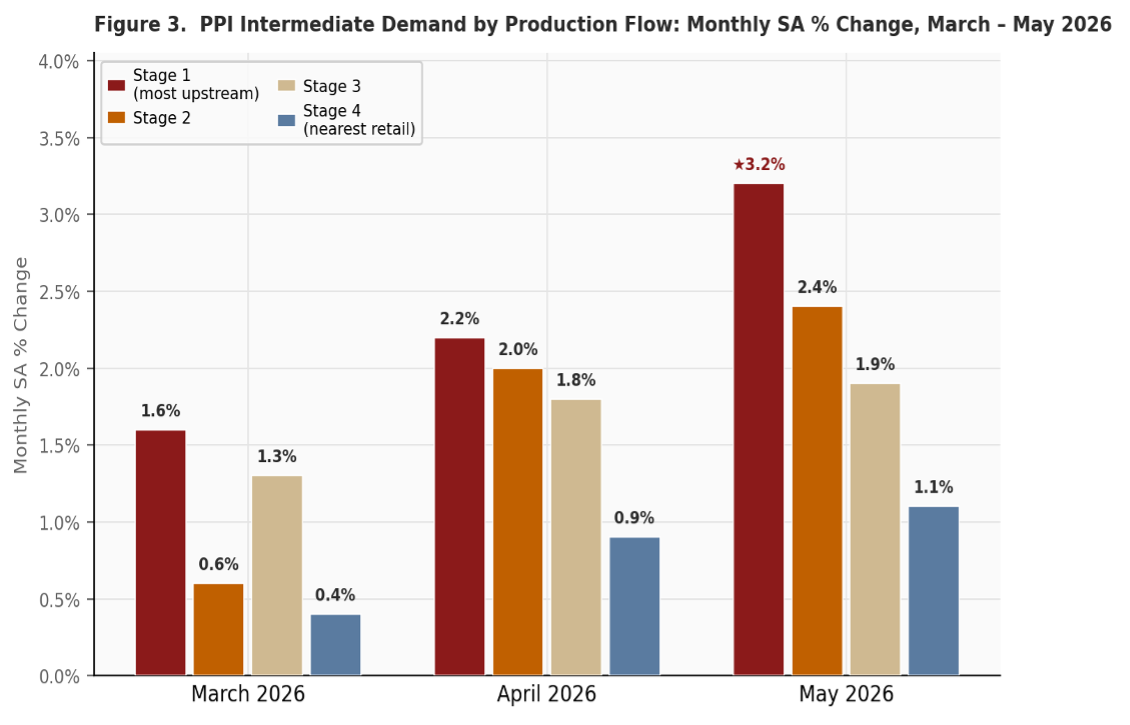
Stage 1 = most upstream industries (oil and gas extraction, paper mills, grain farming); Stage 2 = petroleum refining, electricity generation, plastic resin manufacturing; Stage 3 = animal slaughtering and processing, semiconductor manufacturing, wholesale trade; Stage 4 = industries whose output primarily serves final demand, including food retail and food service. ★ = largest monthly increase since BLS began calculating these data in December 2009. Source: U.S. Bureau of Labor Statistics, Producer Price Index — May 2026 (USDL-26-0826, released June 11, 2026), Table D and Table 1.
The gradient visible in Figure 3 is the precise pattern that the pipeline transmission model predicts: cost increases are largest at the most upstream stage and diminish progressively as they move toward retail, reflecting the absorption capacity and contract lags at each successive stage. In May, Stage 1 rose 3.2 percent — a record since these data were first calculated — while Stage 4 rose 1.1 percent. The gap between Stage 1 and Stage 4 represents cost pressure that is loaded in the pipeline but has not yet reached final demand prices. With each passing month, more of that upstream loading converts to downstream prices. The 12-month readings confirm the pattern is not temporary: Stage 1 is up 12.3 percent, Stage 2 up 12.5 percent, Stage 3 up 7.2 percent, and Stage 4 up 6.5 percent over the prior year — each the largest 12-month advance in at least three to four years.
One nuance in the March data is worth noting: Stage 2 (0.6 percent) was lower than Stage 3 (1.3 percent) in March, a departure from the clean gradient seen in April and May. This reflects the initial volatility of the shock — Stage 3 includes animal slaughtering and wholesale trade, which faced immediate price pressure from conflict-related logistics disruption, while Stage 2 (petroleum refining and plastic resin manufacturing) takes longer to convert crude oil price increases into refined product prices. By April and May, the gradient has normalized into the classic forward-flow pattern.
Two intermediate commodity readings deserve extended attention for their direct implications for retail grocery prices.
Plastic resins and materials rose 14.0 percent in May. This is not a continuation of modest pressure — it is a step-change acceleration from 5.7 percent in April, 1.2 percent in March, and essentially zero in January–February. Plastic resins are the feedstock for virtually every food package: bottles, trays, films, containers, bags. Food manufacturers that purchase these inputs on quarterly or semi-annual supply contracts will face dramatically higher costs when those contracts reprice in the June–August window. These repriced input costs will then flow to wholesale food prices and subsequently to retail shelves over the following one to three months.
Industrial chemicals rose 7.6 percent for the month (16.1 percent 12-month); basic organic chemicals rose 9.0 percent (18.2 percent 12-month). These feedstocks supply food preservation agents, cleaning and sanitizing compounds used throughout food manufacturing, packaging adhesives, and processing aids. The chemical cost chain — from crude oil through basic organics to industrial chemicals to food manufacturer inputs — is in acute acceleration at every stage. Containers for intermediate demand rose 1.8 percent for the month.
Freight logistics costs are already embedded, not pending. Truck transportation of freight rose 3.4 percent in May and is now 17.3 percent above its year-ago level. Final demand transportation and warehousing services are up 14.2 percent 12-month and 2.6 percent for the month. These costs are being paid today by every food manufacturer, distributor, and retailer. The fact that food-at-home CPI rose only 0.1 percent in May, despite these embedded logistics costs, indicates that retail margin compression is currently active — absorbing cost increases rather than passing them through. Retail margins have limits, and the arithmetic of those limits will govern the pace of food price pass-through over the coming months.
The PPI data also confirm a finding critical to the two-stage model: food manufacturers’ output prices have not yet moved in proportion to their input costs. Despite diesel at 105.9 percent above year-ago levels, plastic resins at 19.5 percent, and industrial chemicals at 16.1 percent, finished consumer foods at the producer level rose only 0.4 percent for the month, and processed foods and feeds for intermediate demand rose 0.7 percent. Manufacturers are absorbing. This is exactly what the 3- to 6-month transmission lag predicts: input cost loading precedes output price adjustment. The 0.7 percent intermediate food reading has crossed the 0.5 percent threshold identified in Brief #2026-8 as the pipeline confirmation signal — the transmission has started. The pace will accelerate as margin compression reaches its limits and as contract cycles reprice.
On fertilizer, the PPI confirms the 2027 reckoning thesis. Nitrogenates rose 6.1 percent for the month and are now 39.9 percent above year-ago levels. Phosphates rose 2.1 percent (16.8 percent 12-month). Agricultural chemicals broadly are up 12.3 percent over the past year. Farmers who must purchase inputs for the 2027 crop at current prices — without the insulation of pre-conflict contracting — will face an input cost structure materially more adverse than 2026.
Reading the two releases together: the CPI shows that the conflict’s cost wave has not yet reached retail grocery shelves at scale. The PPI shows that the wave is building in the upstream pipeline. The gap between what the PPI is loading and what the CPI has delivered to consumers is the measure of what is coming.
CPI Category-Level Dynamics: Non-Conflict Narratives Persist
The category-level CPI data continue to support the two-force model: much of current food price inflation reflects pre-conflict supply and policy dynamics, and the conflict’s energy-cost channel has not yet arrived at retail in full force.
Beef (+12.9% 12-month). The multi-year drought-driven contraction in the U.S. cattle herd and import tariffs that constrain foreign supply remain the primary drivers. The monthly decline in May (-1.6%) is a normal seasonal and inventory variation. Independent of the conflict.
Coffee (+17.5% 12-month). Brazilian Arabica supply constraints from adverse weather, compounded by tariff pass-through on imports. Beverage materials broadly are up 10.8% 12-month—non-conflict primary drivers.
Fresh vegetables (+11.9% 12-month). Tomatoes remain elevated (+32.0% 12-month, with May monthly moderating to -6.1% as seasonal supply recovers), consistent with the U.S. withdrawal from the Tomato Suspension Agreement in July 2025.
Fats and oils (-3.4% 12-month, -2.4% monthly). The continued decline reflects expanded biodiesel crushing generating soybean meal as a co-product, reducing feed costs and tempering vegetable oil prices at retail. Dairy is similarly deflationary (-1.0% 12-month), with cheese falling 2.9% in May.
Eggs (+4.0% monthly, -35.2% 12-month). The monthly increase is the avian influenza base effect unwinding as flock recovery proceeds. This base effect will continue unwinding through 2026, pushing the 12-month meats reading higher regardless of the conflict.
Core Inflation: Second-Round Dynamics Remain Contained — But Watch
Core CPI — all items less food and energy — rose 0.2 percent for the month and 2.9 percent over the prior 12 months. Second-round inflation dynamics have not yet materialized in force at the consumer level. Transportation services fell 0.6 percent for the month, with motor vehicle insurance declining 1.7 percent.
The PPI, however, introduces a caution. Final demand less foods, energy, and trade services — the producer-level core analog — rose 0.8 percent, its largest advance since March 2022. This is 0.6 percentage points above the CPI core reading for the same month. A persistent and widening gap between producer and consumer core prices is the historical leading indicator of impending consumer core acceleration. The current spread is consistent with compressed margins at the wholesale and retail stages. If that compression persists through June and July, the risk of broadening CPI core acceleration rises. June CPI will be the first data point for evaluating this trajectory.
Three Indicators to Watch
| July 14
June CPI Release First full-month clean test of the food acceleration window. June captures prices set across the full month — more than four months post-conflict. Food-at-home above 0.5% monthly would confirm the central scenario is on track. |
July 15
June PPI Release Will show whether plastic resins and industrial chemicals continue accelerating, stall, or reflect any moderation from partial ceasefire effects. Processed foods and feeds threshold: watch for continued advance above 0.5% monthly. |
Ongoing
Strait of Hormuz Status Duration of disruption remains the single most important variable. Every month of continued restriction adds to the pipeline load; a durable resolution would reduce the ultimate food inflation footprint but would not unload costs already embedded in logistics and packaging contracts. |
The Bottom Line
The May 2026 CPI and PPI data, read together, tell a coherent and analytically arresting story: quiet at the shelf, loading at record rates upstream. The CPI’s soft grocery reading — food-at-home up 0.1 percent — reflects conditions on May 1–18, before the 3-to-6-month transmission lag has run its course. The PPI’s record readings — final demand goods at the largest monthly advance since 2009, Stage 1 intermediate demand also at a record, plastic resins up 14.0 percent for the month — describe what the pipeline is loading on May 13 and what will flow toward grocery shelves in the June–August window. The farm food index at 0.0 percent confirms the central argument of this brief series: farm supply costs are not the food price story. Logistics, packaging, and processing costs are. Those costs are now advancing through the pipeline at historically unusual rates. The processed foods and feeds threshold has been crossed. The brief series projected 3 to 6 percentage points of added food-at-home inflation over 12 to 18 months in a sustained conflict scenario; the combined CPI and PPI data are becoming more consistent with the upper portion of that range, not the lower, as the conflict persists. June CPI, released July 14, will be the first full-month test.
Data Sources and Related Briefs
U.S. Bureau of Labor Statistics. Consumer Price Index — May 2026. USDL-26-0824. Released June 10, 2026.
U.S. Bureau of Labor Statistics. Producer Price Index — May 2026. USDL-26-0826. Released June 11, 2026.
Earlier briefs in this series: Foster & Dalheimer (2026), All available at ag.purdue.edu/commercialag.
![]()
![]()
![]()
![]()
![]()