What should we expect from the Farm Bill’s SNAP debate?
April 20, 2023
PAER-2023-16
Roman Keeney, Associate Professor of Agricultural Economics
The release of the CBO’s budget outlook in February provided a first draft of the 2023 Farm Bill baseline. The nutrition title has long been dominant in farm bill spending. CBO anticipates spending on the Supplemental Nutrition Assistance Program (SNAP) to push past 80% of farm bill spending, with the nutrition title representing $120 billion of $140 billion per year forecast cost.
A previous brief in this series outlined the CBO outlook numbers and causes of nutrition’s surging costs. Contemporary reporting and legislative press releases have pointed squarely to the growth in SNAP as a point of critical conflict that could jeopardize timely reauthorization of the farm bill. In this brief we narrow our focus to SNAP design issues expected to feature in this year’s farm bill debate.
Background
- Block grant operation
- Limiting food options in SNAP
- Limiting retailer participation
- Adequacy of SNAP benefits
- Program participation
- Work requirements
The 2018 Farm Bill debate incorporated the last three of these items in earnest as part of efforts to control program costs by more narrowly targeting recipients. Ultimately, Congress passed the farm bill with a nutrition title resembling the status quo relegating potential reforms to executive action. Beginning in 2019, the Trump administration’s Department of Agriculture proposed rules limiting the flexibility of states to waive certain SNAP enrollment criteria for designated recipients or areas. While the first reform actions were slated to begin in April 2020, the process was sidelined by emergency COVID legislation that expanded the SNAP program with extra benefits and fewer restrictions for the duration of the National Public Health Emergency.
When political leadership at the USDA changed in January 2021 the approach to SNAP changed. New executive action from the Biden administration in 2022 called for an expedited update to the program permanently increasing SNAP benefits. This update to a cost index called the Thrifty Food Plan (TFP) increased the average SNAP benefit by more than 20%. The collection of policy changes and economic conditions have yielded a SNAP program that is nearly 80% larger in cost than when the 2018 Farm Bill was passed creating a political flashpoint for the farm bill debate.
SNAP and the Budget
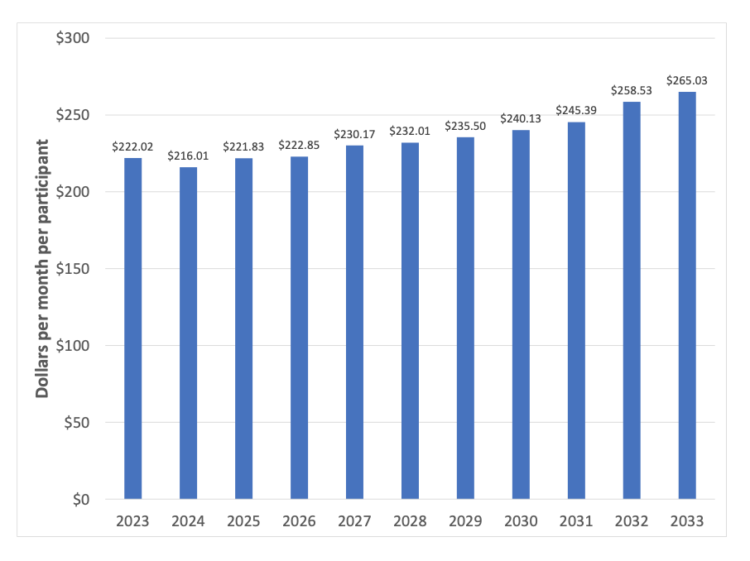
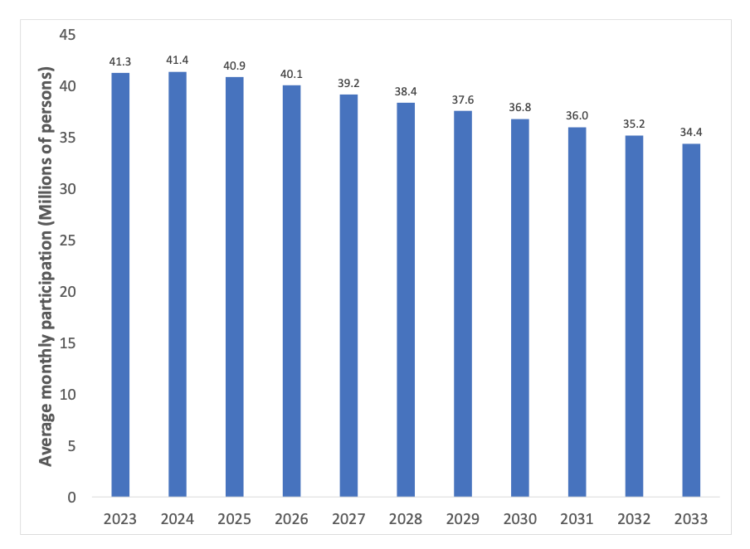
The CBO outlook published data on expected monthly participation level and average benefit per person. Both adjust according to macroeconomic factors such as unemployment, wages, inflation, and GDP growth. We have discussed the baseline process in a previous brief. It’s important to remember that a ten-year economic outlook is very uncertain, and we should expect near term estimates to reflect recent economic fluctuations. These disappear as the forecast transitions toward longer run trends. This can be seen in figures 1 and 2 below which plot the CBO’s projections for SNAP monthly benefits and participation from 2023 to 2033.

Figure 1. Forecast of average SNAP monthly benefit 2023 – 2033 (Source: CBO)
In figure 1, we see that benefit levels fall first in 2024 from their relatively high recent levels. After the first few years, the role of food price inflation takes over and the monthly benefit trends upward by 2 percent per year. There are two in 2027 and 2032. Those dates reflect CBO’s expected increases due to updates to the TFP cost index used to calculate SNAP benefits.
Turning to figure 2, we see that the forecast for participation has a similar pattern where participation remains above 40 million persons through 2026. After that, long run trends on economic growth become the dominant factor and drive down participation at a consistent rate of -2% per year. Economic growth expands income and employment opportunities and reduces the number which lowers participation.
The movement of households out of SNAP participation has a second effect of increasing average benefits because beneficiaries at the margin of eligibility with small receipts from the program exit. Thus, in addition to policy updates (TFP) and inflation we expect the average benefit level to increase because remaining participants are relatively poorer and have higher claims.

Figure 2. Forecast of average SNAP monthly participation 2023 – 2033 (Source CBO)
Considering the Options for SNAP Reform in a 2023 Farm Bill
Combining the forecast spending and participation levels in figure 1 and 2 yields a SNAP program that averages $108 billion per year[1]. This makes SNAP on its own larger than all projected farm bill spending when the 2018 Farm Bill was passed. The “sticker shock” of such an increase combined with increasing deficits in the long run outlook have made spending on the farm bill a critical issue for the first time since 2012.
Limiting benefits
A typical compromise to cut projected spending for federal programs is to delay spending cuts to the latter portion of the budget window. For the farm bill, this might mean loading cuts to SNAP spending into the 6th year and beyond. This has the effect of allowing near term spending to follow business as usual while moving scheduled reductions beyond the practical life of the bill to arrive at an acceptable ten-year “budget score”. This shifting tactic is typically used when there is a strong belief that the current baseline “overprices” program spending due to recent economic events causing large forecast spending. In the case of SNAP, delaying cuts to the program could be viewed as a reasonable strategy for a safety net program in a time with uneven economic recovery.
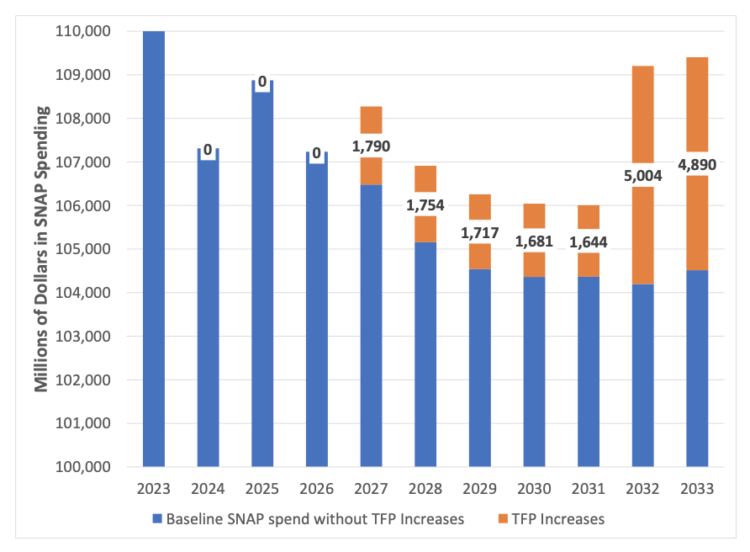
The farm bill baseline will include built in increases triggered by re-revaluation of the TFP (see figure 1). Setting aside these scheduled increases presents an opportunity to “buy” some budget space for other priorities by changing the instructions to USDA on updates to TFP. For example, if new Farm Bill legislation caps or eliminates increases to the TFP this would maintain SNAP benefits unchanged relative to current levels leaving the “spending cuts” as removal of scheduled increases in 2027 and 2032.
In figure 3 we provide an example of how these budget savings might work by replacing the CBO estimated increase to the TFP (2027 and 2032) by the average increase of the previous two years. The total height of a bar in figure 3 represents the CBO estimate of SNAP spending by year while the orange segment illustrates the portion of spending derived from the step-ups projected in the TFP. The inset numbers give the level of the “TFP effect” which could be collected as “savings” relative to the baseline projection.

Figure 3. Baseline savings example of removing TFP increases in 2027 and 2032
Our crude estimates exemplify the compounding effect of the updating TFP – yielding some $18 billion in budget savings with all reductions from baseline spending left to 2027 or later. Following the blue shaded portions of the bars in the example shows that eliminating the TFP updates causes spending to follow more closely the declining participation level of the SNAP that is expected (see figure 2).
Limiting participation
In addition to examining the benefit structure, the 2023 Farm Bill process is expected to feature a return of the pre-pandemic debate over categorical eligibility and work requirements. The SNAP program is funded from the federal budget but administered by states like many other entitlements. As such, federal guidelines have at different times afforded states flexibility in administration of SNAP – including the use of waivers to set aside rules on establishing eligibility and meeting work requirements.
SNAP eligibility requires a household to pass two income tests (gross and net) and an asset test for eligibility. Because states administer several means tested programs, they are allowed to set aside the SNAP specific gross income and asset tests for some households participating in other safety net programs under a rule known as Broad Based Categorical Eligibility (BBCE). As a practical matter, this allows states to enroll SNAP participants that may fail the gross income test (130% of federal poverty line) if their net income is low enough to qualify[2]. Because states will make use of BBCE options differently, the reach of SNAP will then differ from state to state.
In addition to means testing, SNAP has a series of work requirements dating back to 1990s welfare reforms. The overall work requirement requires that household members of working age be available to work in an acceptable job and not reduce hours voluntarily. A secondary component of the work requirement limits able bodied adults without dependents (ABAWD) to a maximum of three months of SNAP benefits over a three-year period if they are not working 20 hours or participating in approved job training or workfare. As with means testing, states can waive this three-month limit in cases where employment opportunities are deemed insufficient.
The 2023 Farm Bill debate is expected to revisit these two flexibilities in administering SNAP at the state level. The Republican majority in the House supported tightening of waivers via USDA rule changes in 2019 and are expected to make this case again as a necessary SNAP reform for 2023. A March statement from House Democrats offered blanket opposition to reduction in benefits and added restrictions on beneficiaries. Although the US Senate and White House will eventually add their weight to the farm bill process the stage for SNAP debate is expected to be in the House Agriculture Committee.
Compromise areas on SNAP in the 2023 Farm Bill
The politics of the farm bill have historically been characterized by large bipartisan majority votes of passage. If that is to remain in 2023 then some compromise on SNAP that reduces the expected ten-year cost will be the biggest hurdle. The most likely area for compromise is the TFP update process as it creates budget savings and has no direct effect on current beneficiaries. The debate over states having waiver options to enroll more participants presents a tougher path as this debate has matured and positions have hardened.
In terms of eligibility, the debate is likely to focus on applying or adjusting federal caps to SNAP enrollees that participate via a state waiver. The current BBCE rule allows any household with a gross income less than 200% of the national poverty line. For the ABAWD three-month time limit waiver, a county needs to have unemployment that is 20% higher than the national average over a 24 month period or 12 months of unemployment above 10%. For each of these we should expect proposals that tighten requirements for waivers to narrow the disparity between SNAP operations across states.
More broadly, acceptability of a compromise on SNAP will depend on concessions in other priority areas. Policy options that enhance health outcomes or mitigate climate change in the in other areas of the farm bill are most likely to soften the ground on SNAP reform – particularly if they promise positive rural development outcomes that lower wage and opportunity gaps.
[1] Note that nutrition spending is forecast to be about $120 billion per year in the CBO outlook estimates published in February. Participation and average benefits only accounts for the disbursements to individuals – additional costs come from administration of programs and other spending on minor nutrition programs.
[2] Note that BBCE only applies to participation. The calculation of a SNAP benefit remains the same and is based on the net income determination and resulting expected contribution by the household from its own resources toward food spending (~30% of net income).

