January 1, 2014
Factors Influencing Program Choices for Indiana Farmers
![]()
![]()
![]()
![]()
![]()
Indiana farmers have until March 31, 2015 to make their farm program election. The five year market outlook will have a significant impact on farmer election of new safety net programs. Recent articles by Zulauf and Schnitkey23 have highlighted this showing how changes in USDA’s price forecasts for the 2014 crop influence a national indicator4 measure for payments. The recent variability in prices and updated information on a strong harvest led to a change in their Agricultural Risk Coverage (ARC) national indicator from $41 to $79 per corn acre between September and October. This national level indicator with its US level yield assumption is identifying the same effect of price movements on program payments that was shown in the effective price demonstration of APEX article No. 2. In that article, the role of prices in determining payments is shown to be critical, with shallow losses favoring the Agricultural Risk Coverage (ARC-C) program and more serious price declines favoring Price Loss Coverage (PLC).5
While market outlook is obviously a critical input into program choice, there are some fundamental differences in how programs provide payments that will be worthy of farmers’ attentions as they begin the decision process. In what follows we consider four such factors, two each comparing ARC’s county option (ARC-C) to either PLC or the individual option of ARC (ARC-I).
Comparing ARC-C to PLC
ARC-C is fundamentally different than PLC in how it protects farmers in the price dimension. PLC uses a fixed price target set by law and presumably indexed to some estimate of cost of production per bushel for the relevant crop. ARC-C uses a five year Olympic moving average of prices in the establishment of target revenue. As each crop year passes, new target revenue will be set by the more recent five year window. For many possible paths that prices could take, it could be that ARC-C’s ability to track recent price performance with an updated target would make PLC far less attractive in terms of the price level at which it operates. This brings us to the first factor of influence:
1) The ARC-C versus PLC decision is being made at a time when the past five years of prices are much higher than they are expected to be in the next five years.
Figure 1 shows the prices for corn, soybeans, and wheat for crop years 2009 through 2013, the five years which enter the Olympic moving average calculation for ARC-C. The pattern for each of the crops is roughly the same, with prices at their lowest point in 2009, reaching nearly double the 2009 value by 2012, and then falling. The decline begun with 2013 crop year has continued—a quick look at recent near harvest futures prices would indicate that the 2014 crop year prices for corn, soybeans, and wheat should be well below their 2013 levels.6 The implied price protection (assuming that counties are nearly at their Olympic moving average yield) is 86% of the most recent five year Olympic moving average: $4.54 for corn, $10.54 for soybeans, and $5.68 for wheat. These are considerably higher than the counterpart PLC reference prices for corn and soybeans ($3.70 and $8.40 respectively) and slightly higher than the PLC reference price for wheat ($5.50).
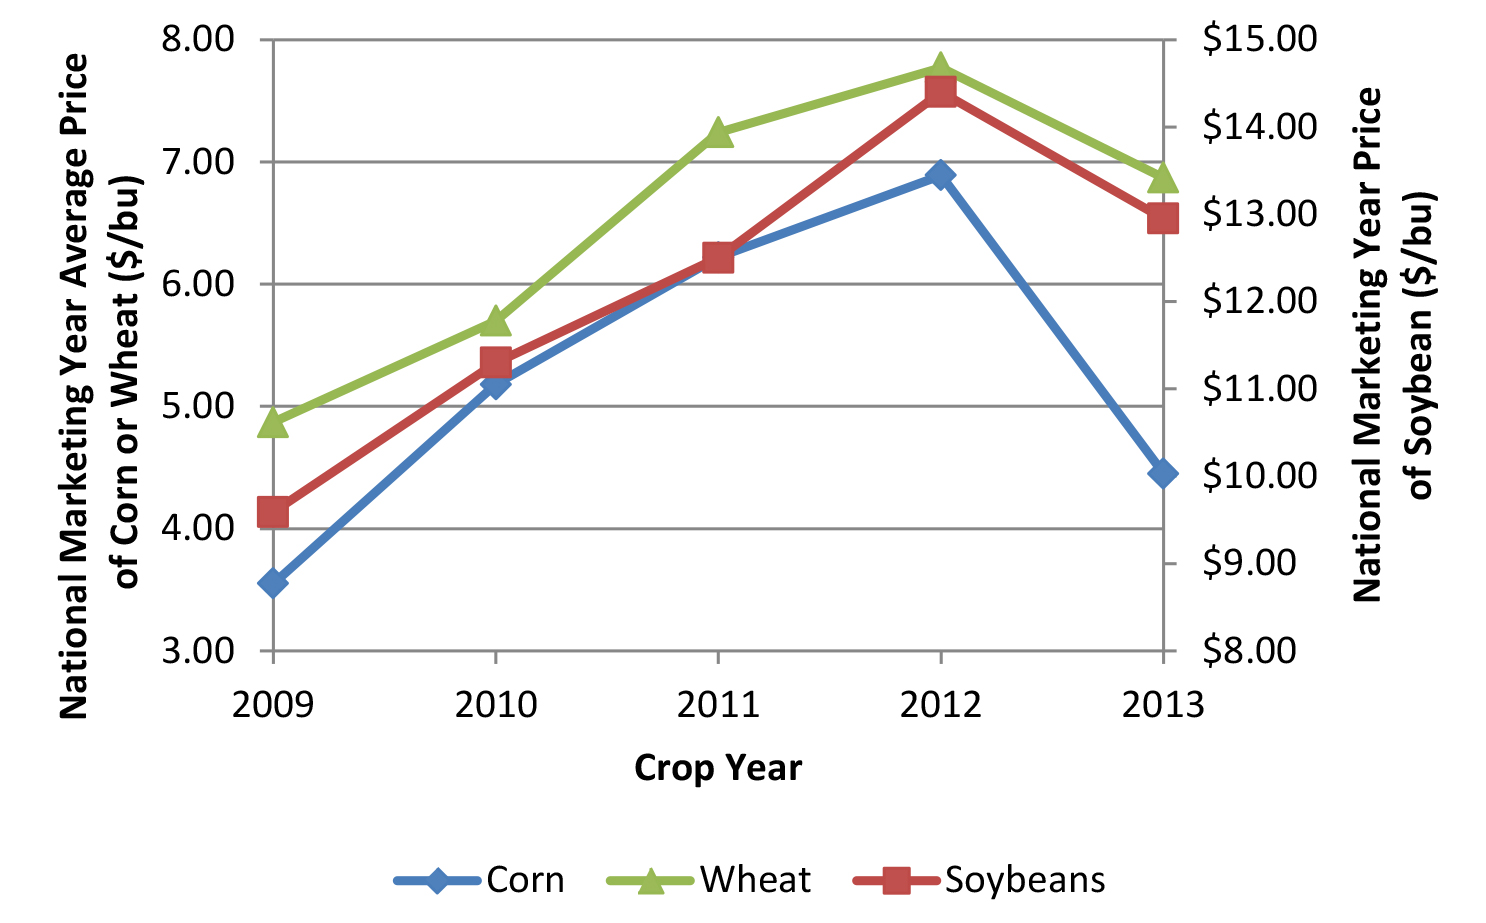
Figure 1. National Marketing Average Price by Crop, 2009 to 2013.
The implication of this first factor under consideration is that there is a lot of potential for farm payments built into the starting point of 2014 for the ARC-C program. This higher implicit price protection of ARC-C is of course intentional and is counteracted by a very narrow range for price protection imposed by the 10% of benchmark revenue limit in the program. In short, “shallow loss” means payments should come more frequently for relatively (compared to PLC) small losses, but are only a bridge to an insurance product which protects the “serious loss” revenue space for a producer.
To provide an example: given the corn ARC-C price protection of $4.54 and assuming the target yield is exactly matched in 2014, corn ARC-C payments are made up to $0.53 per bushel (10% of the $5.28 five year Olympic average price). For the Olympic average yield of 158 (using Indiana state average) this comes to approximately $83.50 per acre of corn. Farmers only receive payments on 85% of corn base lowering the value to $71. That is the expected ARC-C payment under the assumptions outlined. To get an idea of how large this payment is in the new farm bill, an operation with 1,760 acres of corn base would be at its overall limit of program payments ($125,000) under this scenario. Though we assume a yield equal to the moving average value, yields can still be quite high and lead to the same result. In fact, the same farm 1,760 acre base could see a 20% increase in county yield to 189.6 and reach the $125,000 overall payment limit if the national average marketing year corn price is at or below $3.35. There is real advantage built into the first year of the ARC-C program stemming from the use of an initial five year reference period featuring high prices. This high reference value must diminish if prices decline because of the moving average nature. This leads naturally to the second factor that will drive ARC-C versus PLC decision.
2) ARC-C’s first year potential advantage over PLC from use of the 2009-2013 prices in its calculation cannot disappear in the second year of the program due to the use of an Olympic averaging formula.
The prices graphed in figure 1 are not only instructive for showing the overall strength of prices during the five year period but for the pattern that occurred. For each of the three primary crops grown in Indiana, the 2009 national marketing year average price is the lowest in the five year span. In the calculation of the Olympic average price for those five years, that 2009 price is omitted as the lowest value from the calculation. When we move forward to considering payments for the 2015 crop year, we will be using 2010-2014 crop year prices which must be at least as high as the Olympic moving average price in effect the previous year because the three intermediate prices (neither highest nor lowest) are still in the calculation. If the new 2014 marketing year price is very low as forecasts indicate, it is simply not used in the benchmark calculation and farmers will see the same five year Olympic average prices for 2015 crops as in 2014. If prices unexpectedly improve in 2014 and trim payments from what we currently expect in the ARC-C program, the secondary effect of that would be to strengthen price protection for the 2015 crop.
The implication of the Olympic average price calculation of ARC-C and the particular pattern is that farmer’s will have a good understanding for the first two years of ARC-C’s potential for price protection, for example the implicit ARC-C trigger price is $4.54 for both 2014 and 2015 crop years. The PLC program has a fixed reference price of $3.70 for all five years for corn, so this two years of known information in the ARC-C must be weighed against the three years when ARC-C may provide much lower support. For managers that tend to discount delays in receiving payments because of the return they can generate, the fact that there is a lot of potential for payments in the first two years of ARC-C is a factor that will have significant appeal in making the ARC-C versus PLC choice.
Comparing ARC-C to ARC-I
ARC-I is an individualized version of the ARC-C program. Fundamentally, the programs work the same in terms of protecting revenue in the “shallow loss” neighborhood, i.e. from 86% to 76% of benchmark. ARC-I has the distinct appeal of tracking actual farm performance as opposed to relegating all producer payments to be based off the county average. Having your farm payments track to on farm performance comes with a couple of steep penalties however:
3) ARC-I requires whole farm evaluation of average per acre revenue. All crops must be enrolled and simultaneously evaluated such that any crop that is above its benchmark revenue lowers the expected payment on the farm.
ARC-I election removes the flexibility to elect programs on a crop by crop basis. The ARC-I benchmark revenue is calculated as a per acre average revenue across all crops. Rather than paying according to base acre allocation, current planting shares are used to calculate the current year’s benchmark revenue. If a farm has 50% corn and 50% soybeans, the payment calculation for the farm will use those shares on a per acre basis meaning that the benchmark per acre revenue will be drawn equally from each crop. In this benchmark calculation, if one crop is below its benchmark in a given year while the other crop is above its benchmark the two will cancel out to some degree. The net effect is lower protection for the crop with lagging performance relative to what would be seen in ARC-C where the payments for each crop are determined independently. Of course it is possible that it would work the other way, with prices not allowing for one crop to trigger for the county but the whole farm share weighted revenue to be low enough to trigger payments on all base. This is why there is an overt penalty (or premium cost) for choosing ARC-I tied to the base acreage of the farm.
4) The ARC-C program rate on base acreage is thirty percent higher than for ARC-I, meaning that a producer needs to expect significantly larger differences between actual and benchmark revenue from the ARC-I program for it to be attractive.
ARC-C makes payments on 85% of a farm’s base acres while ARC-I makes payments on only 65%. A simple calculation of the ratio of those two numbers (0.85/0.65 = 1.307) indicates that making up the difference in percentage of base covered is going to be quite difficult. Since both ARC-C and ARC-I use the national average price this would require the farm to have a very large productivity difference over the county average in establishing its benchmark at a much higher level. Even then, the farm would be evaluated against its own high productivity in terms of revenue history such that the farmer electing ARC-I would need to expect a combination of the use of planted acreage and increased volatility on the farm relative to the county to provide revenue shortfalls that make up the base acre penalty. When we consider that farmers should be planting covered commodities in any year that have the highest expected return the potential contribution of that factor would likely work against increasing ARC-I payments in most years. This is why most observers have identified ARC-I as a program with minimal appeal in the Corn Belt.
It is important to consider how ARC-I works, if for no other reason than a farmer may need to explain to a landlord why ARC-I is not a viable option for the election. ARC-I appears to be a haven program for producers whose operation is poorly represented by the county average. Counties have municipal boundaries and their averages may mask considerable heterogeneity, such that there are small pockets where topography, soil type, access to irrigation, or other factors cause the productivity pattern to differ from a pocket of farms with different characteristics. These farms enrolled on an individual basis would have benchmark revenue experience wholly different than what is reflected by the county average. If this situation doesn’t describe a particular farmer, ARC-I is unlikely to be a competitive choice in the farm program election decision. Even in the cases where this description is somewhat accurate, careful evaluation and consultation is recommended as the base acreage penalty is very difficult to overcome in terms of expected payments.
Concluding Thoughts
The 2014 Farm Bill has presented farmers with more options than in any set of prior programs offered in five year farm bills. The discussion here as presented ARC-C as the starting point for analysis and consider the factors that lead to its general advantages in the Corn Belt relative to other programs. These factors are inherent in the program mechanisms — how strongly they are expressed or how much they weigh in a particular individual’s program choice will differ greatly. Online decision models offer the promise of detailed breakdown of expected program performance and uncertainty that exists about those expected results. The four factors listed here provide key factors farmers should consider when examining the outcomes from online decision aids. For example, in cases where the PLC program appears strong for a scenario, how can the starting point advantage of ARC-C be overcome? Or, when looking at the year by year pattern of payments why is ARC-C still so large in year two despite the weakness of 2014 markets?
The points raised here derive directly from the program calculations and will drive how programs look on paper. With so much uncertainty about the future and the complications that uncertainty contributes to modeling a five year decision process, the simple factors identified here serve as a lens through which to view decision aid scenario results. While it is important to gather data and consider detailed scenarios in online decision tools, farmers must be prepared to evaluate program choice in a whole farm context and understand what factors cause the results that appear after the decision aid has finished processing their farm data.
![]()
![]()
![]()
![]()
![]()
TAGS:
TEAM LINKS:
RELATED RESOURCES
UPCOMING EVENTS
We are taking a short break, but please plan to join us at one of our future programs that is a little farther in the future.