June 26, 2020
Comparison Of Conventional Crop Rotation With An Organic Forage-Based Crop Rotation
by Michael Langemeier and Xiaoyi Fang
Due to continued increases in demand for certified organic grains, crop farmers that have transitioned from conventional to certified organic grains report higher net returns per acre (McBride et al., 2015; Greene et al., 2017; Greene and Vilorio, 2018; Center for Farm Financial Management, 2020). Despite this, certified organic land accounts for less than 2 percent of U.S. farmland (U.S. Agricultural Census, 2017). For those interested in exploring the potential associated with transitioning to an organic system, information pertaining to the relative profitability of conventional and organic production is often lacking. A previous article examined the relatively profitability of conventional corn/soybean and corn/soybean/wheat crop rotations with an organic corn/soybean/wheat crop rotation (here). This article compares the long-run net returns to land of a conventional corn/soybean crop rotation to an organic forage-based crop rotation that includes corn, soybeans, oats, and alfalfa. This crop rotation consists of three years of alfalfa production. Oats are planted with alfalfa in the first year, so essentially the organic crop rotation is a 5-year rotation. Organic practices tend to involve more complication crop rotations and often include cover crops (Greene et al., 2019). Ten-year enterprise budgets for each crop rotation were developed so that we could capture the net returns of both the transition years and organic production years for the organic crop rotation.
**A corresponding spreadsheet tool used to compare conventional and organic forage-based crop rotations can be found here.
Price, Yield, and Cost Comparisons
Certified organic grains tend to receive higher crop prices and have lower crop yields (McBride et al., 2015 and Center for Farm Financial Management, 2020). Using FINBIN data for the 2014 to 2018 period, organic corn, soybean, and oat prices were more than double the corresponding prices for their conventional counterparts. Organic alfalfa prices were approximately 20 percent higher than average alfalfa prices for conventional production. The crop yield drags for organic corn, organic soybeans, and organic oats were approximately 32 percent, 33 percent, and 23 percent, respectively. The yield drag for organic alfalfa was approximately 9 percent. Combining crop prices, crop yields, government payments, crop insurance indemnity payments, and miscellaneous revenue for both conventional and organic crops, gross revenue for the organic crops was higher, with the most significant difference associated with corn.
Organic crop production often involves higher manure, machinery, and labor costs, and lower fertilizer, herbicide, and insecticide costs. Using FINBIN data for the 2014 to 2018 period, total expenses for organic production in comparison to conventional production were slightly higher for corn and alfalfa, and from 40 to 50 percent higher for soybeans and oats.
Enterprise Budget Summary
Enterprise budgets were developed for conventional and organic corn and soybeans, and for conventional, transition, and organic oats and alfalfa. Conventional corn and soybean enterprise budgets were used to estimate net returns per acre for a corn/soybean rotation. Transition oats and alfalfa were used along with organic corn, soybeans, oats, and alfalfa to estimate net returns per acre for an organic corn/soybean/oats/alfalfa rotation. Oats and alfalfa were used as transition crops, and the transition was assumed to take place over time rather than just the first two years of the ten-year period. The organic crop rotation was set-up to ensure that the first organic crops would be alfalfa and corn, which have historically been the most profitable organic crops. More detail pertaining to the enterprise budgets can be found here.
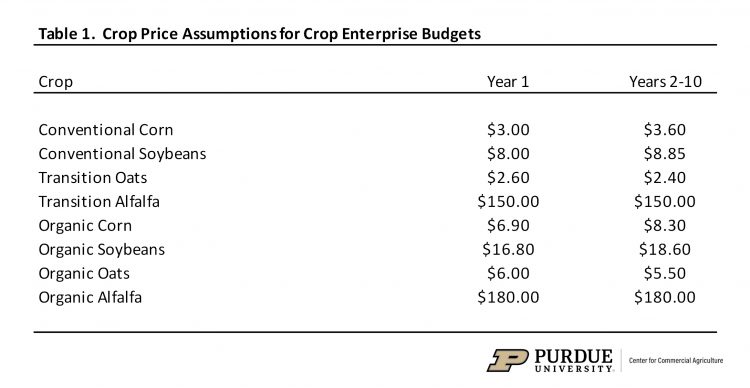
Table 1 illustrates the crop prices that were used for year 1 and years 2 through 10. After being lower in the first year (i.e., 2020), corn and soybean prices were assumed to stabilize and reach a long-run equilibrium. The historical difference between conventional and organic prices was used to estimate the organic prices. Sensitivity analysis related to organic crop price assumptions can be found below.
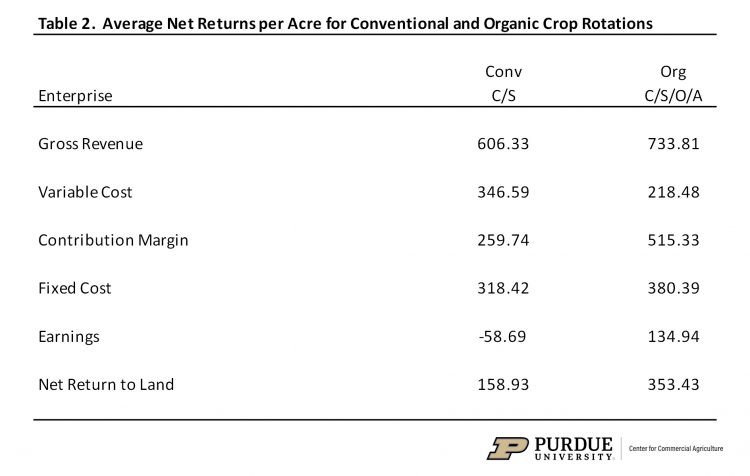
Average net returns per acre for conventional and organic crop rotations are presented in table 2. The contribution margin is computed by subtracting variable cost from gross revenue, which includes crop revenue, government payments, and crop insurance indemnity payments. Earnings are computed by subtracting variable and fixed costs from gross revenue. The gross revenue for the organic crop rotation was significantly higher than the gross revenue for the corn/soybean rotation. Variable cost per acre was relatively lower for the organic crop rotation, but fixed costs were relatively higher. Essentially, the organic crop rotation substitutes manure and machinery costs for fertilizer, herbicide, and insecticide. Labor costs are higher for the organic crop rotation. The net return to land for the organic rotation was $353 per acre, or approximately $190 and $200 higher than that of the conventional corn/soybean rotation.
Sensitivity Analysis of Organic Crop Prices
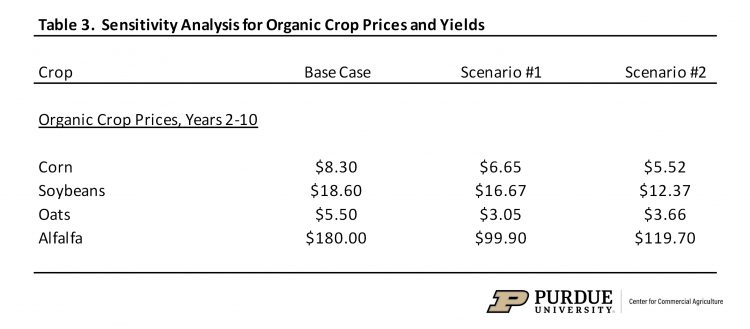
The average net returns per acre for the two crop rotations illustrated in table 2 are sensitive to changes in relative prices, relative yields, and relative costs. The analysis in this section examines breakeven organic crop and forage prices under two scenarios. The first scenario examines the impact of lower oats and alfalfa prices. Strong alfalfa prices, in particular, are very dependent on the demand for this crop in the vicinity of the organic farm. For this scenario, corn and soybean prices were held at their breakeven levels, and oats and alfalfa prices were allowed to be lower than the levels for year 1 and their breakeven prices. The second scenario examines the impact of lower corn, soybean, oats, and alfalfa prices. Under this scenario, all crop and forage prices were allowed to be lower than their values in year 1. The prices reported for both scenarios represent breakeven prices, which were computed by comparing the net present value of net returns to land among the conventional and organic crop rotations.
The results for the first scenario in the second column of table 3 show what the oats and alfalfa prices would need to be for the net returns for the organic crop rotation to equal those of the conventional corn/soybean rotation. Holding crop yields and costs constant, oats and alfalfa prices would need to be reduced 45 percent for the average net return to land to equal that of the average net return for the conventional corn/soybean crop rotation.
The results for the second scenario in the third column of table 3 illustrate what the crop and forage prices would need to be for the net returns for the organic crop rotation to equal those of the conventional corn/soybean rotation. Holding crop yields and costs constant, crop and forage prices would need to be reduced 33 percent for the average net return to land to equal that of the average net return for the conventional corn/soybean crop rotation.
Under both the first and second scenarios presented in table 3, the net returns for alfalfa are helping maintain net returns for the organic rotation even when faced with significantly lower prices. As noted above, the forage based organic rotation relies on a demand for forage in the vicinity of the organic farm. It is also important to note that the forage based organic rotation has potentially higher net returns that an organic rotation containing corn/soybeans/wheat (Langemeier, 2020).
Summary and Conclusions
This article compared the long-run net returns to land for a conventional corn and soybean crop rotation with an organic forage-based crop rotation. An analysis of this sort requires a lot of assumptions. Producers considering transitioning a portion of their acres to certified organic crop production should carefully examine the sensitivity of net returns using alternative price, yield, and cost assumptions. It is also important to recognize that the crops grown, manure used, and tillage practices vary substantially among organic crop farms. Furthermore, the FINBIN data shows a much wider difference in enterprise net returns among organic crop farms than their conventional counterparts. This wider difference is likely due to the difficulty of managing an organic crop system, and the learning curve associated with growing organic crops. Finally, an organic forage-based crop rotation is difficult to implement if there is not a demand for forages, particularly alfalfa, nearby.
References
Center for Farm Financial Management, University of Minnesota, FINBIN web site, accessed May 31, 2020.
Greene, C., G. Ferreira, A. Carlson, B. Cooke, and C. Hitaj. “Growing Organic Demand Provides High-Value Opportunities for Many Types of Producers.” USDA-ERS, Amber Waves, February 6, 2017.
Greene, C. and D. Vilorio. “Lower Conventional Corn Prices and Strong Demand for Organic Livestock Feed Spurred Increased U.S. Organic Corn Production in 2016.” USDA-ERS, Amber Waves, June 4, 2018.
Greene, C., C. Hitaj, and W. McBride. “U.S. Organic Farming Systems.” In Agricultural Resources and Environmental Indicators, 2019. USDA-ERS, EIB 208, May 2019.
Langemeier, M. “Comparison of Conventional and Organic Crop Rotations.” Center for Commercial Agriculture, Purdue University, June 2020.
McBride, W.D., C. Greene, L. Foreman, and M. Ali. “The Profit Potential of Certified Organic Field Crop Production.” USDA-ERS, Economic Research Report Number 188, July 2015.
TAGS:
TEAM LINKS:
RELATED RESOURCES
UPCOMING EVENTS
January 27 or 28, 2026
Farm Shield is more than a conference, it’s a commitment to helping agricultural families build resilience and plan for a secure future. Don’t miss this opportunity to protect your legacy!
Read MoreJanuary 9, 2026
A management programs geared specifically for farmers. Surrounded by farm management, farm policy, agricultural finance and marketing experts, and a group of your peers, the conference will stimulate your thinking about agriculture’s future and how you can position your farm to be successful in the years ahead.
Read More


