April 14, 2023
U.S. Corn Exports to Key Customers Have Been Weak
by James Mintert
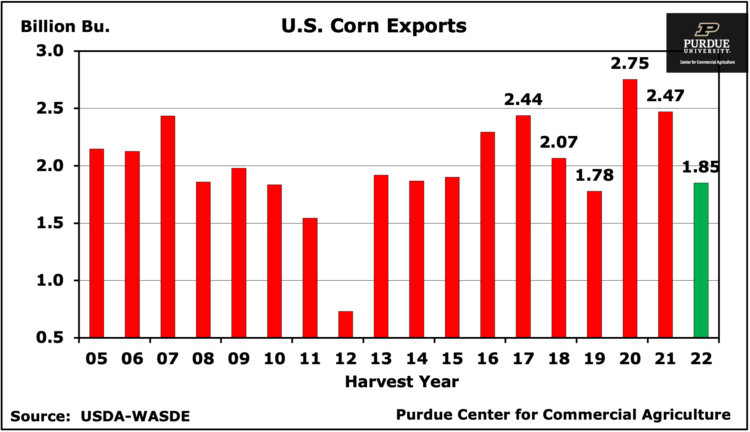
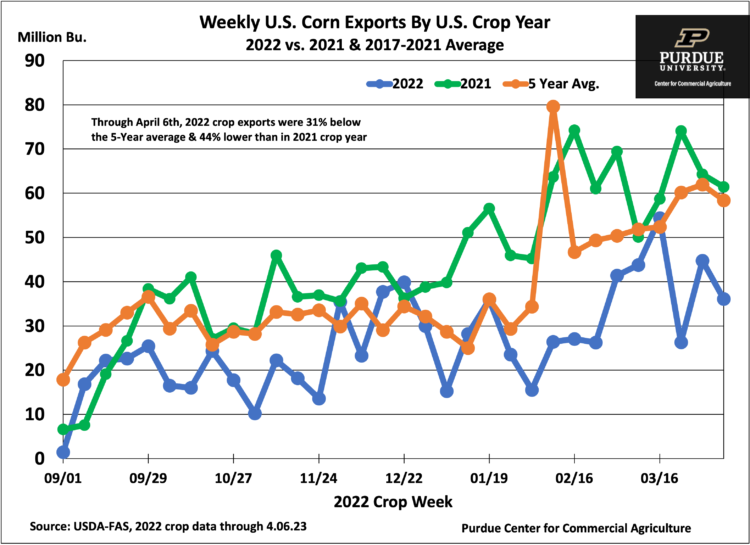
Exports are an important source of demand for U.S. corn and fluctuations in exports can have a big impact on U.S. corn prices. Over the last decade corn exports have ranged from 7% to as much as 20% of U.S. corn production. In its most recent World Agricultural Supply & Demand Estimates (WASDE) report published on April 11th, USDA estimated that 2022 crop corn exports would total 1.85 billion bushels, equal to about 13% of U.S. production. If realized the 1.85 billion bushel forecast would result in the second lowest export total of the last decade and would be down sharply compared to exports for both the 2021 and 2020 crop years.
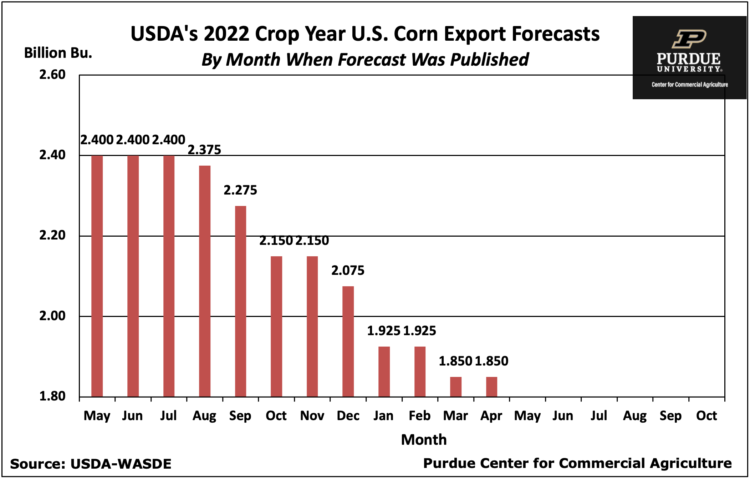
USDA issued its first forecast for 2022 crop exports in May 2022 and then revised its export forecasts throughout the remainder of 2022 and early 2023. Expectations for corn exports weakened considerably compared to early estimates as 2022 unfolded. Back in May, USDA expected 2022 crop corn exports to total 2.4 billion bushels, down slightly compared to exports from the 2021 crop. Soft export commitments and shipments led USDA to weaken its export forecast in late summer with further reductions published in WASDE reports throughout the fall and winter. The export forecast dipped to 1.85 billion bushels in the March WASDE report and was unchanged in the April WASDE report.
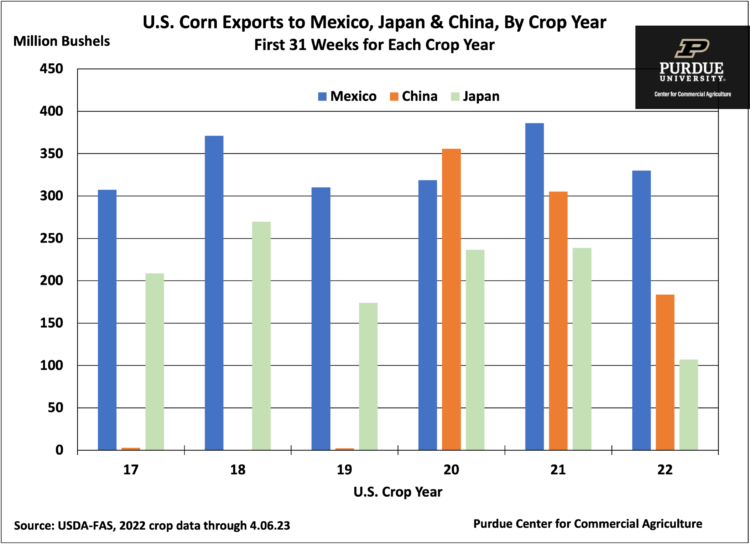
Historically the two largest importers of U.S. corn have been Mexico and Japan. In recent years, China has become an important source of demand for U.S. corn, eclipsing Japan as the number two corn importer. Examining data from the 2017 through the 2021 crop years, exports to Mexico ranged from 12% to 18% of all U.S. corn exports while exports to Japan ranged from 9% to 13% of U.S. exports. China was not an important importer of U.S. corn during the 2017-2019 crop years, but accounted for 13% of U.S. corn exports in 2020 and 12% in 2021. So, given how weak U.S. corn exports have been this year, what’s happened to corn exports to these key U.S. corn customers in the 2022 crop marketing year?
Corn exports in the 2022 marketing year to all three of these key customers have been weak, but year-to-date the biggest decline in export shipments has been to Japan. So far this marketing year, corn shipments to Japan have fallen 132 million bushels below a year ago. Shipments to China have also been weak, falling 121 million bushels below exports from the 2021 corn crop. Exports to Mexico have also weakened, declining 56 million bushels compared to a year earlier, but have been relatively stronger than shipments to either Japan or China. In percentage terms, shipments to Japan so far this marketing year have fallen 55% and shipments to China have fallen 40% when compared to shipments during the 2021 crop year. In comparison, 2022 crop shipments to Mexico have declined just 15% when compared to 2021 crop shipments.
Multiple factors are at play contributing to weak U.S. corn exports in the 2022 crop marketing year including fluctuating currency values and, with respect to China, political intrigue. Longer term, however, it provides insight into increasing competition in corn export channels from South America.
TAGS:
TEAM LINKS:
RELATED RESOURCES
UPCOMING EVENTS
We are taking a short break, but please plan to join us at one of our future programs that is a little farther in the future.


