April 13, 2023
April 2023 Crop Basis Update
by Nathanael Thompson
![]()
![]()
![]()
![]()
![]()
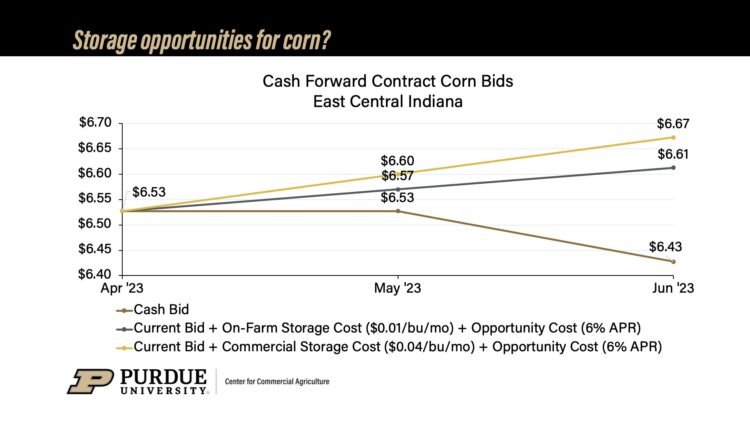
Forward Contract Bids
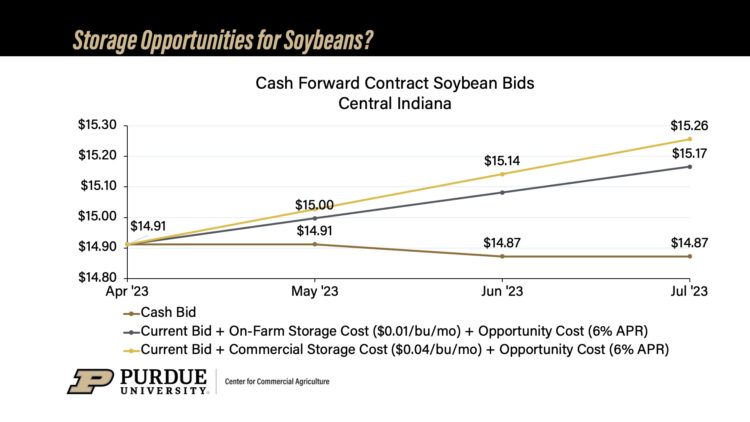
Cash forward contract bids for corn and soybeans are flat to lower from now until mid-summer. This is largely the result of flat to declining forward contract basis bids over the next several months. Futures carry is a nonfactor in these bids given that many buyers have moved bids from now until July to the July ’23 futures contracts, skipping over the May ’23 contract. This move from May to July futures is likely the result of the divergence of these two contracts in recent weeks, with stronger prices for the May ’23 contract relative to July ’23 for both corn and soybeans.
As a result of flat to lower cash forward contract bids, the market is not sending a strong signal for farmers to continue to store old crop corn and soybeans. For example, implied breakeven prices (i.e., the price the farmer would have to sell corn or soybeans for at a future date to be indifferent to selling at today’s price considering storage cost and opportunity cost) are higher than cash forward contract bids currently being offered, meaning that a farmer would not even cover their costs of storing at current cash forward contract prices. However, as we move into the planting and early growing season and new information becomes available this could change. In particular, basis is the tool merchandisers use to secure commodities late in the crop marketing year when supplies tend to be scarce. As a result, basis becomes very volatile during the summer months when new crop information begins to affect old crop basis patterns making forecasting these moves extremely difficult. Therefore, holding grain into the summer months carries both risk and potential reward.
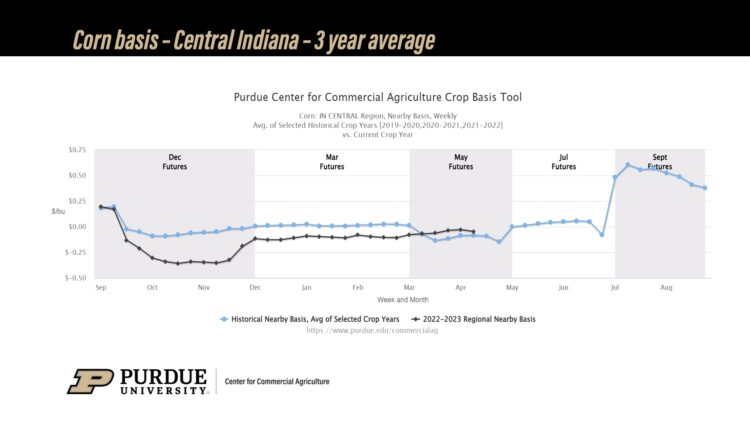
Corn and soybean basis
Corn basis continues to be steady across much of the eastern Corn Belt tracking just above or just below the historical 3-year average in many locations. For example, corn basis in central Indiana was $0.05/bu. under May ’23 corn futures this week, which is just $0.03/bu. stronger than the 3-year historical average corn basis for the region.
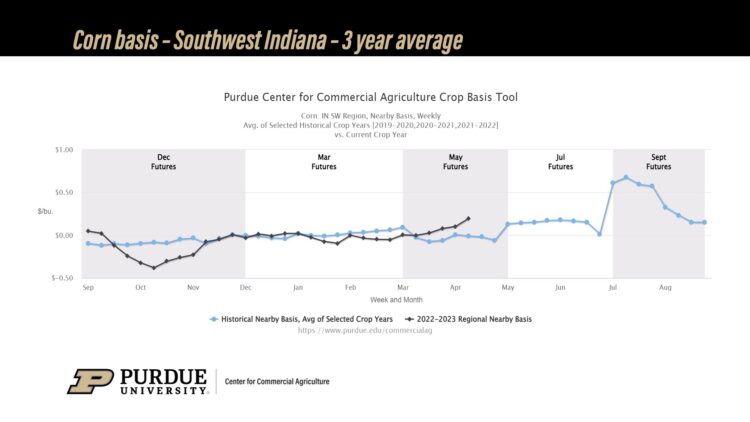
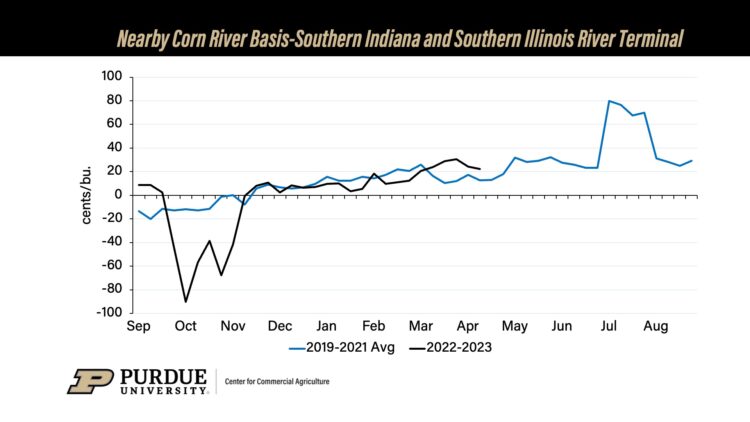
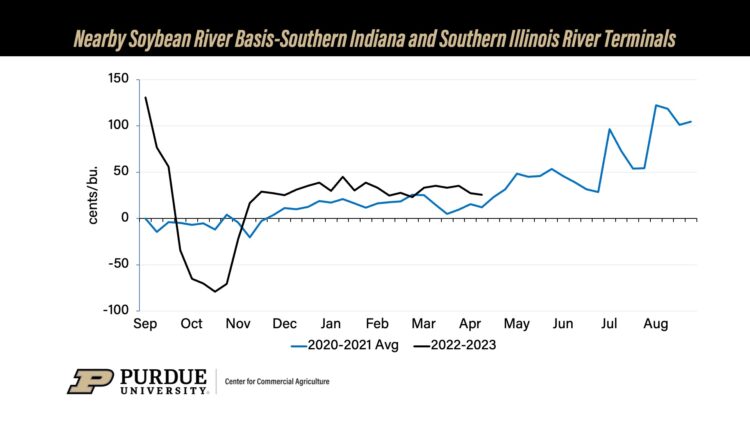
There appears to have been some strengthening in corn basis in some regions in southern Indiana and southern Illinois in recent weeks. Notably, this does not appear to be driven by what is happening at terminals along the Ohio River which tend to be heavily influenced by export sales. Basis at locations along the Ohio River has been steady on steady export demand for corn.
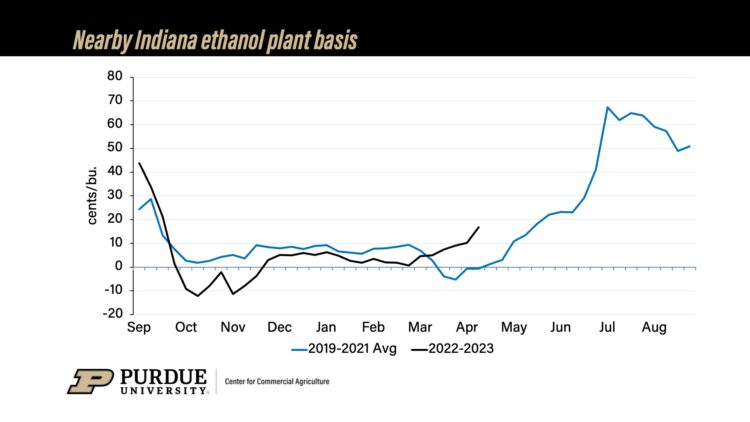
It is also worth noting that basis at Indiana ethanol plants has been steadily increasing since the end of February. Basis at Indiana ethanol plants was $0.17/bu. over May ’23 corn futures this week, which is $0.18/bu. stronger than the 3-year historical average.
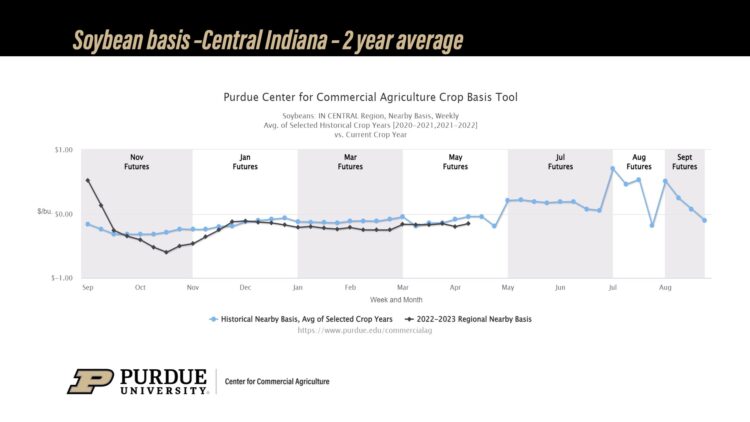
Soybean basis has also been steady across much of the eastern Corn belt. For example, soybean basis in central Indiana was $0.15/bu. under May ’23 soybean futures this week, which is $0.11/bu. weaker than the historical 2-year average soybean basis for the region.
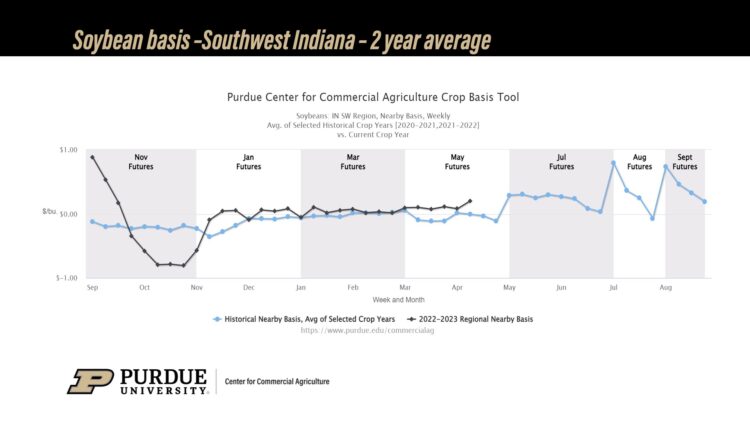
Similar to corn, soybean basis in some of the southern regions of Indiana strengthened this week (by as much as $0.12/bu. in southwest Indiana). However, again this does not appear to be driven by what is happening at terminals along the Ohio River where basis has been flat to weaker on weakening soybean export demand.
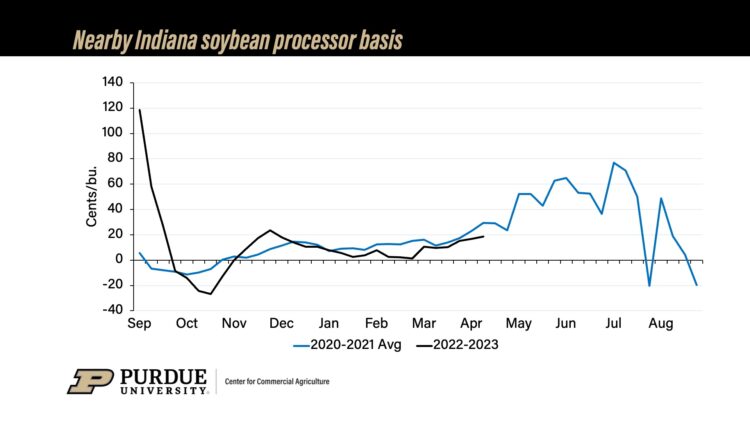
Finally, basis at Indiana soybean processors has been steadily increasing since the end of February. Basis at Indiana soybean processors was $0.19/bu. over May ’23 soybean futures this week, which is about $0.10/bu. weaker than the historical 2-year average.
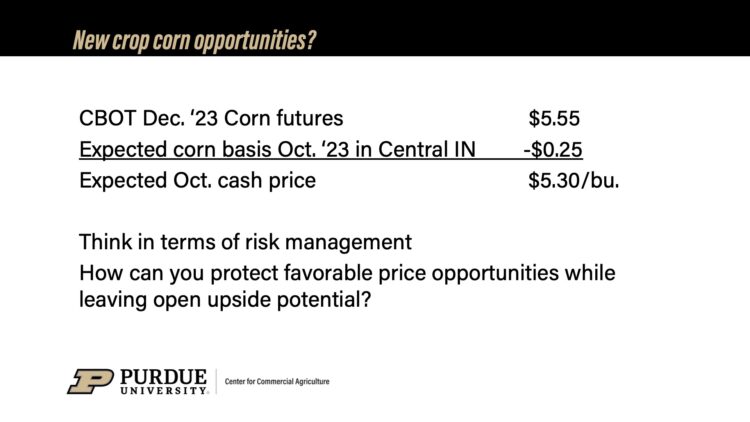
New crop corn and soybean futures prices
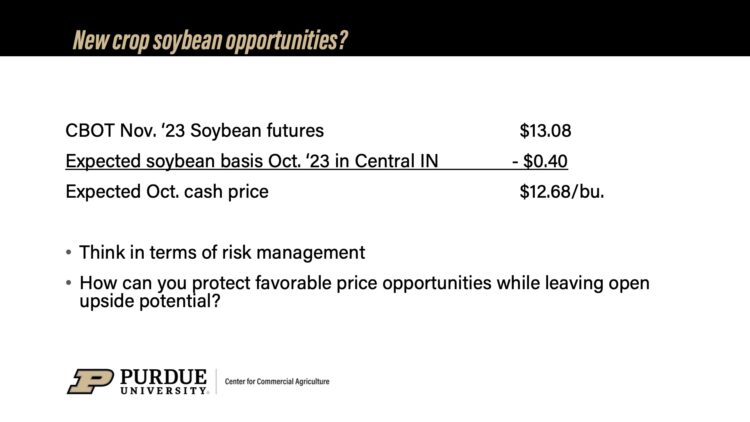
New crop corn and soybean futures prices have weakened since the end of February, although they seem to have leveled off in recent weeks. For example, December ’23 corn futures are down $0.44/bu. since mid-February and November ’23 soybean futures are down nearly $1/bu. over a similar time frame. Farmers looking for new crop marketing opportunities, especially those that have not sold any new crop at higher price levels, will want to pay close attention to futures markets from now until the beginning of July when corn and soybean futures tend to see seasonal price rallies, often as a result of weather risk premiums.
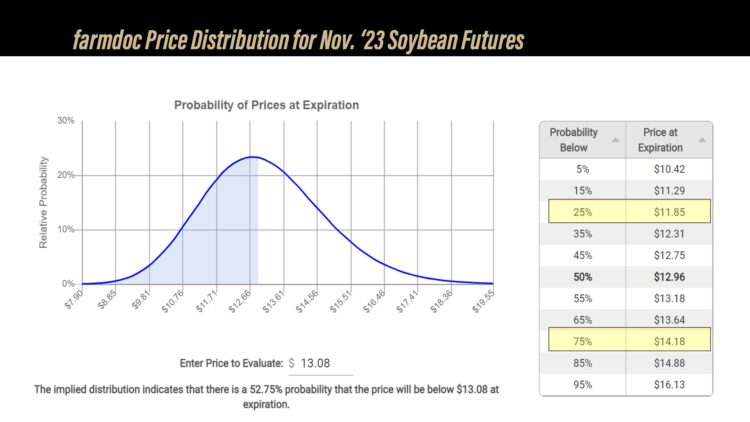
It is also instructive to consider the inherent risk in these new crop futures contracts when examining new crop production and marketing decisions. One way to do this is to consider the distribution of potential prices outcomes for new crop corn and soybean futures contracts. The farmdoc Price Distribution Tool evaluates the distribution of potential prices outcomes for December ’23 corn futures and November ’23 soybean futures based on current price levels and market volatility. For example, December ’23 corn futures are trading for $5.55/bu. The Price Distribution Tool estimates a 25% chance of an expiration price less than $4.84/bu. and a 25% chance of an expiration price more than $6.17/bu. November ’23 soybean futures are currently trading for $13.08/bu. The Price Distribution Tool estimates a 25% chance of an expiration price less than $11.85/bu. and a 25% chance of an expiration price more than $14.18/bu.

![]()
![]()
![]()
![]()
![]()
TAGS:
TEAM LINKS:

RELATED RESOURCES
UPCOMING EVENTS
We are taking a short break, but please plan to join us at one of our future programs that is a little farther in the future.