December 11, 2023
Corn and Soybean Basis Levels Remain Weaker than Normal but are Strengthening
by Nathanael Thompson


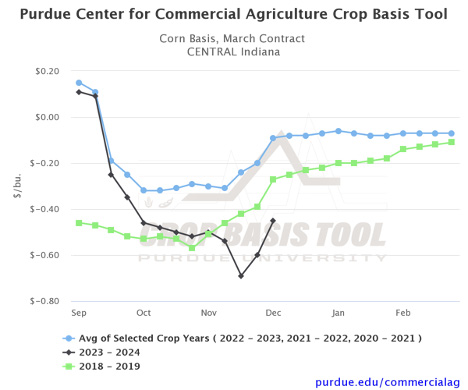
Corn and soybean basis remains weaker than normal in many parts of the United States. For example, in Central Indiana corn basis the first week of December was $0.45/bu. under March ‘24 corn futures. This is $0.36/bu. weaker than the three-year historical average basis level for the same time and region. In fact, this year’s corn basis levels are the weakest we have seen this late in the year since the beginning of the trade war in 2018. However, note that despite weaker than normal basis levels, corn basis in Central Indiana has strengthened $0.24/bu. relative to March ’24 futures in just the last two weeks.
Soybean basis in Central Indiana the first week of December was $0.47/bu. under March ‘24 soybean futures. This is $0.28/bu. weaker than the two-year historical average basis level for the same time and region. Again, these are the weakest soybean basis levels we have seen this late in the year since the 2018 trade war. However, notice that weaker than normal basis levels this year are still quite a bit stronger than 2018 levels given the disproportionate effect of the trade war on soybeans. Despite weaker than normal soybean basis levels, soybean basis has been steadily strengthening at a similar rate to the two-year historical average since October.
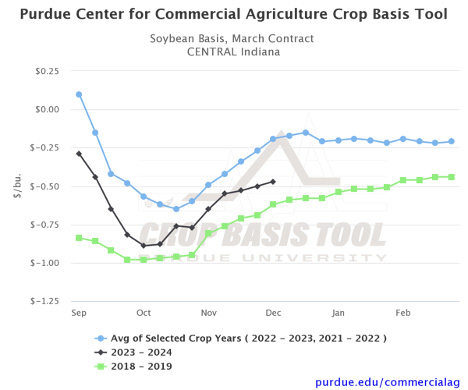
Our research suggests that this weakness in basis levels is likely to persist for the next 8 to 12 weeks. In other words, if you are forecasting basis between now and February 2024 you would likely want to adjust historical averages to reflect current weakness. After that, our results suggest that reverting to the historical averages, ignoring current weakness, would be the best forecast of corn and soybean basis levels. For more insight on determining the best basis forecast for corn and soybeans check out this article.
As always, be sure to visit the Purdue Center for Commercial Agriculture Crop Basis Tool to check current corn and soybean basis levels and historical basis trends in your local area.
TAGS:
TEAM LINKS:

RELATED RESOURCES
UPCOMING EVENTS
Join educators from across the Midwest to build skills for communicating soil health concepts on Nov. 4-5, 2026. In the field, we’ll evaluate the relationship between soil health and water management focusing on irrigation and edge of field practices. The in-service will have both classroom and on farm demonstrations.
The Land of Opportunity: A Conference for Farmland Owners will be held at two locations on October 5 and October 6, providing farmland owners with valuable information and resources to help them make informed decisions about their land. The conference will feature keynote presentations, educational breakout sessions, and networking opportunities designed specifically for those who own, manage, or have an interest in farmland.