August 7, 2025
Flexible Cash Lease Parameters
by Michael Langemeier
![]()
![]()
![]()
![]()
![]()
Recent articles (here) and (here) used a case farm in west central Indiana to illustrate net returns to land derived from crop share, fixed cash rent, and flexible cash lease arrangements. These articles used flex leases based on a percentage of gross revenue, and base cash rents of 75 and 90 percent. In general, flex leases can “flex” on crop yields; crop prices; crop yields and crop prices; and crop yields, crop prices, and production costs. This article compares the net returns of a fixed cash rent and a crop share arrangement with various flexible cash lease arrangements.
Crop Share and Flexible Cash Lease Arrangements
Net return to land from 2007 to 2024 from landowner and tenant perspectives were computed for a case farm in west central Indiana. The case farm had 3000 crop acres and utilized a corn/soybean rotation. The various lease arrangements compared in this article are briefly discussed below.
Fixed cash rents were obtained from the annual Purdue Farmland Value Survey. Specifically, cash rents for average productivity land in west central Indiana were used. With the crop share lease the landlord received 50 percent of all revenue (crop revenue, government payments, and crop insurance indemnity payments). In addition to providing the land, the landowner paid 50 percent of seed, fertilizer, and chemical (herbicides, insecticides, and fungicides) expenses as well as 50 percent of crop insurance premiums. The case farm participated in government programs (e.g., ARC-CO and PLC programs), and purchased 85 percent revenue protection coverage.
Table 1 defines the eight flexible lease types compared in this article. The Type 1 flex lease computes rent using fixed rent per bushel parameters. The Type 2 flex lease uses a base rent, computed using market cash rent, and corn and soybean yields. The Type 3 flex lease is computed by multiplying a fixed number of bushels by actual price. The Type 4 flex lease uses a base rent, computed using market cash rent, and corn and soybean prices. The Type 5 flex lease pays a landlord a fixed percentage of gross revenue, which includes crop revenue, government payments, and crop insurance indemnity payments. The Type 6 flex lease uses a base rent, computed using market cash rent, and both crop yields and prices. The Type 7 flex lease uses a base cash rent that is 90 percent of market or fixed cash rent. In addition to the base cash rent, the landowner receives a bonus based on revenue above non-land cost plus base cash rent. If revenue exceeds non-land cost plus base cash rent, a bonus is paid. Revenue includes crop revenue, government payments, and crop insurance indemnity payments. All cash and opportunity costs, except those for land, are included in the computation of non-land cost. The Type 8 flex lease uses a base cash rent that is 75 percent of market or fixed cash rent. In addition to the base cash rent, the landowner receives a bonus to the extent that the average corn and soybean revenue is higher than a specific percent of corn revenue and a specific percent of soybean revenue. These percentages should approximate the long-run average land cost for these two crops as a percentage of total cost (includes both cash and opportunity costs). Bonuses are frequently paid out under this arrangement.
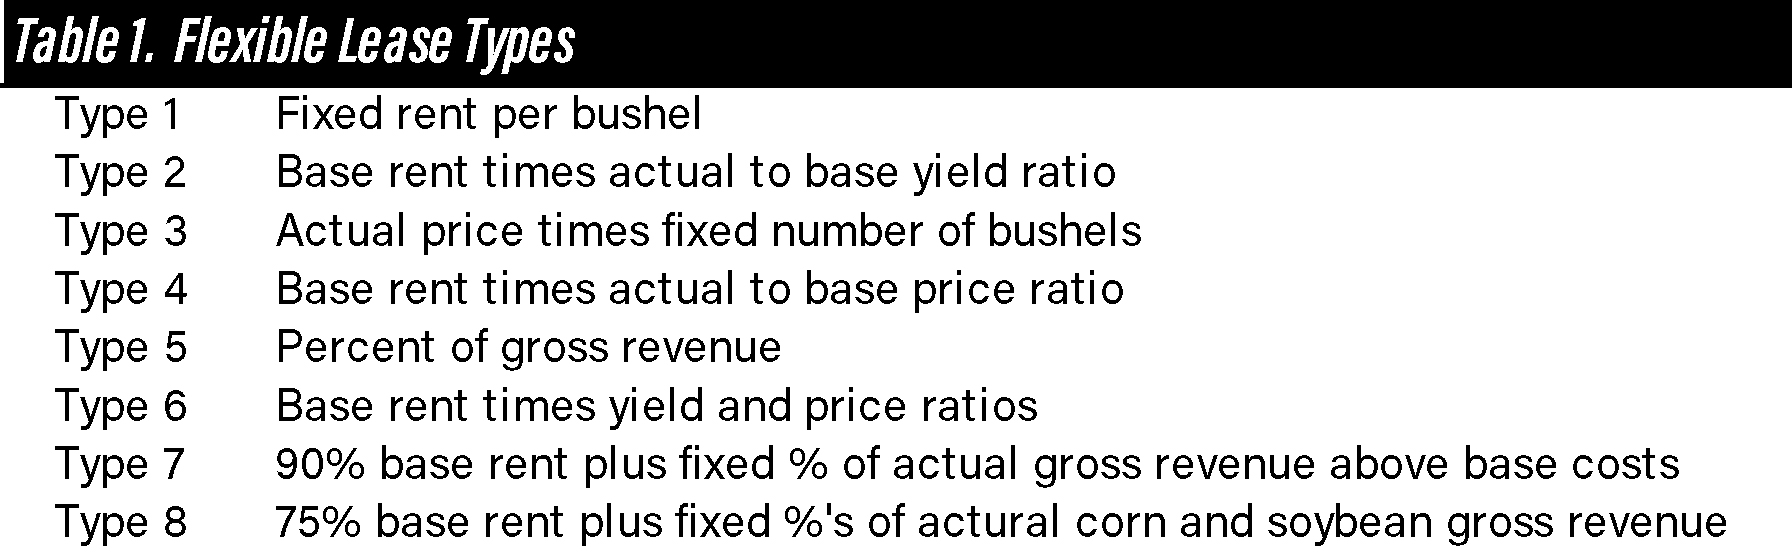
Table 1. Flexible Lease Types
Crop Share and Flexible Lease Parameters
Crop share and flex lease parameters are computed using the certainty equivalent of tenant net returns for the 2007 to 2024 period. The certainty equivalent of net return represents a risk-adjusted net return (Langemeier and Lui, 2020). Essentially, we set the parameters for each lease in such a way that the tenant would be indifferent between a fixed cash rent lease and each individual crop share or flex lease. This enables us to compare the relative riskiness of each lease from both the tenant’s perspective. Parameters are computed assuming a corn/soybean rotation.
Table 2 presents the lease parameters for the crop share and flex leases. The crop share lease parameter is 47.9 percent, instead of the standard 50 percent share. Fixed rent per bushel computations yield a rent of 1.34 times annual corn yield and 4.33 times annual soybean yield (Type 1 flex lease). If we use the actual to average corn and soybean yield ratios, the base rent as a percentage of market cash rent is set at 99.1 percent (Type 2 flex lease). Flex leases where the landlord receives 34.1 percent of crop revenue or 32.7 percent of gross revenue (Type 3 and Type 5 flex leases) are equivalent to a fixed cash rent lease. If we use the actual to average crop price ratios, the base rent as a percentage of market cash rent is set at 101.5 percent (Type 4 flex lease). The base rent as a percentage of market cash rent is set at 101.0 percent if we use actual to average yield and price ratios (Type 6 flex lease). For the 90 percent of base rent flex lease (Type 7 flex lease), the landlord receives 37.8 percent of gross revenue above non-land costs plus base rent. For the 75 percent of base rent flex lease (Type 8 flex lease), the landlord receive revenues above 28.2 percent of corn revenue and above 38.2 percent of soybean revenue.
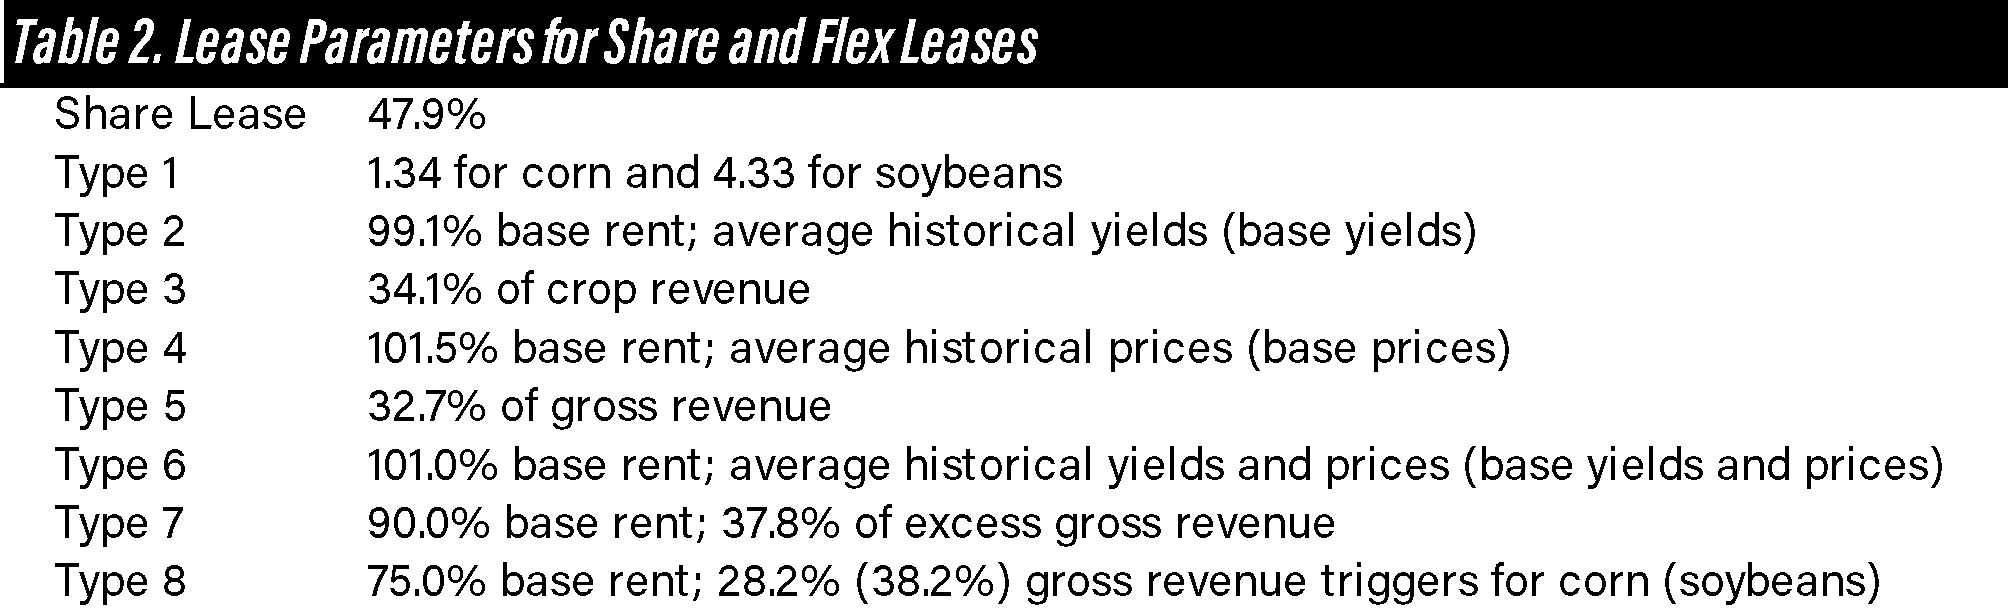
Table 2. Lease Parameters for Share and Flex Leases
Standard Deviations of Net Returns
How does a tenant choose between the leases discussed above? Because the risk-adjusted net return is assumed to be the same across leases, it makes sense to examine the relative riskiness of each lease. Table 3 compares the standard deviation of landowner and net returns, and presents the ratio of landowner to tenant standard deviations. The landowner and tenant standard deviations are also illustrated in figure 1. From a landowner’s perspective, bushel rent has low risk and the two leases that flex crop price (Type 4 and Type 6) have high risk. From a tenant’s perspective, the crop share lease has low risk and fixed cash rent and the two leases that flex on crop yields (Type 1 and Type 2) have high risk. In terms of the ratio between standard deviations, we will focus on the merits of a fixed cash rent lease, a crop share lease, and the flex leases with a base cash rent and bonuses (Type 7 and Type 8). These leases are more common than the other leases discussed in this article. The fixed cash rent lease (represented by the red triangle in figure 1) is relative risky for the tenant, but exhibits low risk for the landowner. The relative riskiness of the bushel rent is similar to the fixed cash rent lease. The crop share lease (represented by the green triangle in figure 1), as has long been argued, does a good job of sharing risk between the landowner and tenant. The flex lease that has a 90 percent base rent is represented by the brown triangle in figure 1, and flex lease that has a 75 percent rent is represented by a gray triangle. From a landlord’s perspective, these two leases have a risk profile that is similar to the fixed cash rent lease. However, from a tenant’s perspective these two leases exhibit less risk than the fixed cash rent lease. This characteristic may explain why tenants are showing more interest in these two flex leasing arrangements.
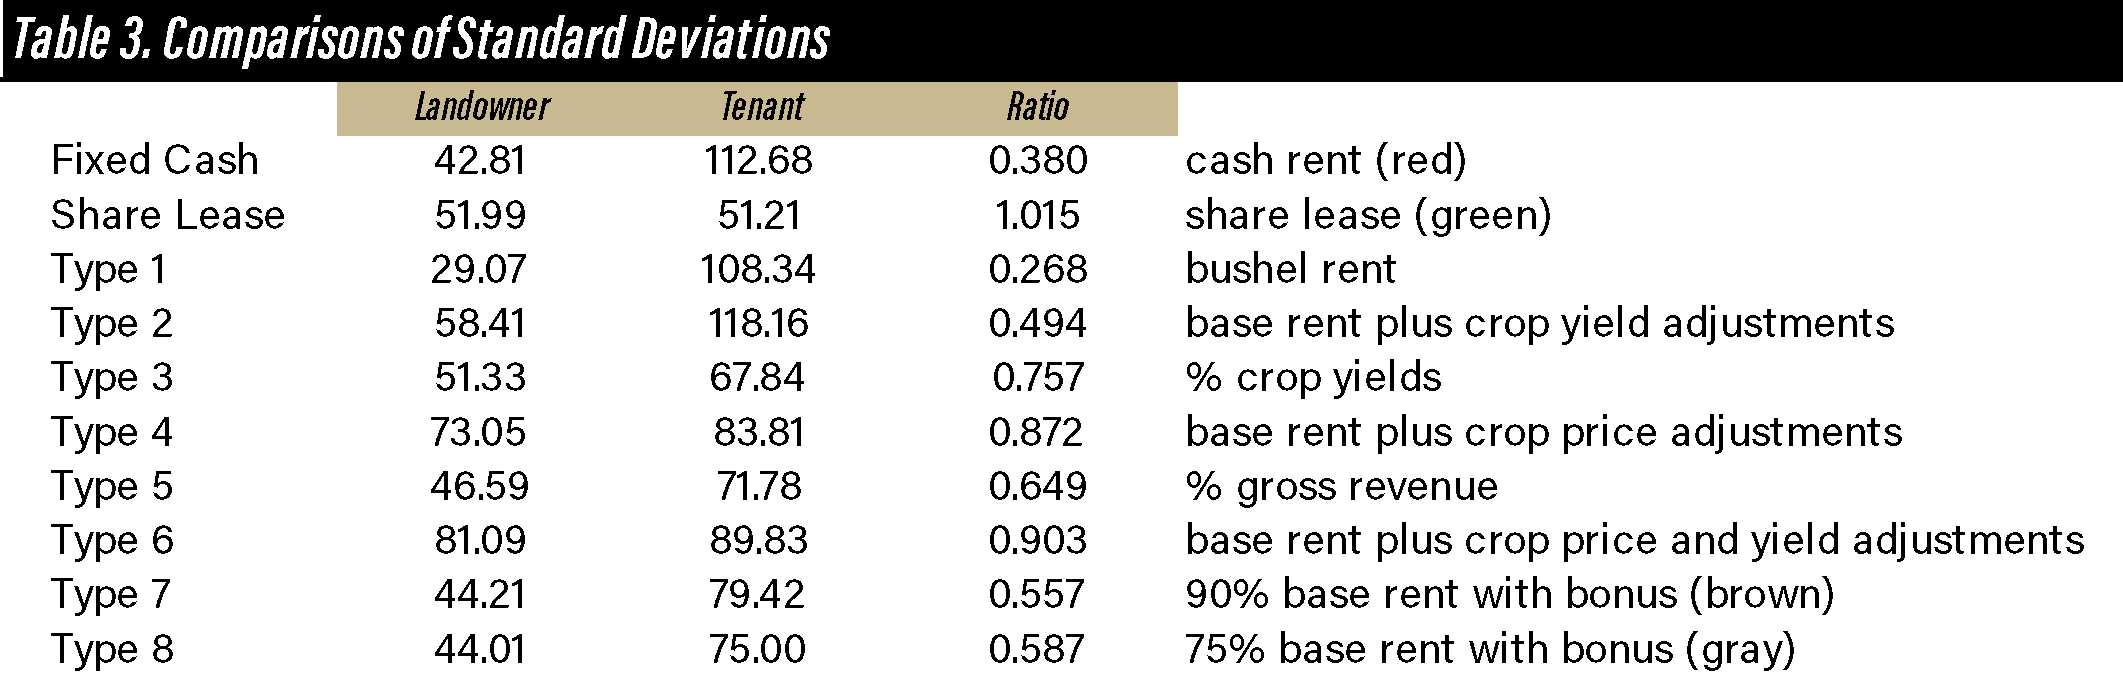
Table 3. Comparisons of Standard Deviations
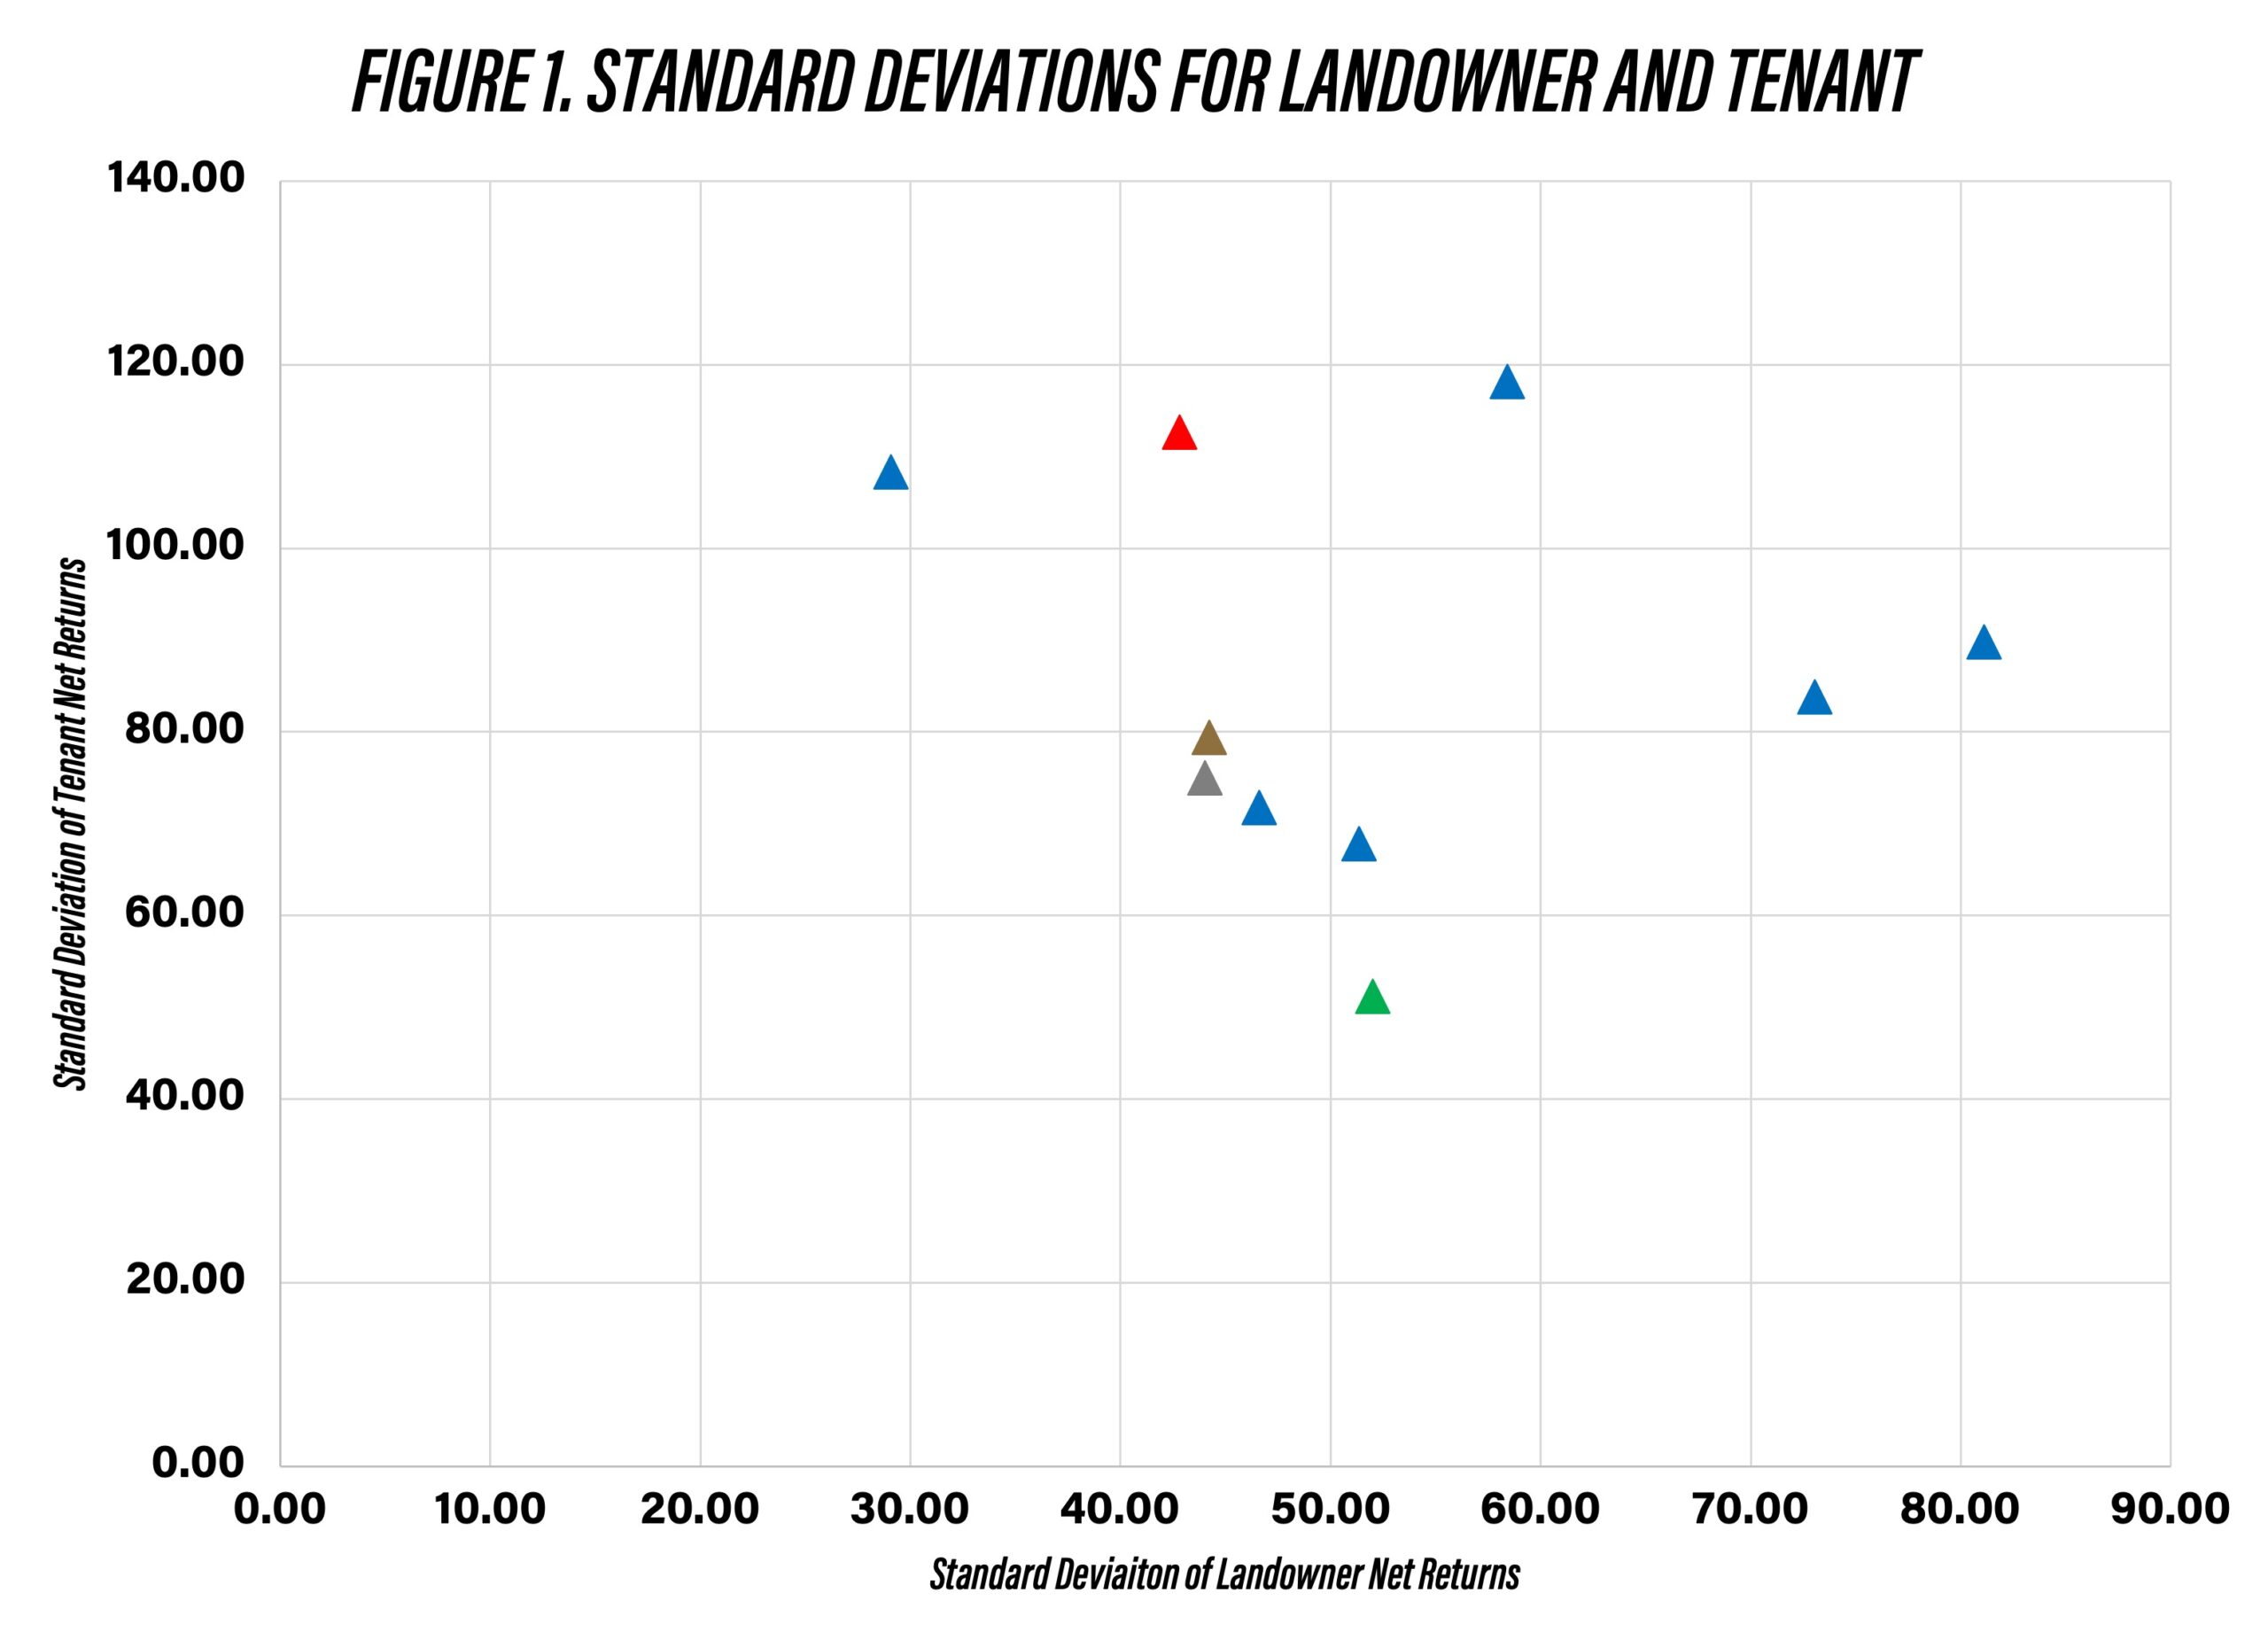
Figure 1. Standard Deviations for Landowner and Tenant
Summary and Conclusions
This article used a case farm in west central Indiana to compare the net return to land and riskiness of a fixed cash rent lease, a crop share lease, and eight flexible cash lease arrangements. The crop share lease does a good job of sharing risk between the landowner and tenant. From a tenant’s perspective, the two flex leases that contain a base cash rent with bonuses are relatively attractive compared to a fixed cash rent lease.
References
Langemeier, M. and Y. Liu. “Comparing Net Return to Land and Risk for Alternative Leasing Arrangements.” Journal of the American Society of Farm Managers and Rural Appraisers. 83(2020):129-136.
Langemeier, M. “Comparing Net Returns for Alternative Leasing Arrangements.” Center for Commercial Agriculture, Department of Agricultural Economics, Purdue University, August 2025.
Langemeier, M. “Flexible Cash Lease Comparisons.” Center for Commercial Agriculture, Department of Agricultural Economics, Purdue University, August 2025.
![]()
![]()
![]()
![]()
![]()
TAGS:
TEAM LINKS:

RELATED RESOURCES
UPCOMING EVENTS
We are taking a short break, but please plan to join us at one of our future programs that is a little farther in the future.