September 3, 2025
Financial Stress on Crop Farms: Who Is Most at Risk in the 2024–26 Downturn?
by Michael Langemeier, Michael Boehlje, and Joana Colussi
![]()
![]()
![]()
![]()
![]()
Midwest crop producers have experienced a significant downturn in corn, soybean, and wheat prices since late 2023, resulting in a drop in net returns in 2024. Moreover, current expectations are that prices will continue to remain at or below the cost of production for at least a couple more years. Consequently, a key question being asked is as follows: “Who is the most vulnerable financially during this downturn”? To explore this question, we analyze farm-level financial data from the Farm Financial Management (FINBIN) database, focusing on operating profit margins and debt-to-asset ratios, to identify which operations face the greatest risk as the downturn deepens.
Defining and Measuring Financial Stress
Financial stress or vulnerability is typically measured using a profitability measure and a solvency measure. Profitability is typically measured using the operating profit margin ratio, and solvency is measured using the debt-to-asset ratio. The operating profit margin ratio is computed by adding interest expense and subtracting unpaid family and operator labor from net farm income and then dividing the result by either the value of farm production or gross revenue.
For the operating profit margin to be positive, net farm income plus interest expense must be large enough to cover unpaid family and operator labor. A long-run benchmark for the operating profit margin ratio is 20 percent. The debt-to-asset ratio is computed by dividing total farm debt by total farm assets. Given the importance of land to total farm assets, land values are an extremely critical determinant of a farm’s debt-to-asset ratio. Farms with little to no owned land tend to have relatively higher debt-to-asset ratios.
Farms are said to be financially stressed if the operating margin is relatively low and the debt-to-asset ratio is relatively high. Specifically, a farm is said to be financially stressed if the operating profit margin is negative and the debt-to-asset ratio is above 0.70. Measuring financial stress is not the same as measuring credit quality or the probability of default. Measures involving credit quality and probability of default typically include the percentage of assets owned, repayment capacity, and working capital (Featherstone and Langemeier, 2017). Comparing the two concepts, financial stress provides a warning signal, whereas credit quality reflects the risk that a farm may not be able to repay short-term and long-term debt.
The discussion below will examine operating profit margin and debt-to-asset ratio for crop farms using the national farm financial database FINBIN, summarized by the Center for Farm Financial Management at the University of Minnesota. One of the most vulnerable groups is farms that lease most of their operating acres. Farm categories based on leasing proportions are currently not available in the FINBIN database. Therefore, we use farms that have less than 10 years of experience (the lowest experience category in the FINBIN database) as a proxy for this group. In addition to those with less experience, farms with relatively high debt-to-asset ratios are also a particularly vulnerable group. Therefore, we examine financial performance for farms with less experience and high debt-to-asset ratios.
Operating Profit Margin Ratio
The average operating profit margin ratio for crop farms was 19.5 percent during the 2019 to 2023 period, according to the FINBIN database. Between 2019 and 2024, crop farm profitability showed sharp swings. Margins were modest in 2019 (7.9%) but strengthened in 2020 (17.9%) before peaking at historically high levels in 2021 (29.3%) and remaining strong in 2022 (27.9%). However, profitability dropped sharply in 2023 (7.5%) and nearly reached break-even levels in 2024 (1.8%), reflecting the financial downturn currently facing producers (see Figure 1).
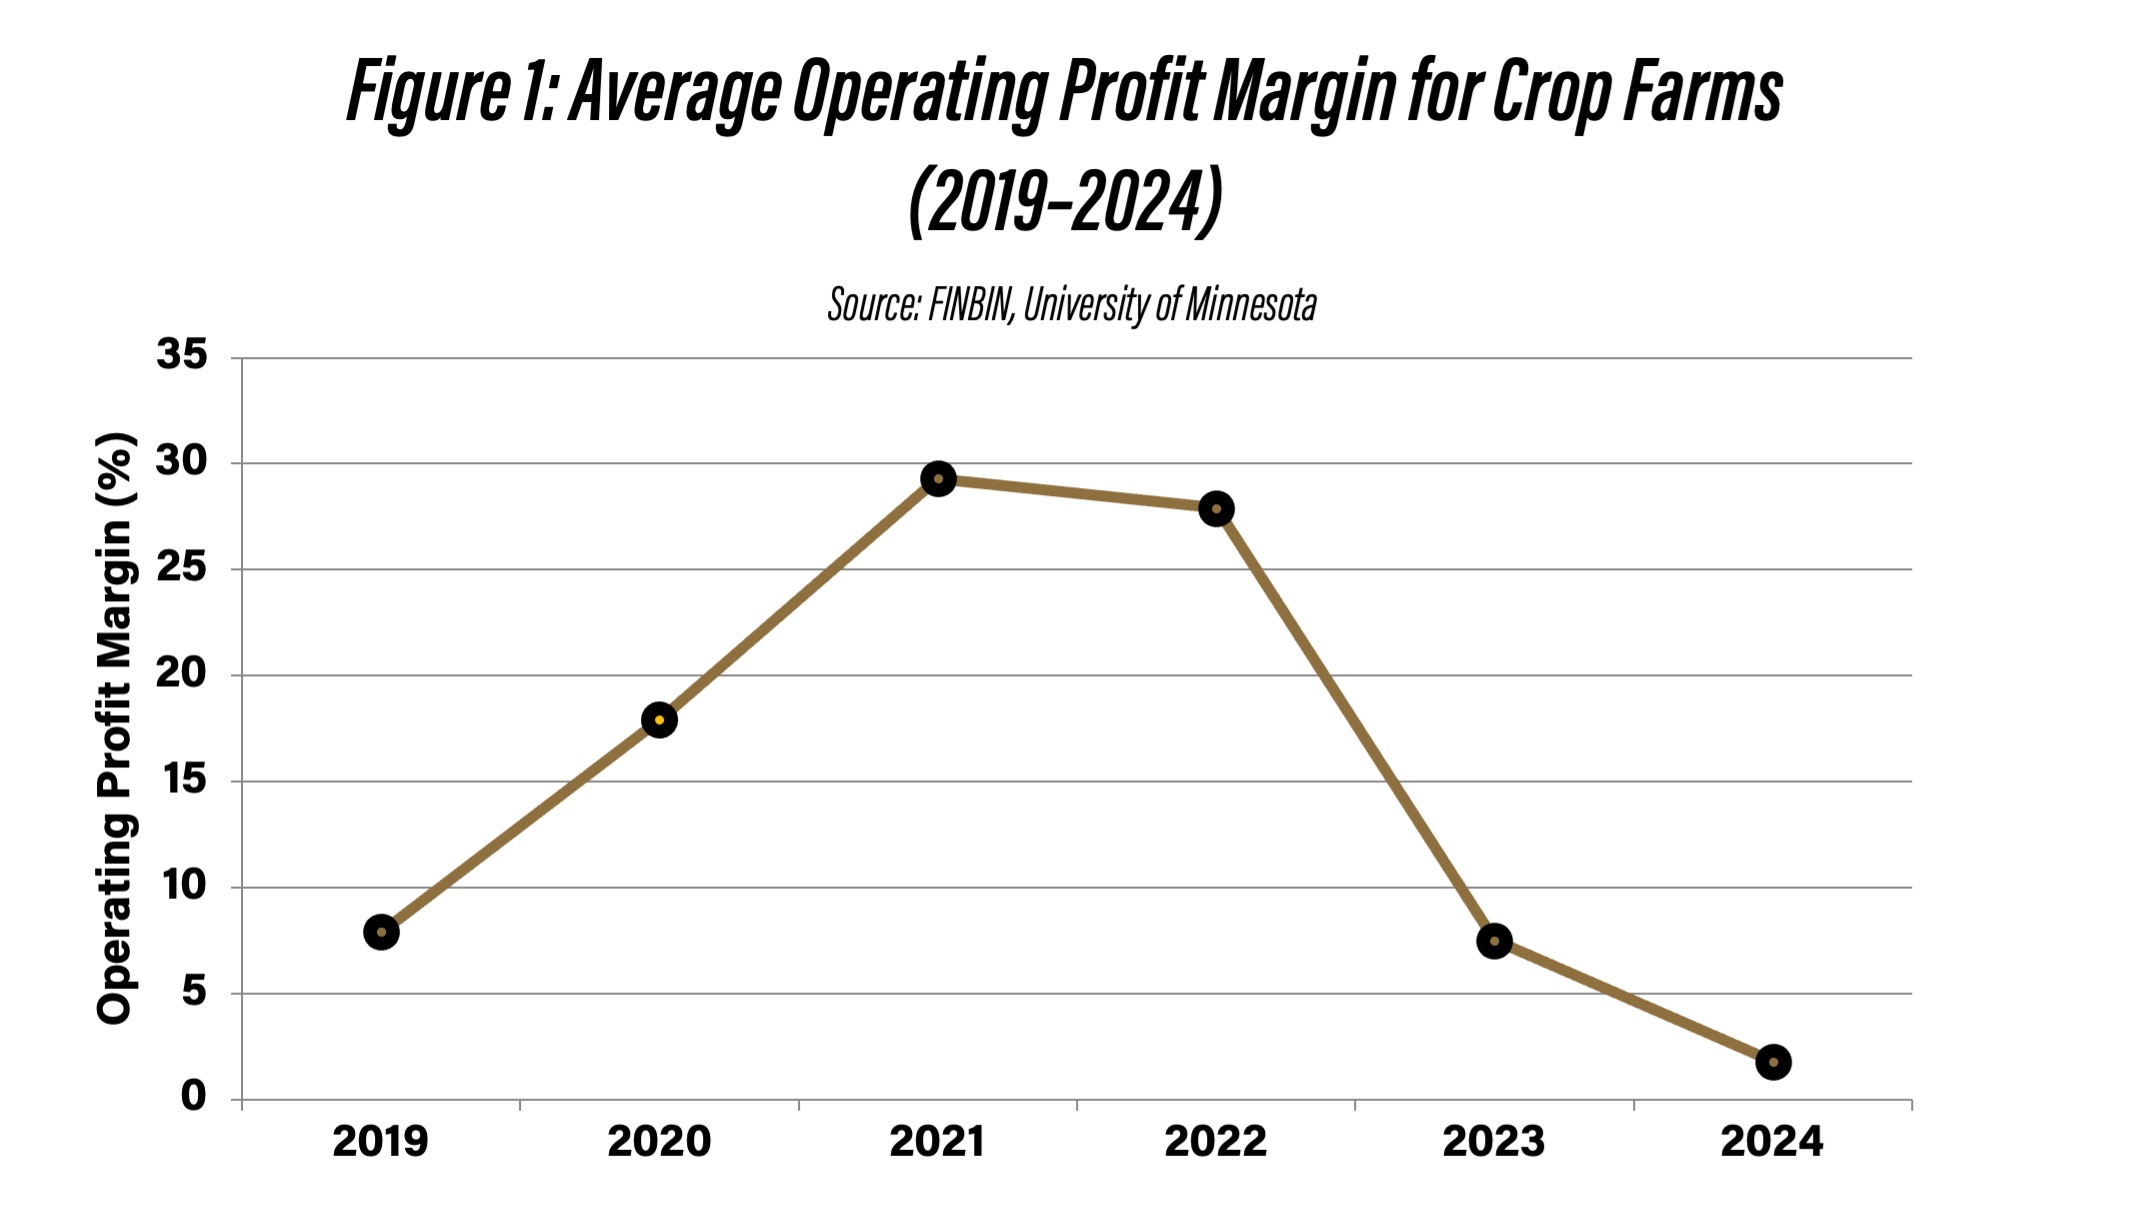
Figure 1: Average Operating Profit Margin for Crop Farms (2019–2024)
The operating profit margin ratio varies widely among farms. In 2024, 55 percent of crop farms had an operating profit margin that was negative, while 9 percent had an operating profit margin above 20 percent.
We use 2024 data to focus on farms that are particularly vulnerable (i.e., farms with managers who only have a few years of experience and farms with debt-to-asset ratios above 60 percent). Ideally, we would like to examine the performance of farms with a debt-to-asset ratio above 0.70. Since this category does not exist in the FINBIN database, we use 60 percent as the debt-to-asset threshold. The average operating profit margin ratio for farms with managers with less experience and a debt-to-asset ratio above 60 percent in 2024 (10.1 percent of all crop farms) was 2.7 percent, slightly higher than the average for all crop farms. Approximately 48 percent of these farms had a negative operating profit margin ratio.
Debt-to-Asset Ratios and Farm Vulnerability
The average debt-to-asset ratio from 2019 to 2023 for all crop farms summarized in the FINBIN database was 30 percent. In 2024, the average debt-to-asset ratio was 32 percent. Approximately 20 percent of all crop farms had a debt-to-asset ratio above 60 percent in 2024. Farms with a debt to asset ratio between 60 and 80 percent represented 15.8 percent of all crop farms, while farms with a debt to asset ratio of over 80 percent represented 3.9 percent of all crop farms (see Figure 2).
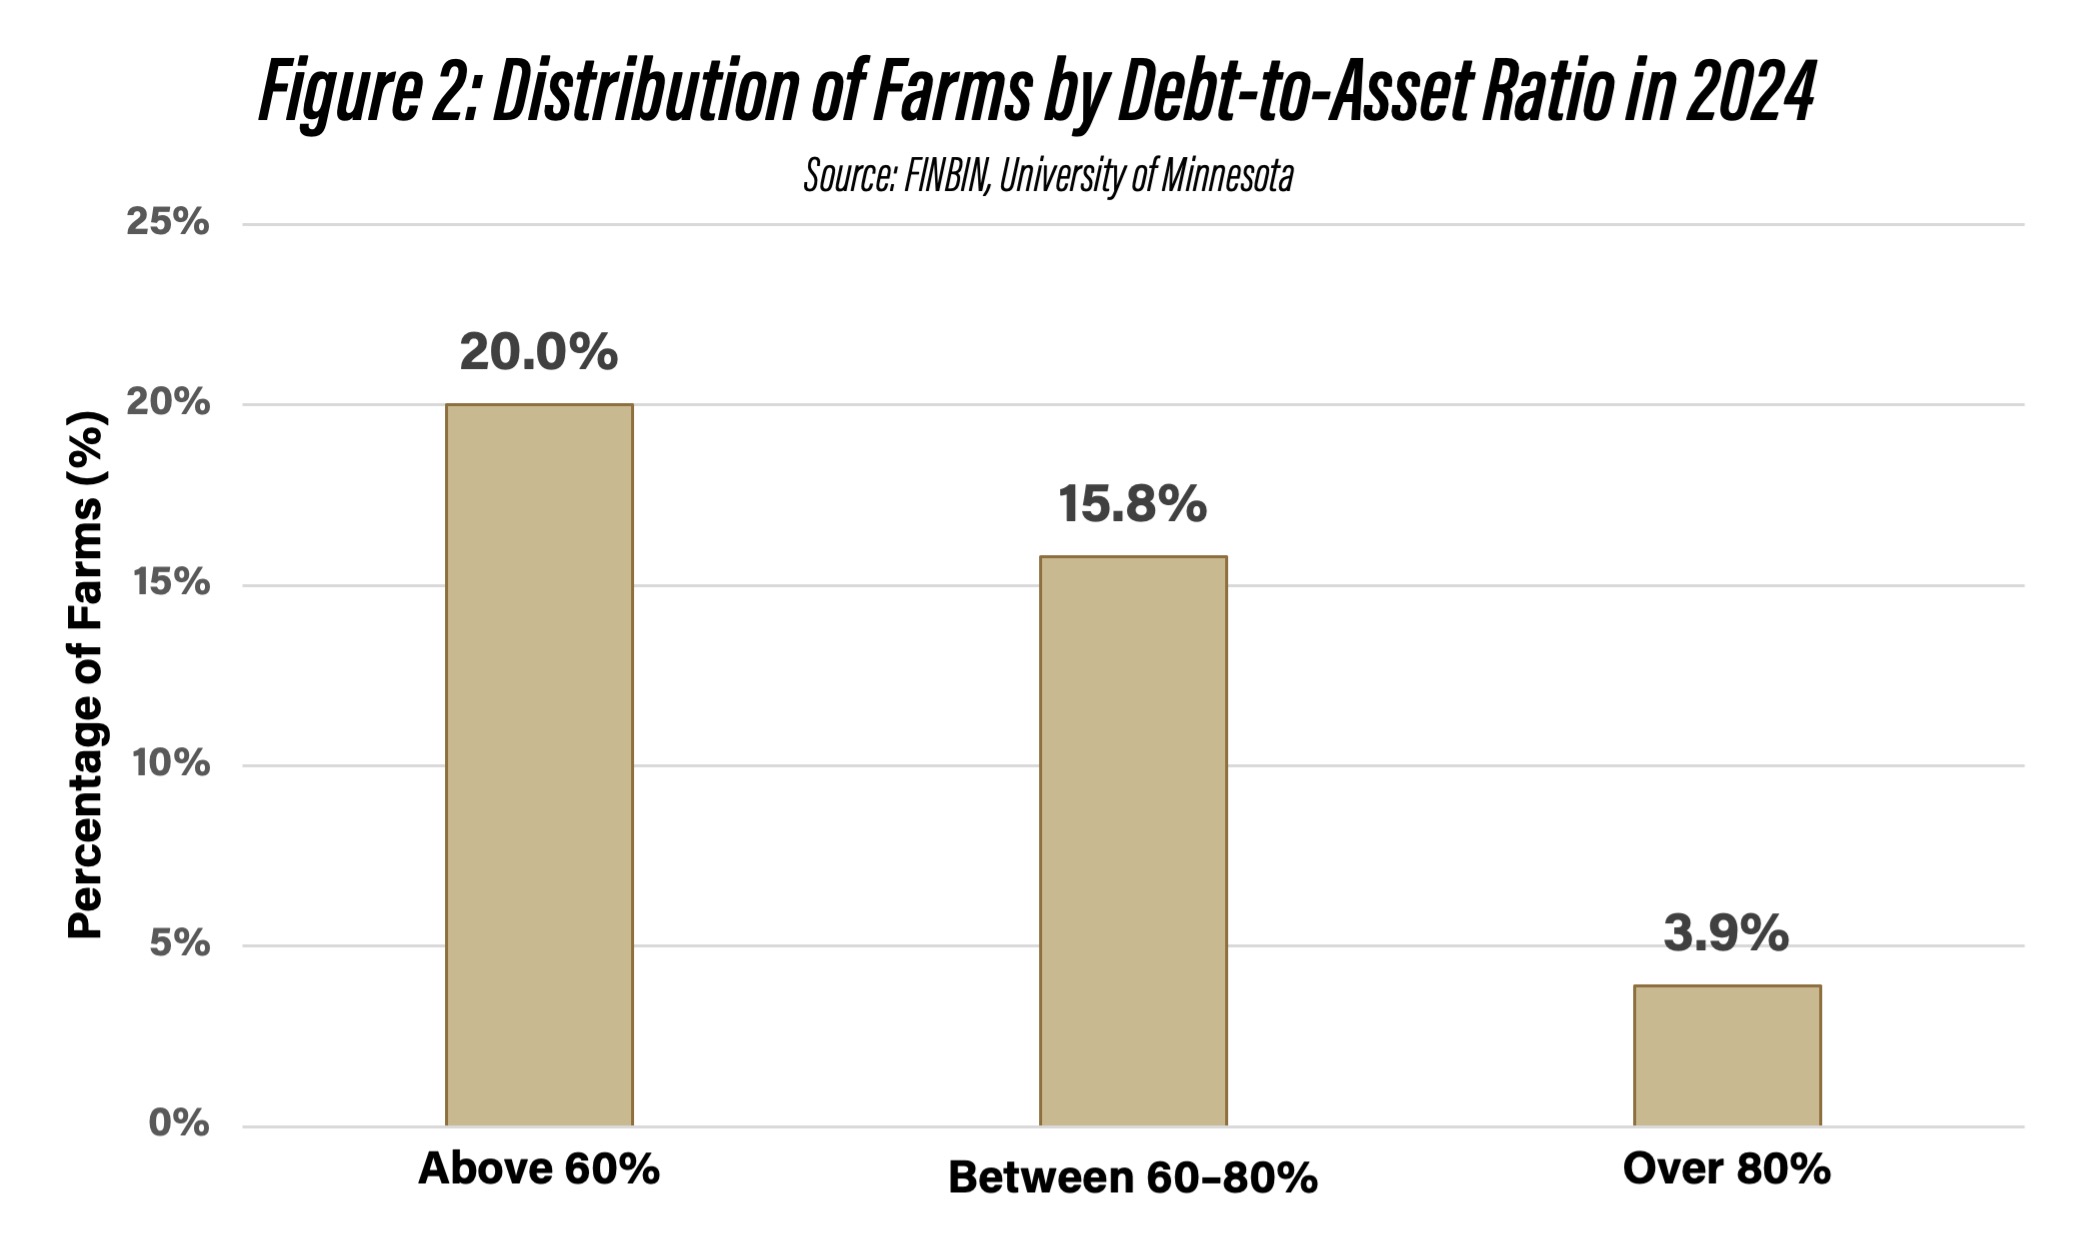
Figure 2: Distribution of Farms by Debt-to-Asset Ratio in 2024
Farms with less experienced managers and a debt-to-asset ratio above 60 percent had an average debt-to-asset ratio of 77 percent in 2024. Meanwhile, the average debt-to-asset ratio for farms with less experience was 55 percent, emphasizing that this group of farms is more vulnerable to financial stress than the average crop farm.
Current Financial Stress and Future Risk
Using the FINBIN database for 2024, approximately 56% of the farms with a debt-to-asset ratio above 60 percent also had a negative operating profit margin ratio. This represents approximately 11.0 percent of all crop farms. Of the farms with managers who had less than 10 years of experience, 48 percent had a debt ratio above 0.60 in 2024, and 47 percent had a negative operating profit margin ratio.
Putting the pieces together, in 2024, using the FINBIN database, approximately 4 to 6 percent of crop farms were financially stressed. Although this is not a high percentage by historical standards, the expected low net returns in 2025/26 could dramatically increase the percentage of farms that are financially stressed by the end of 2026.
Final Considerations
Farms with low profitability and high solvency levels are typically financially stressed. This article used the operating profit margin ratio and the debt-to-asset ratio to create a measure of financial stress. Specifically, farms with a negative operating profit margin ratio and a debt-to-asset ratio above 0.60 were defined as being financially vulnerable.
After averaging over 25 percent in 2021 and 2022, the average operating profit margin for crop farms in the FINBIN database dropped to 7.5 percent in 2023 and 1.8 percent in 2024. Given the continuation of relatively low crop prices, the operating profit margin is expected to drop again in 2025, leading to increased concerns pertaining to financial stress. By examining farm-level data for 2024, this article provides an important baseline for upcoming financial stress discussions.
This analysis reinforced that the farms most vulnerable to financial stress include those operated by less experienced managers, those that lease most of their acreage, operations with high debt-to-asset ratios, and farms with limited off-farm income. Although FINBIN data does not directly isolate farms that lease most of their land, the evidence suggests that less experienced operators often fall into this category.
Moreover, heavy reliance on leased land typically means fewer land assets on the balance sheet, leaving machinery and buildings, assets that depreciate quickly during downturns, as the primary collateral base. This weakens the ability to refinance or restructure debt, a common tool used by lenders to alleviate financial strain. As a result, these operations are particularly exposed when net returns remain low, showing the importance of close financial monitoring and proactive management in the years ahead.
Data and References
Center for Farm Financial Management, University of Minnesota, FINBIN database, accessed August 21, 2025.
Featherstone, A. and M. Langemeier. “Credit Quality of Kansas Farms.” Department of Agricultural Economics, Kansas State University, June 2017.
![]()
![]()
![]()
![]()
![]()
TAGS:
TEAM LINKS:


RELATED RESOURCES
UPCOMING EVENTS
We are taking a short break, but please plan to join us at one of our future programs that is a little farther in the future.