December 23, 2025
The Right Way to Cut Costs
by Michael Langemeier
![]()
![]()
![]()
![]()
![]()
It is natural for a business to think about cutting costs when margins are tight. As the title implies, there is a right and wrong way to cut costs. The right way, from an economist’s perspective, is to cut costs only when the marginal benefits of doing so outweigh the marginal costs. Using marginal analysis is analogous to comparing a decision’s return on investment to a desired rate of return, a method that is often discussed by agribusinesses. After covering some recent results from the Ag Economy Barometer regarding input decisions, this article will examine how marginal analysis can be used to make input decisions.
Recent Ag Economy Barometer Survey Results
The November Ag Economy Barometer survey asked respondents that planted corn in November what changes, if any, their farm would make in 2026 in response to low corn prices. Choices were as follows: reduce N rates, reduce P rates, reduce seeding rate, adopt lower cost seed traits, and no changes. The results are presented in Figure 1. Approximately 40% of the respondents indicated that they would not make any of the changes listed. Approximately 30% and 33% of the respondents indicated that they would make changes in P rates and adopt lower cost seed traits, respectively. Reducing N rates or seeding rates were chosen by approximately 18% of the respondents.
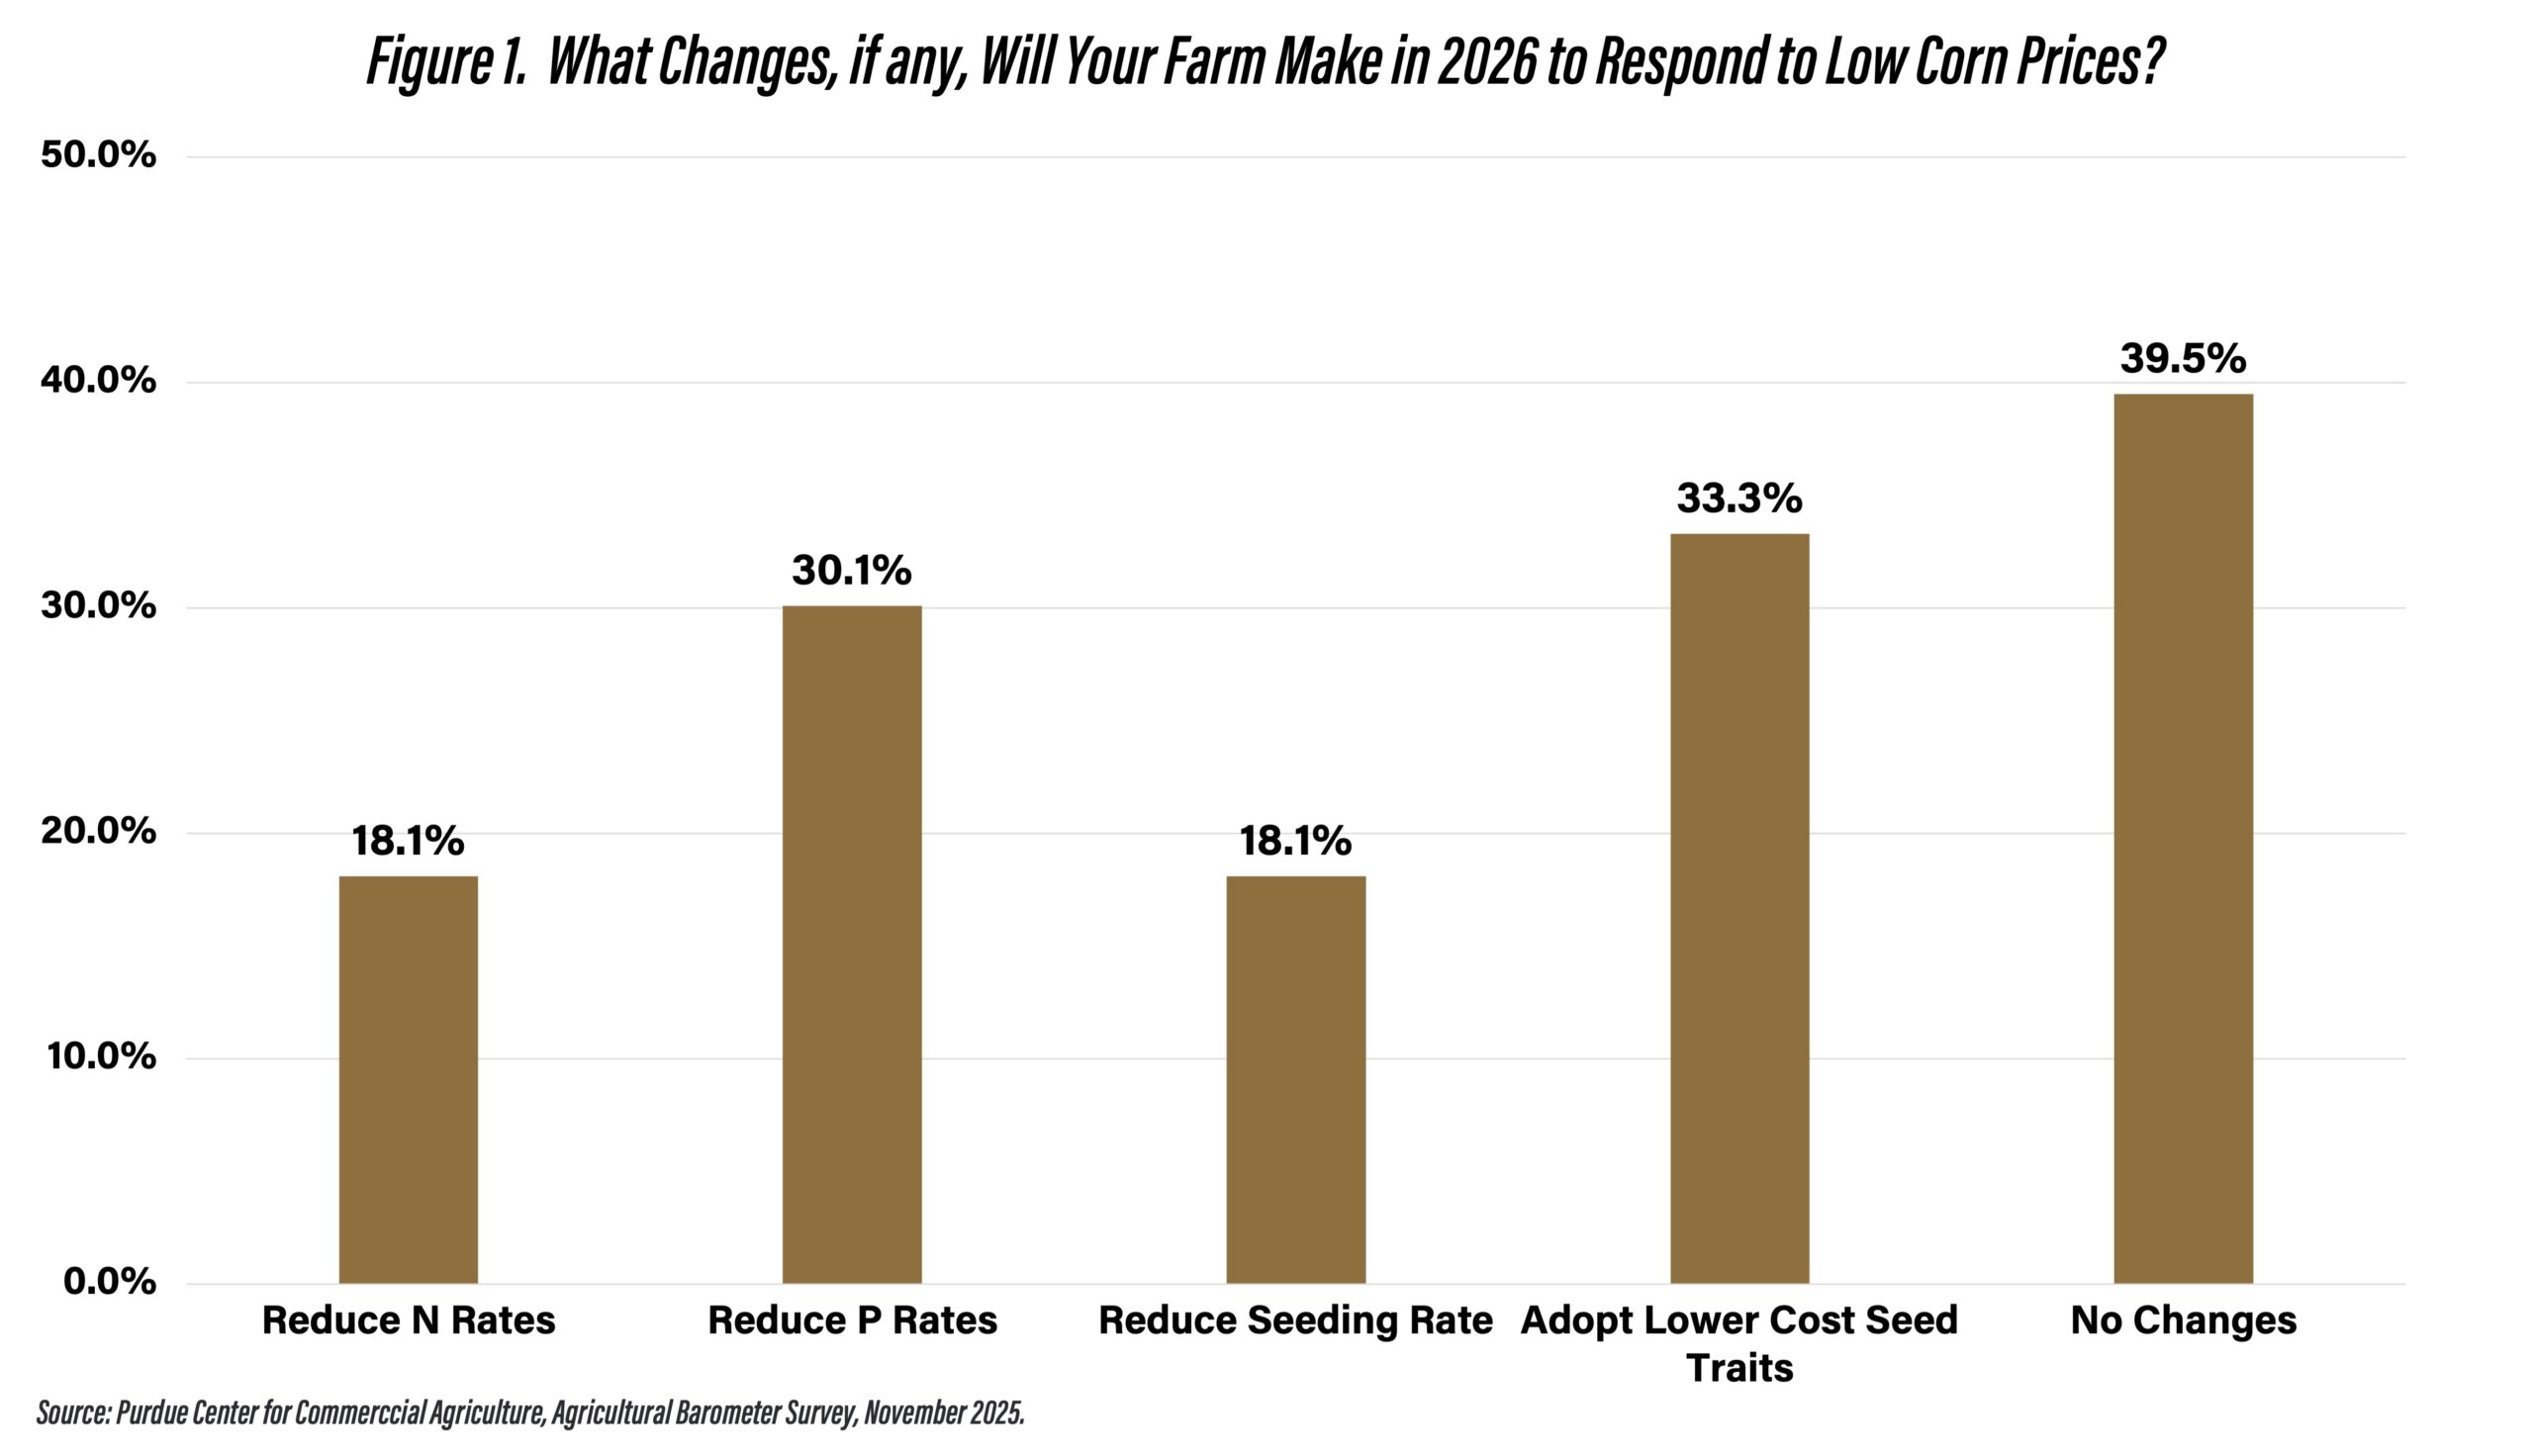
Figure 1. What Changes, if any, Will Your Farm Make in 2026 to Respond to Low Corn Prices?
Using Marginal Analysis When Making Input Decisions
What information or approach should be used when making input choices such as reducing fertilizer rates or modifying seed choices? In general, marginal analysis can be very helpful when making production economic decisions. Economists and managers are interested in the impact of a change in input levels or mix of inputs on production levels. Specifically, decision makers are interested in making changes only if the marginal benefits (i.e., incremental benefits) of the change are larger than the marginal costs (i.e., incremental costs). For example, if we reduce our farm’s N rate by 10 pounds, what will be the resulting change in corn yield. If corn yield changes relatively little, the marginal benefit associated with reducing N cost will be larger than the marginal cost associated with the lower corn yield. Conversely, if the change in corn yield is larger, the marginal benefits may be less than the marginal cost. In the former case we would make the change while in the latter case we would not make the change.
Table 1 illustrates an analysis of reducing the seeding rate for corn from 33,685 seeds per acre to 28,685 seeds per acre. These rates assume that plant population will be 5% lower than the seeding rate and approximate the agronomic and economic optimal rates discussed in Nielsen et al. (2022) and Quinn (2025). Assuming a seed cost per bag of $300, seed cost declines from $126.32 per acre to $107.57 per acre or $18.75. With a corn price of $4.00 per bushel, if yield per acre falls by less than 4.69 bushels or 2.3% for average productivity land in Indiana, it would be prudent to lower the seeding rate. This would be the case if the yield curve is relatively flat as we approach the agronomic optimum.
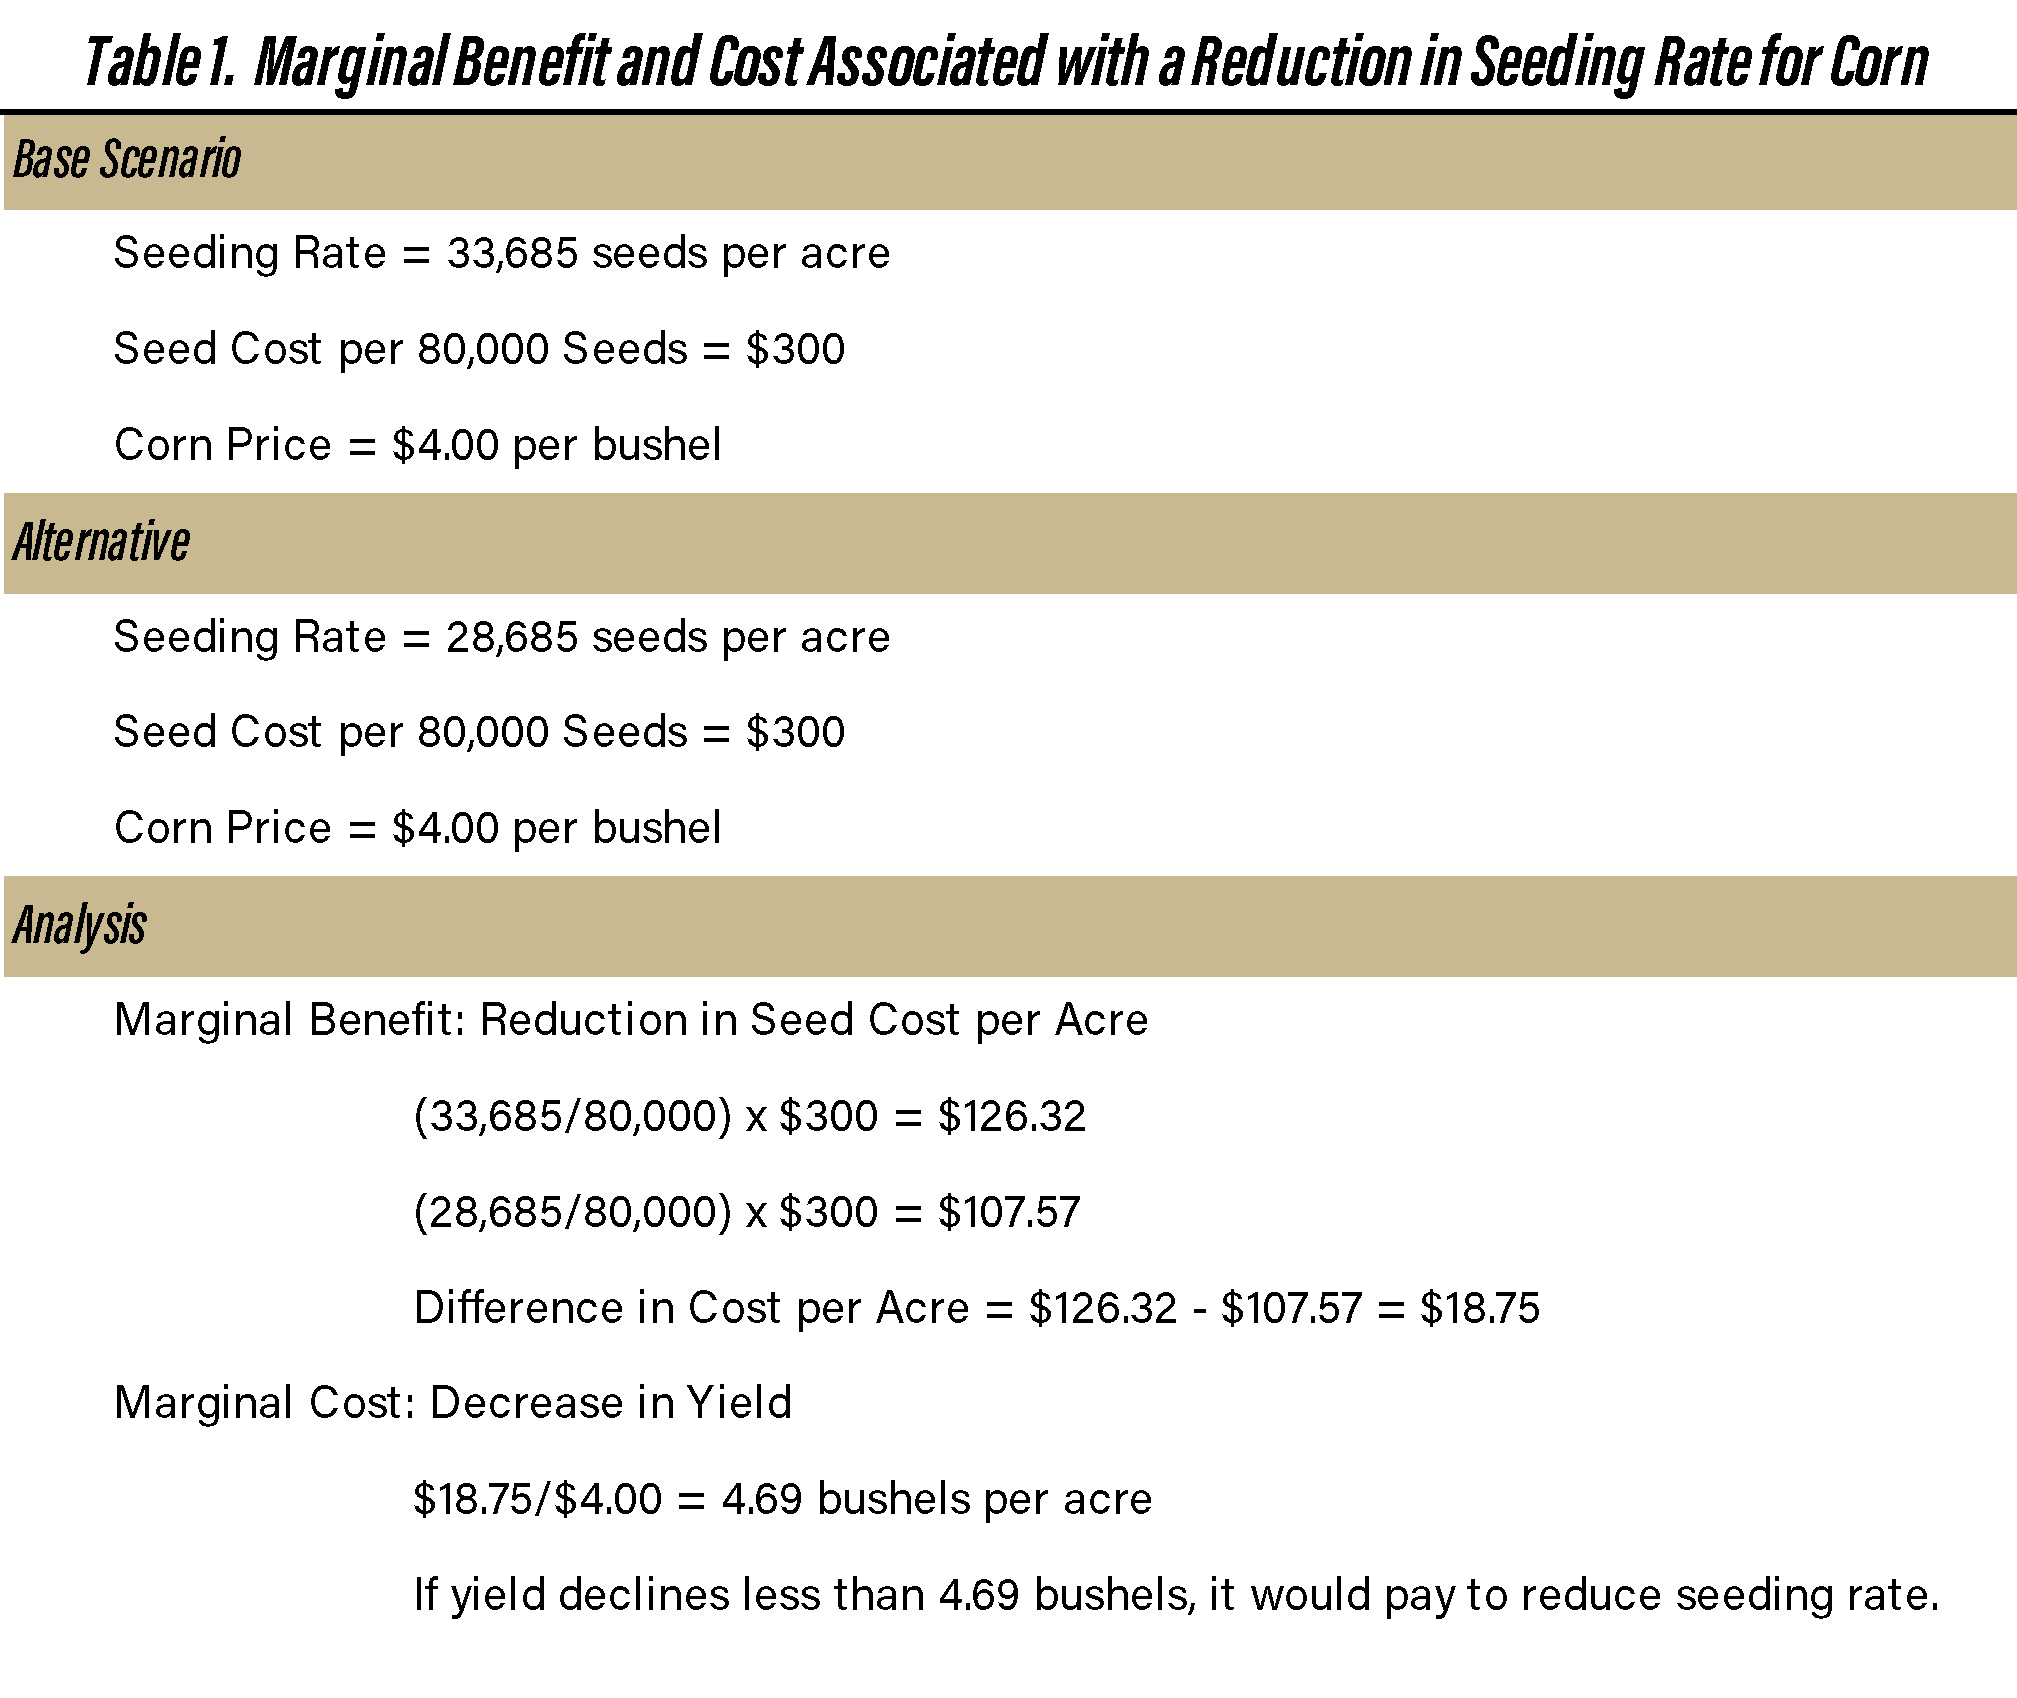
Table 1. Marginal Benefit and Cost Associated with a Reduction in Seeding Rate for Corn
The next example examines a change in seed variety or traits. For this example, we assume a seeding rate of 29,000 seeds per acre and a corn price of $4.00 per bushel. If we utilize seed corn that is $250 per bag instead of $300 per bag, seed cost per acre would fall from $108.75 per acre to $90.63 per acre or $18.13 per acre. With $4.00 corn, if the yield falls by less than 4.53 bushels, it would be prudent to change seed variety or trait. In this example, we are not dealing with the relative flatness of the yield curve (i.e., response of corn yield to seeding rates). The higher priced seed may have more disease resistance, be more resistant to drought, or just have higher yield potential. Because of this, the decision to change varieties or traits is more complicated than seeding rate decisions.
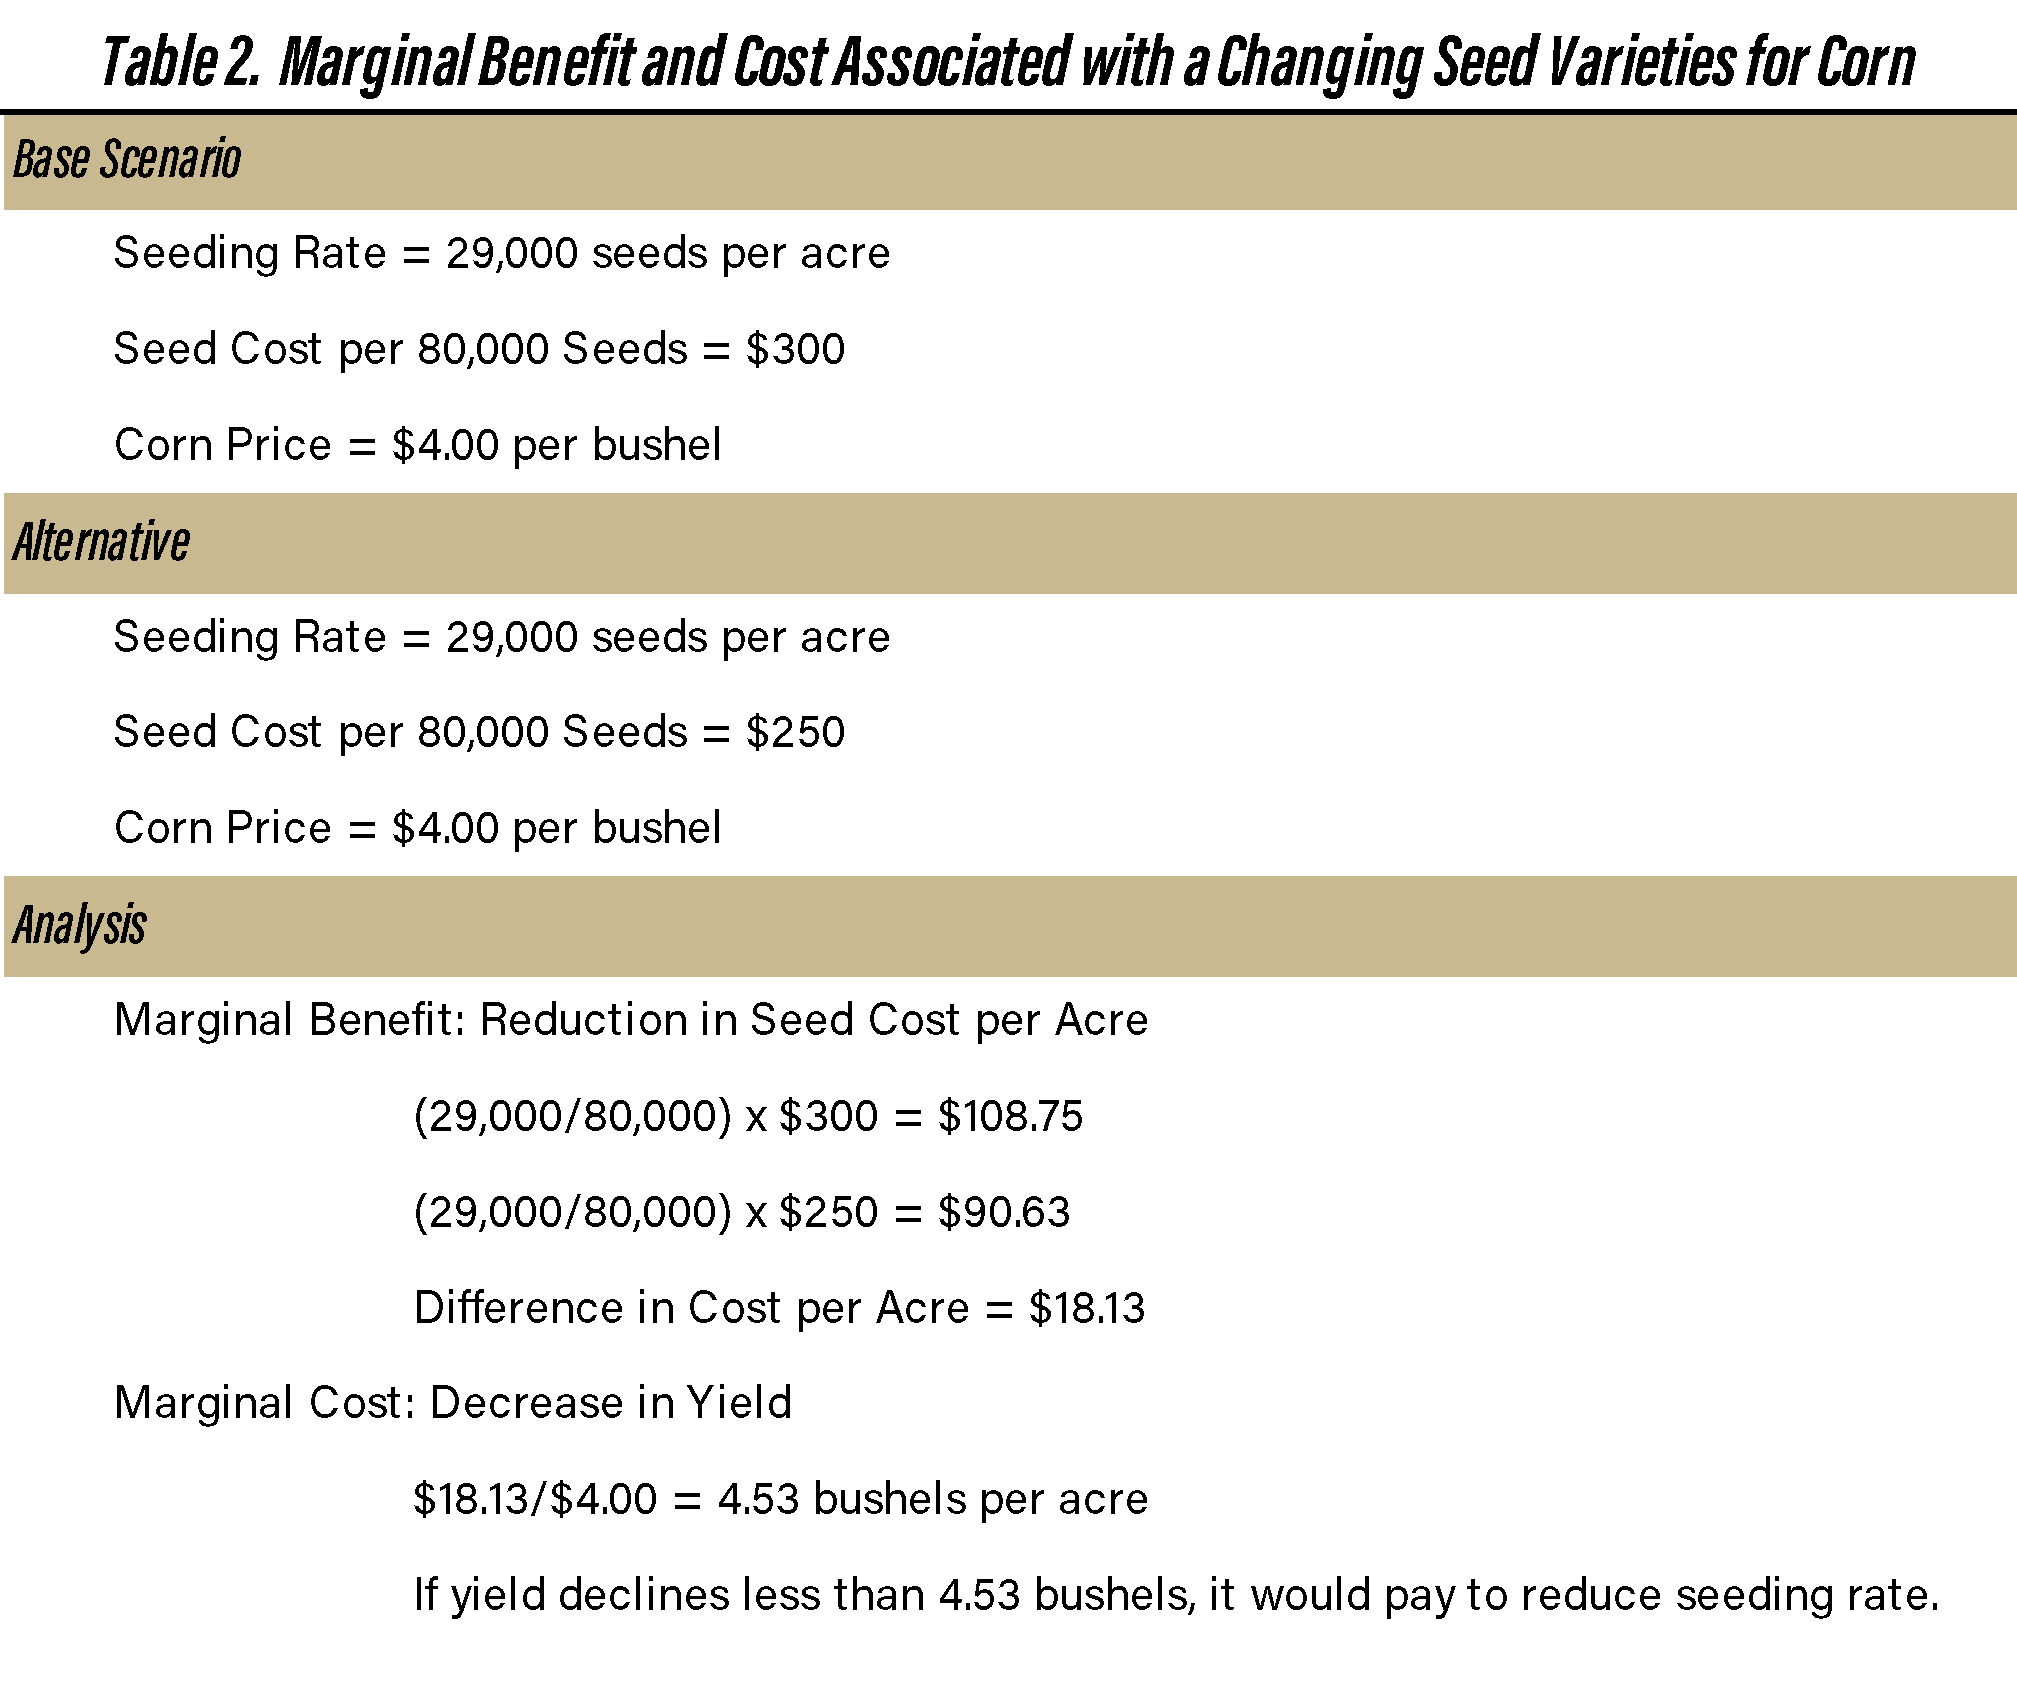
Table 2. Marginal Benefit and Cost Associated with a Changing Seed Varieties for Corn
Table 3 shows the impact of reducing nitrogen fertilizer (i.e., anhydrous ammonia) on corn by 30 pounds. Using a nitrogen price of $0.50 per bushel, cost per acre declined by $15.00 per acre. With a corn price of $4.00 per bushel, if yield per acre declines by less than 3.75 bushels, it would be beneficial to reduce the N rate. The yield decline would depend on corn yield response to nitrogen rates. If the response curve is relatively flat on top, it would be beneficial to reduce the N rate by 30 pounds. Farmers are encouraged to compute the optimal N rates for their region using the Corn Nitrogen Rate Calculator.
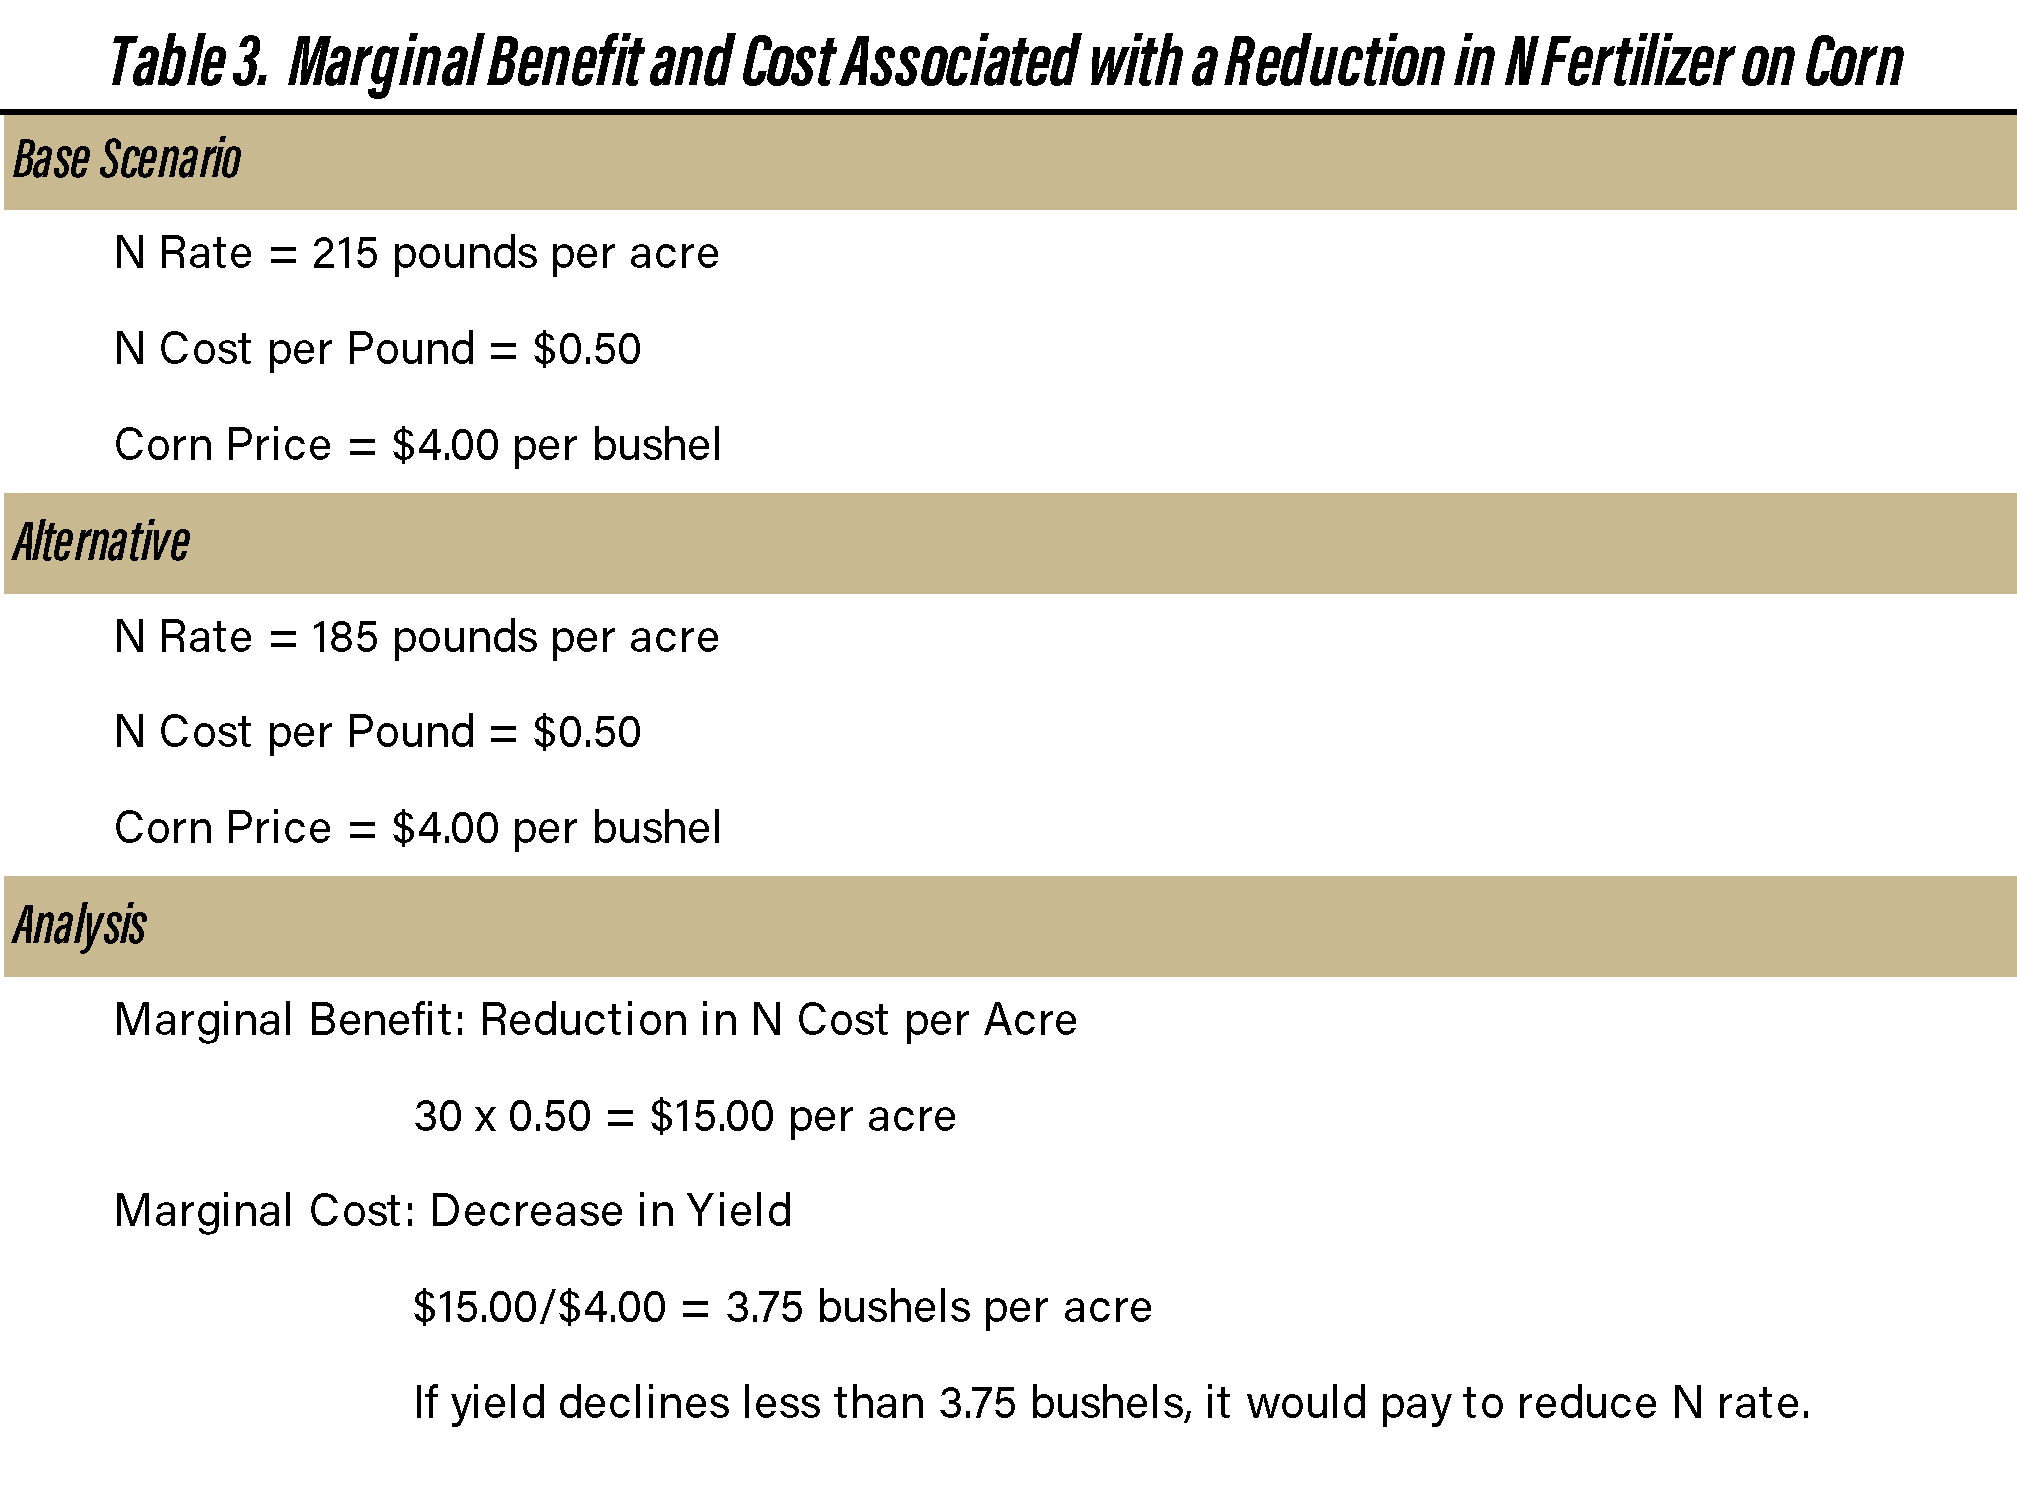
Table 3. Marginal Benefit and Cost Associated with a Reduction in N Fertilizer on Corn
Summary
This article examined how marginal analysis can be used to make input decisions. Marginal analysis involves comparing the benefits of making a change to the costs associated with the change. Even if you are uncertain as to how yield responds to a change in input use, with marginal analysis you can determine how much yield would have to decline to make the input change unattractive. More discussion pertaining to marginal analysis and partial budgeting, which uses marginal analysis, can be found in Kay et al. (2016).
Citations
Corn Nitrogen Rate Calculator, https://www.cornnratecalc.org/, accessed December 10, 2025.
Kay, R.D., W.M. Edwards, and P.A. Duffy. Farm Management, Eighth Edition. New York: McGraw-Hill, 2016.
Langemeier, M. and J. Mintert. “Better Outlook for the Future Pushes Farmer Sentiment Higher.” Ag Economy Barometer, Center for Commercial Agriculture, Purdue University, December 2, 2025.
Nielsen, R.L., D. Quinn, and J. Camberato. “Optimum Plant Populations for Corn in Indiana.” Corny News Network. Purdue University, Agronomy Department, January 12, 2022.
Quinn, D. “Corn Plant Populations and the Potential for Reducing Seed Costs.” The Kernel. Purdue University, Agronomy Department, April 23, 2025.
![]()
![]()
![]()
![]()
![]()
TAGS:
TEAM LINKS:

RELATED RESOURCES
UPCOMING EVENTS
We are taking a short break, but please plan to join us at one of our future programs that is a little farther in the future.