September 10, 2025
Projected Net Income per Acre for West Central Indiana Case Farm
by Michael Langemeier
![]()
![]()
![]()
![]()
![]()
The latest USDA-ERS net farm income forecast for 2025 was $179.8 billion, or $52.0 billion higher than net farm income in 2024 (USDA-ERS, 2025). For a state such as Indiana, which is heavily reliant on corn and soybean receipts, this forecast seems counter-intuitive. However, if we dig deeper into the forecast, we find that while crop receipts are expected to decline $6.1 billion, animal and animal product receipts are projected to increase $30.0 billion. Moreover, government payments are projected to increase $30.4 billion in 2025. Total production expenses are expected to increase $11.9 billion in 2025.
The difference is U.S. price received between crop and livestock enterprises is historically wide. Figure 1 illustrates the monthly index of prices received for crop enterprises and livestock enterprises since 2007, which is used as the base period. The two indices are highly correlated over time with a correlation coefficient of 0.87 since 2007. However, the two indices have diverged since 2024. During 2024, the average livestock price index was 43% higher than the average crop price index. So far in 2025, this difference has increased to 71%.
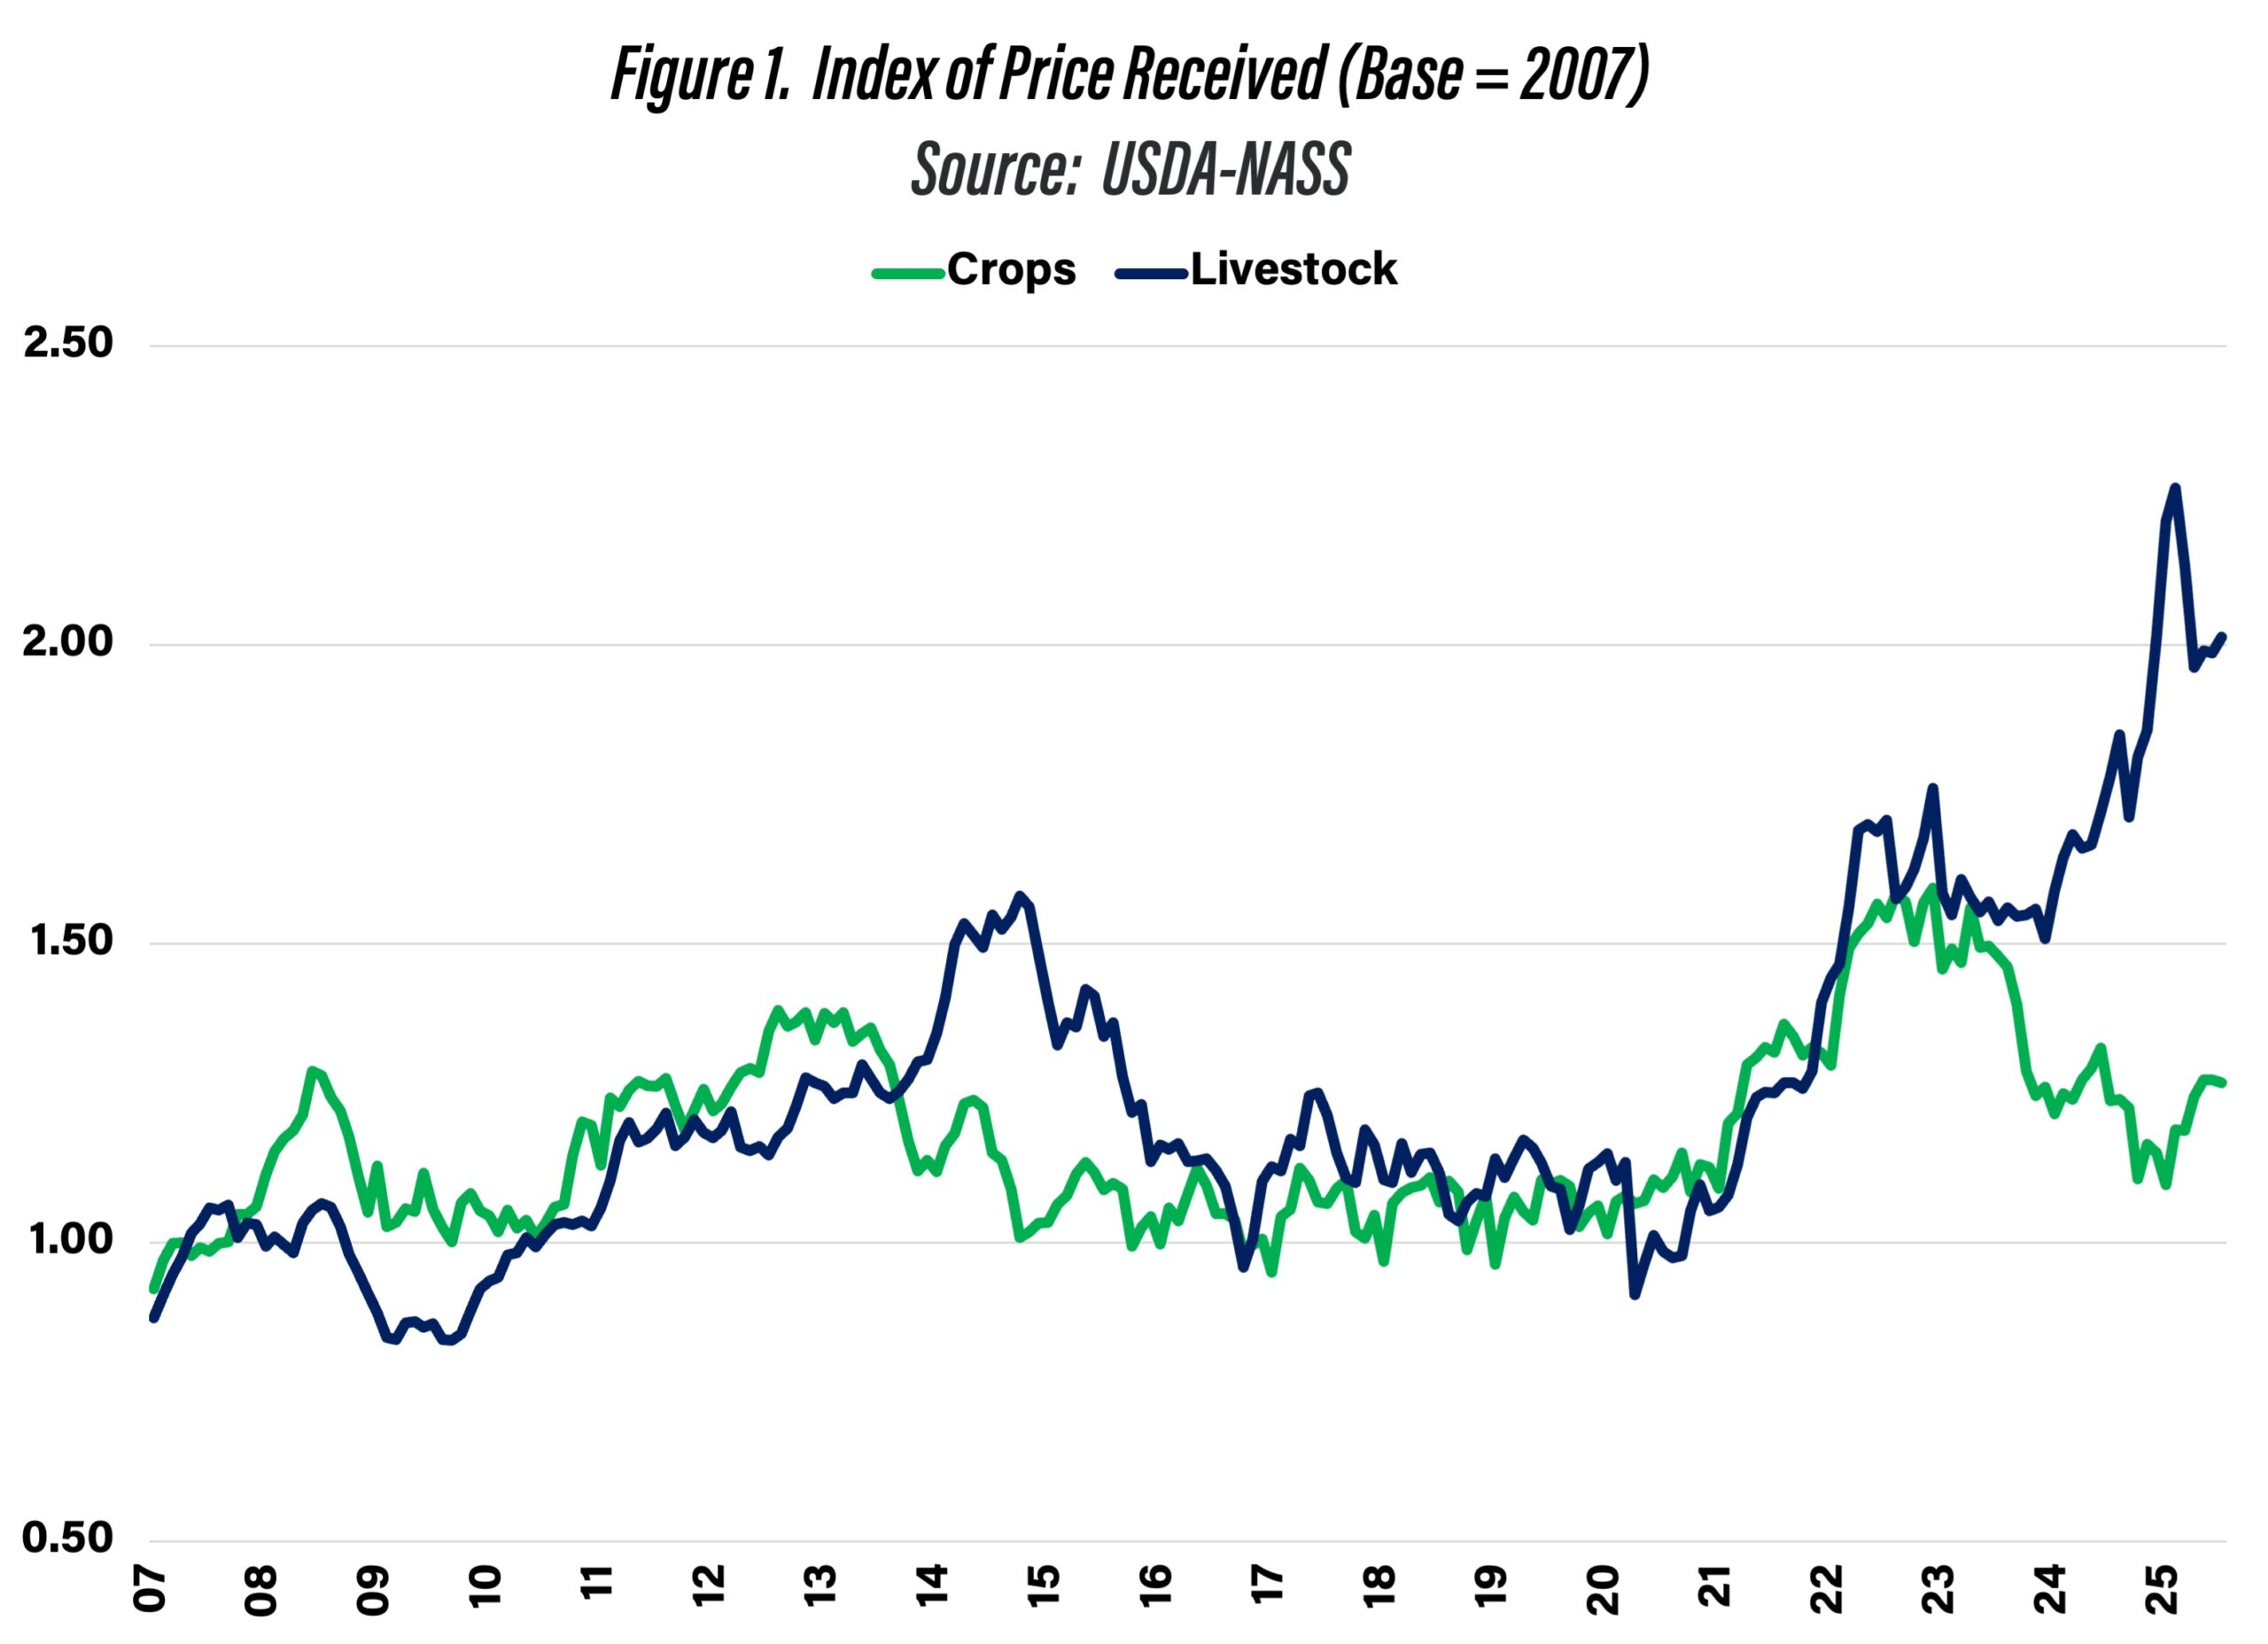
Figure 1. Index of Price Received (Base = 2007)
Source: USDA-NASS
The relatively low projected crop prices combined with input costs that are substantially higher than they were prior to COVID is creating some very low expected net returns. The key question is how low? This article uses an Indiana case farm to illustrate trends in net farm income per acre since 2007, and to project net farm income per acre for 2025 and 2026.
West Central Indiana Case Farm
A case farm in west central Indiana was developed to help illustrate financial statements and key financial metrics, to benchmark cost of production and net returns with typical farms across the globe, and to discuss trends and projections in net farm income and net return to land per acre. The case farm has 3000 acres of corn and soybeans, which are grown in rotation. The farm owns approximately 30% of its total acres. The rest of the acreage is rented from multiple landlords using fixed cash rent arrangements. Liquidity and solvency are strong, and financial performance is typically above average. The projections for 2025 and 2026 assume that production costs are similar to those reported in the Purdue crop budgets, trend yields, and a marketing strategy which sells a portion of the crop at harvest and the remainder after the first of the year. The farm is expected to receive payments from the ARC-CO program for the 2025 and 2026 crops.
Projected Net Farm Income per Acre
Figure 2 presents the trend in net farm income per acre since 2007, as well as projections for 2025 and 2026. The average net farm income since 2007 is $125 per acre. Net farm income is used for operator and family labor, to repay term debt, and for down payments on machinery, buildings, and land. After averaging over $325 per acre in 2021 and 2022, net farm income per acre dropped to $115 in 2023 and was negative in 2024. Net farm income per acre is expected to remain negative for 2025 and 2026, putting a strain on the farm’s ability to cover operator and family labor, repay debt, and replace machinery.
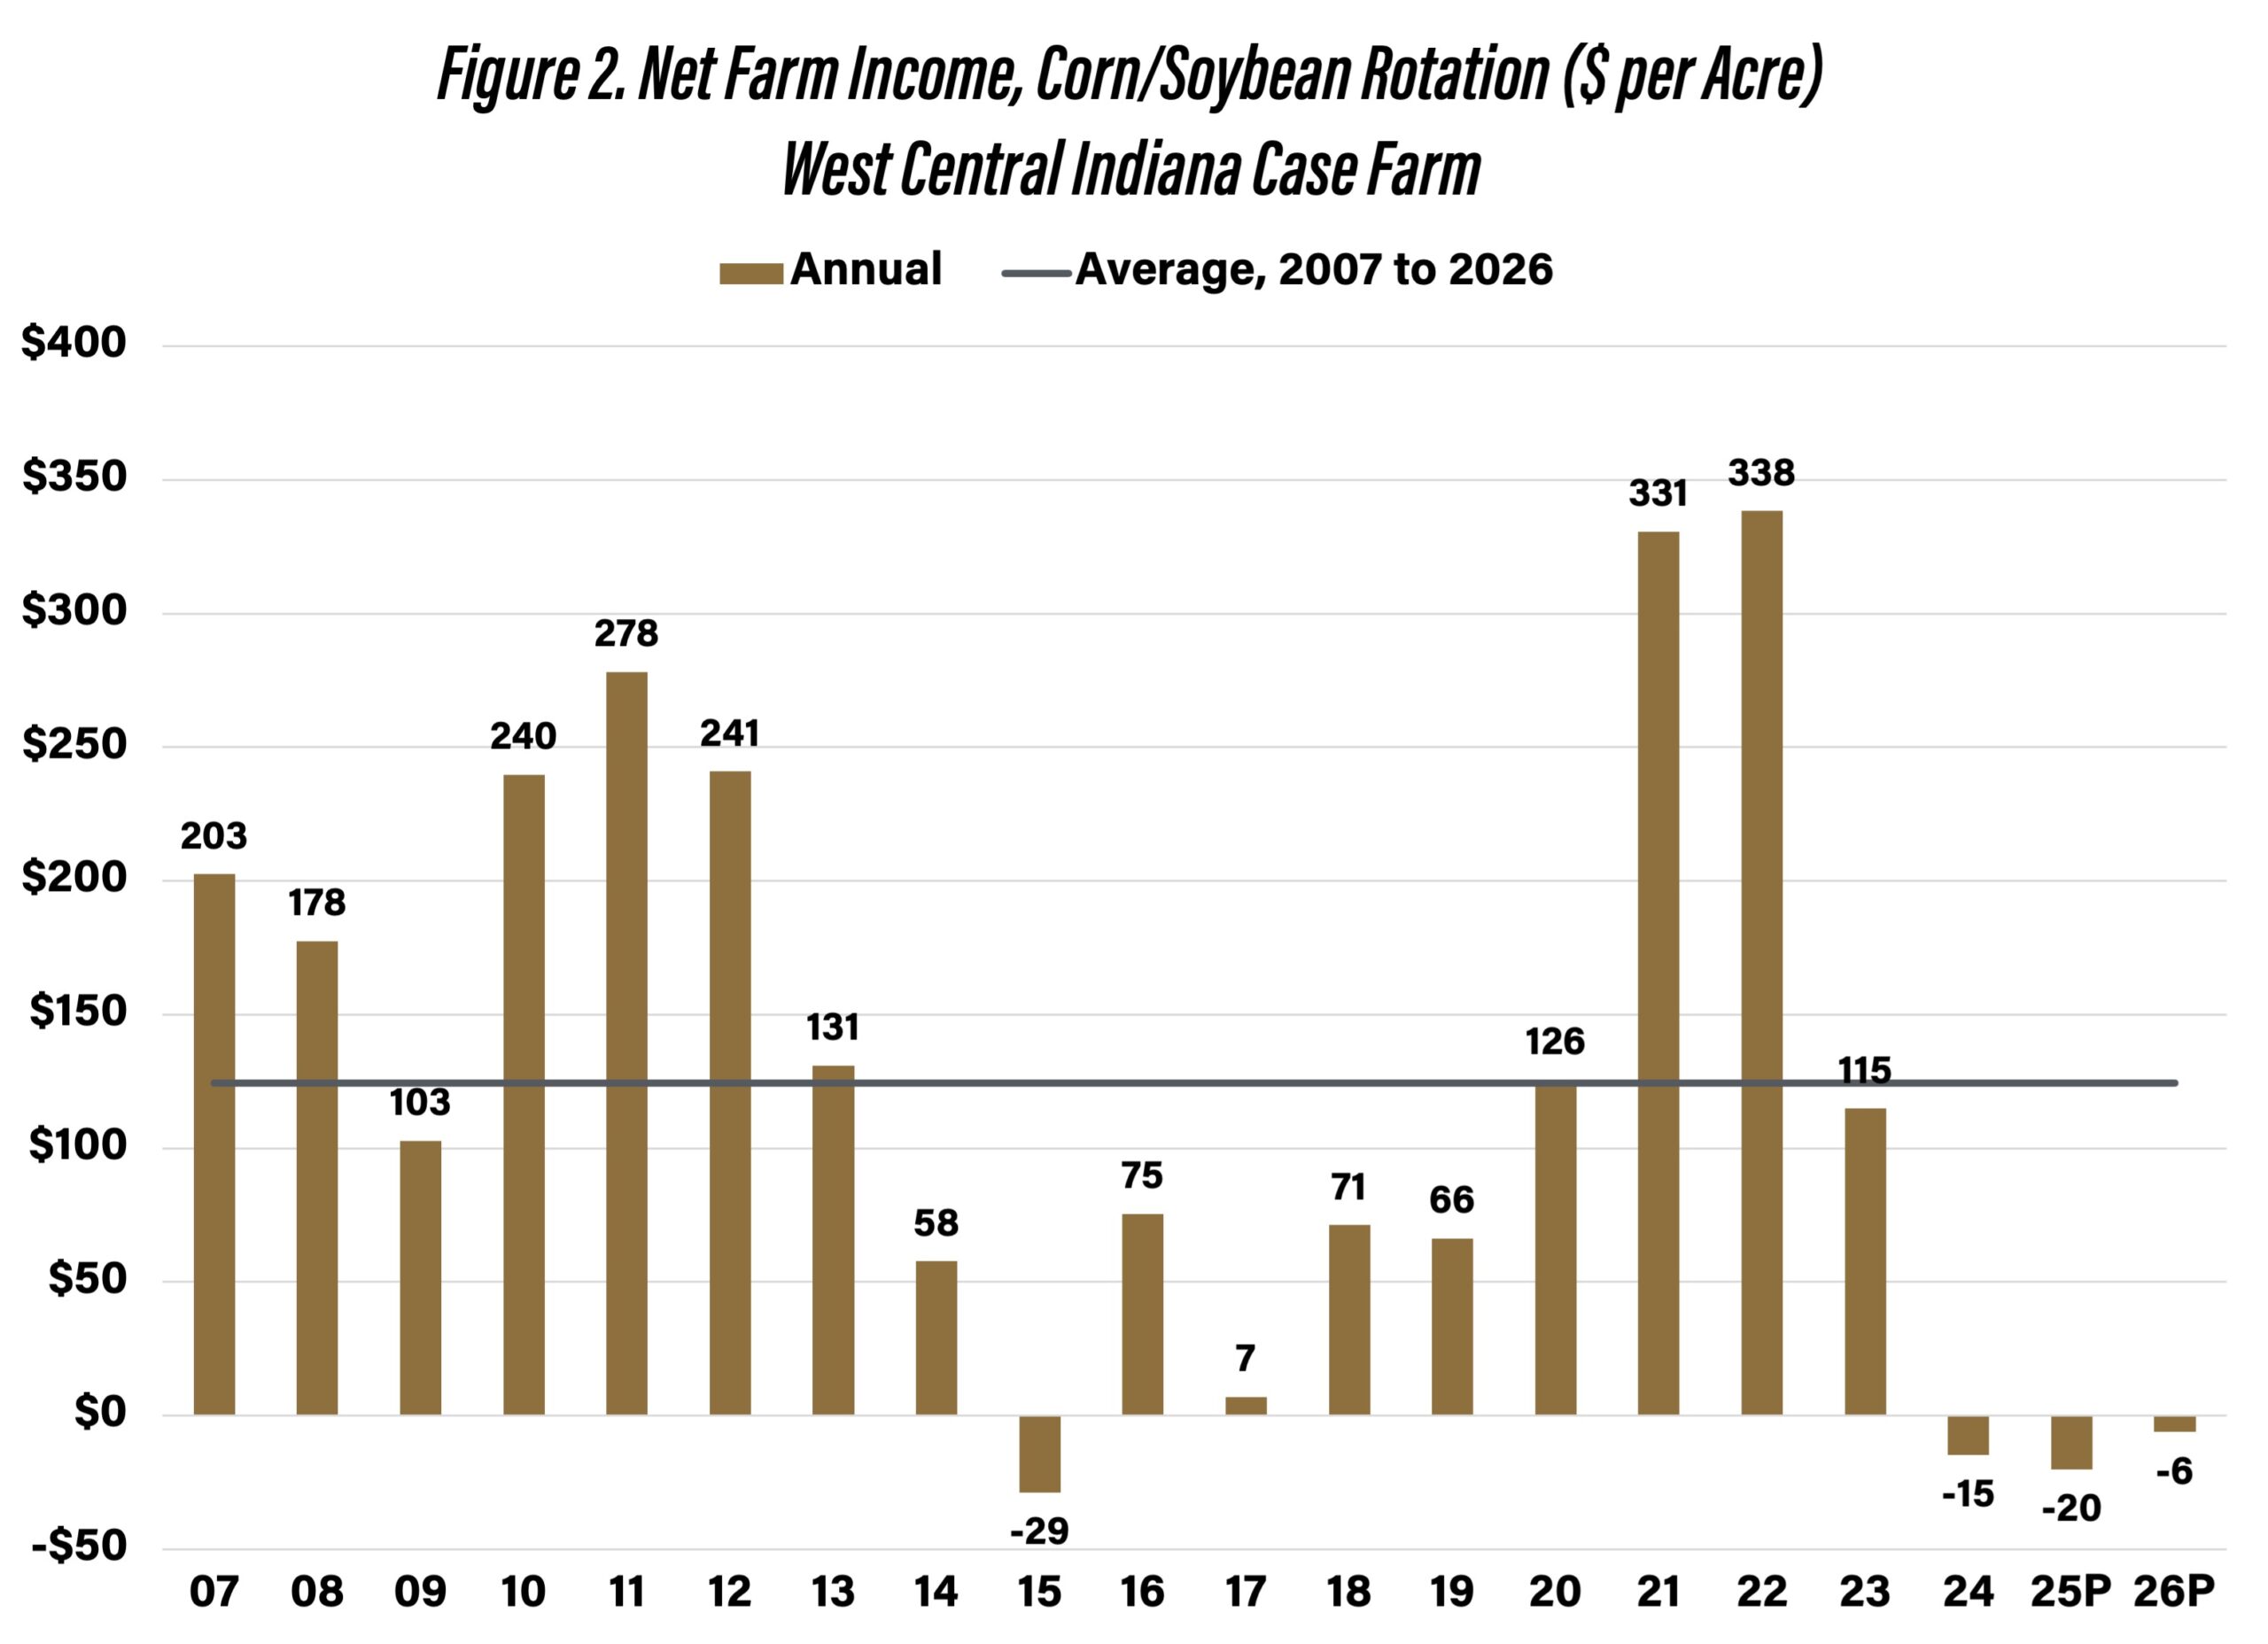
Figure 2. Net Farm Income, Corn/Soybean Rotation ($ per Acre), West Central Indiana Case Farm
Conclusions
After two strong net farm income years in 2021 and 2022, net farm income has been below average. Current projections for 2025 and 2026 suggest that net farm income will remain below average through at least 2026. Low net farm income has a large impact on repayment measures. To compute the capital debt repayment margin, which reflects a farm’s ability to repay term debt, we add depreciation, a non-cash expense, to net farm income. The projected capital debt repayment margin is expected to be positive in 2025. However, net farm income plus depreciation is not sufficient to fully replace machinery and equipment or to provide much of a down payment towards asset purchases.
![]()
![]()
![]()
![]()
![]()
TAGS:
TEAM LINKS:

RELATED RESOURCES
UPCOMING EVENTS
We are taking a short break, but please plan to join us at one of our future programs that is a little farther in the future.