September 22, 2025
U.S. Soybean Harvest Starts with No Sign of Chinese Buying as Brazil Sets Export Record
by Joana Colussi and Michael Langemeier
![]()
![]()
![]()
![]()
![]()
The U.S. soybean harvest began in September without any orders from the world’s largest buyer: China. American producers are harvesting a crop the U.S. Department of Agriculture (USDA) estimates at 4.3 billion bushels, and there is no indication of when shipments to China will resume. In a typical year, China buys more than half of all U.S. soybean exports. Meanwhile, Brazil set a record for shipments to China from January through August 2025. In this article, we present U.S. and Brazilian soybean trade flows to China during the last two years, analyze the trade relationship between these countries dating back to before the first round of the 2018 trade war, and consider the possible consequences if a trade deal is not reached this fall.
U.S. Soybean Shipments Frozen Over Tariffs
China is the top buyer of U.S. soybeans by a large margin. In 2024, the United States shipped nearly 985 million bushels to China, accounting for 51% of the nation’s total soybean exports that year. In 2025, U.S. soybean exports to China from January through August totaled only 218 million bushels – 29% of total exports for the period. In June, July, and August, shipments to China were effectively zero (see Figure 1).
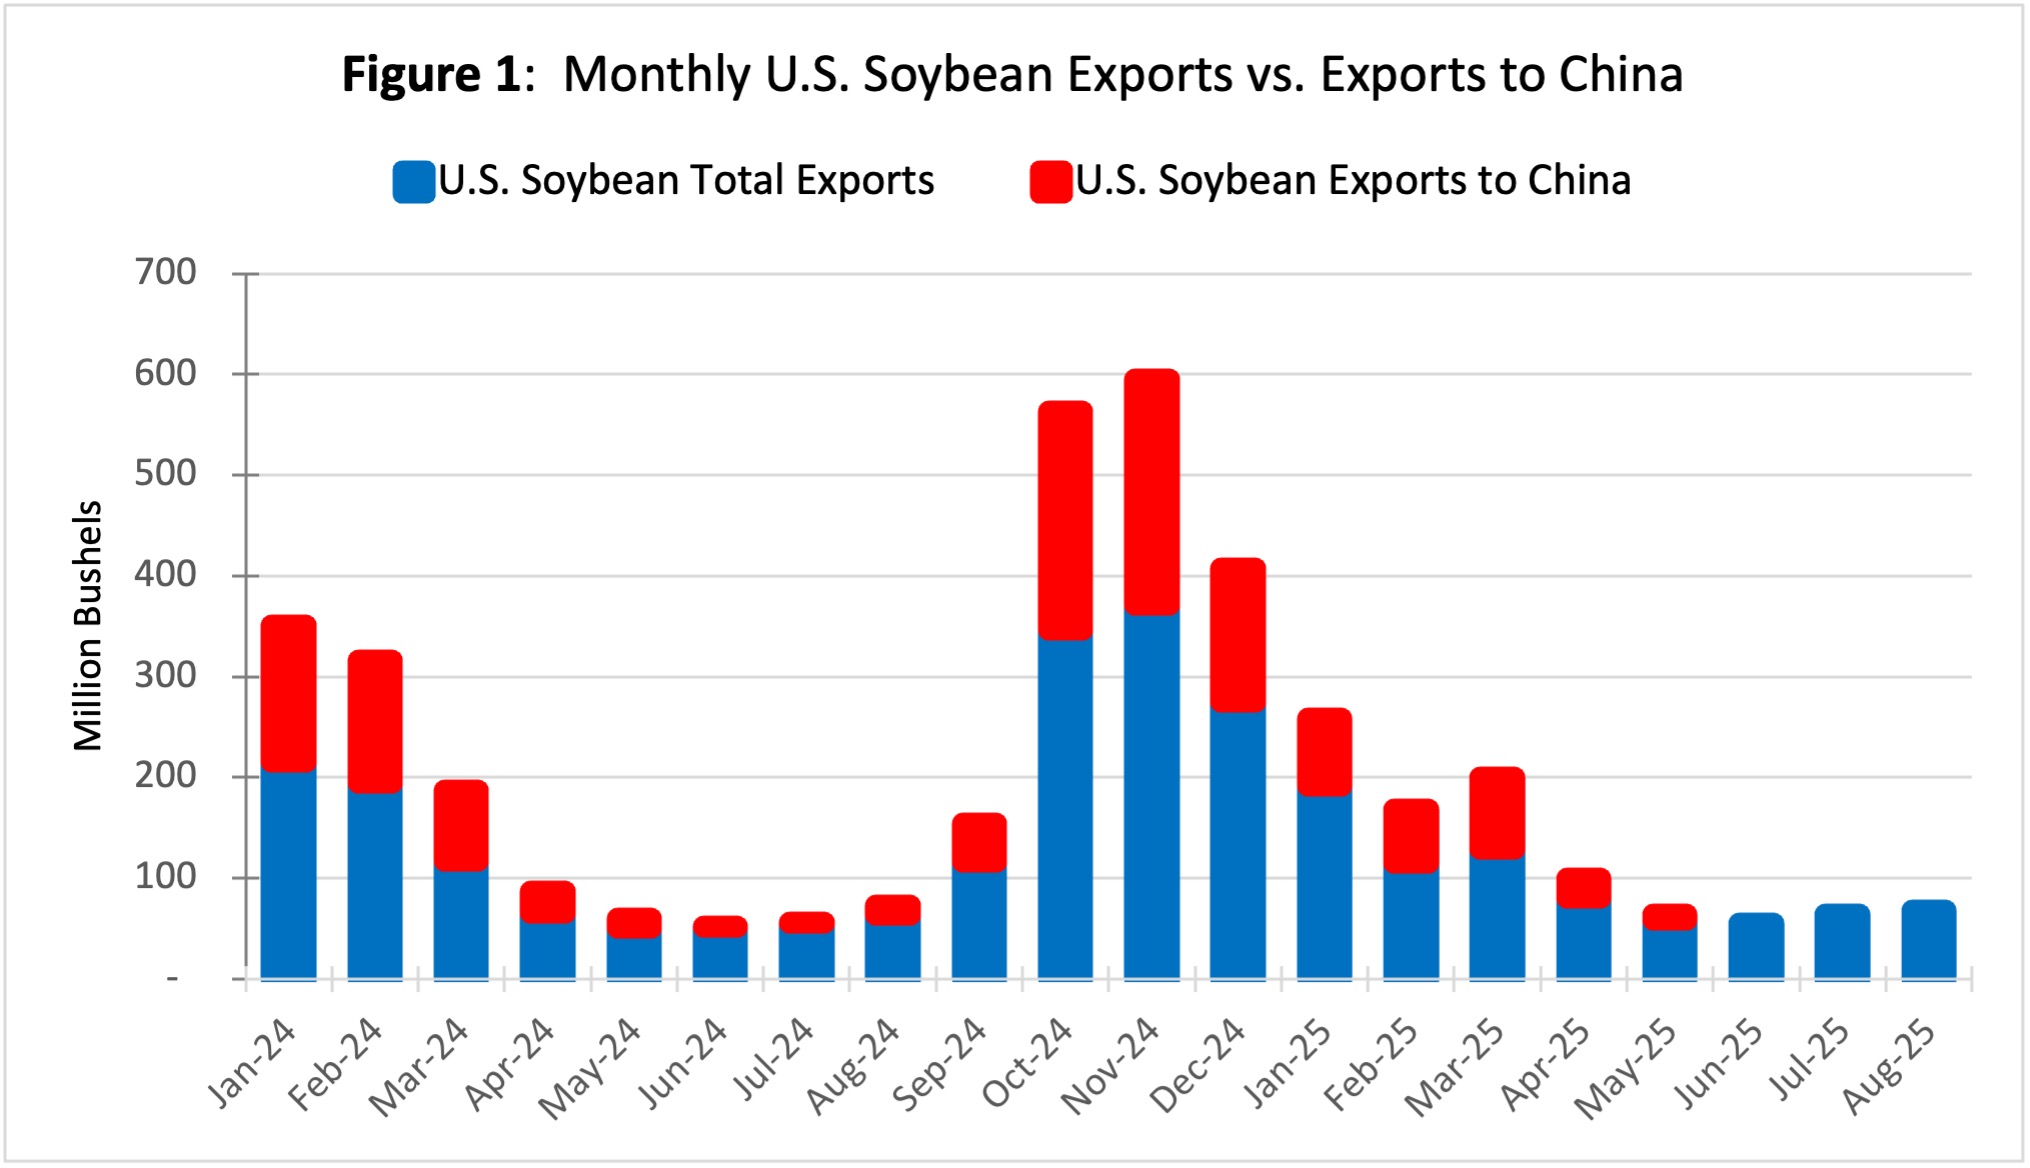
Figure 1: Monthly U.S. Soybean Exports vs. Exports to China
Source: Foreign Agricultural Service (FAS), USDA
The combination of a 20% retaliatory tariff and China’s Value-Added Tax (VAT) and Most-Favored-Nation (MFN) duties has pushed the overall duty rate on U.S. soybeans to 34% in 2025. Although this new retaliatory rate is 5% lower than during the 2018 trade war, the added duties should keep U.S. soybean prices higher than South American supplies ahead of the U.S. harvest this fall, stated the American Soybean Association in a letter sent to the White House in August.
With harvest already underway in some areas, U.S. producers are concerned about their ability to market the crop, especially given the limited grain storage capacity in their bins and the projection of a record corn harvest – surpassing 16 billion bushels for the first time. In parts of the Midwest, grain production may outpace available storage space. This situation could pressure harvest basis levels and create a greater demand for temporary storage.
Record Chinese Demand for Brazilian Soybeans
While U.S. farmers await a potential trade deal to access the Chinese market again, Brazil exported a record 2.474 billion bushels of soybeans to China from January through August this year, according to the Foreign Trade Secretariat (Secex/Brazil). This volume represented 76% of Brazil’s total soybean exports during the period. In August alone, China purchased 290 million bushels from Brazil, setting a monthly record with an 85% share of Brazil’s soybean exports (see Figure 2).
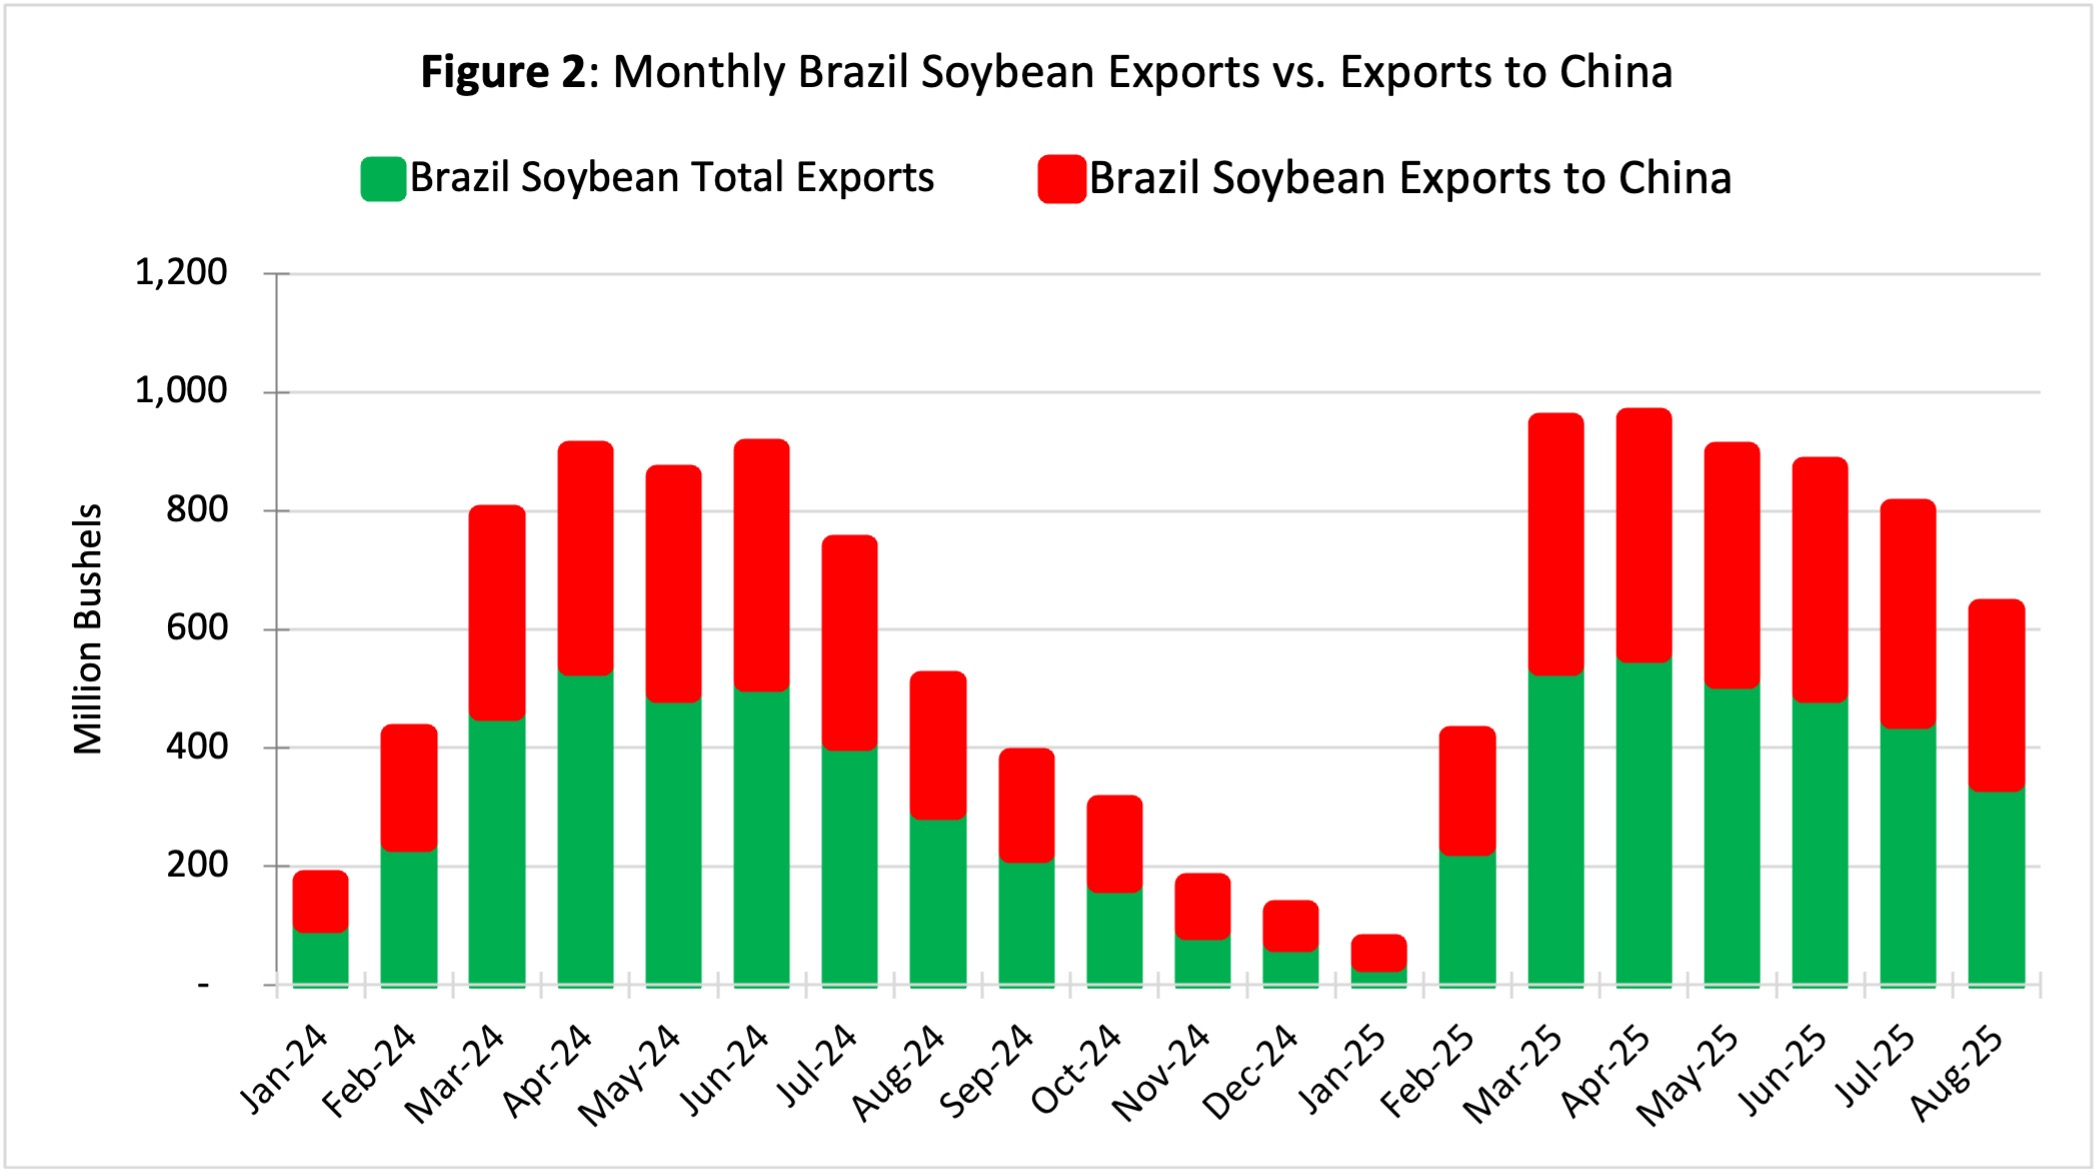
Figure 2: Monthly Brazil Soybean Exports vs. Exports to China
Source: Brazilian Foreign Trade Secretariat (Secex/Brazil)
China’s current share of Brazil’s soybean exports is historically high – comparable only to 2018, when President Trump launched the first trade war with China. The difference is that since then, Brazil’s soybean production has surged by 40%, meaning the volumes involved today are far larger. From the 2017/18 to the 2024/25 crop season, Brazil jumped its soybean production from 4.5 billion bushels to 6.3 billion bushels, according to the National Supply Company (Conab) – Brazil’s food supply and statistics agency.
China’s soybean imports have climbed to a record level in the last three months, raising speculation that buyers may be accelerating shipments to avoid sourcing from the United States. In August, China imported a record 451 million bushels, with no shipments coming from the United States. From May through August of this year, China imported 1.837 billion bushels of soybeans, according to the China General Administration of Customs, with roughly 90% of those purchases coming from Brazil’s record crop.
This context has directly influenced soybean prices in Brazil’s domestic market. While U.S. soybean prices are falling because of China’s embargo, Brazilian prices have been climbing since March – about the time Chinese buyers began purchasing big volumes of Brazilian soybeans. Even after a record harvest, finished in May, soybean export premiums at Brazilian ports remain unusually high for this time of year, helping to offset lower international prices and the depreciation of the U.S. dollar against the Brazilian real.
Shifting Soybean Global Trade Patterns
China drives the global soybean trade, accounting for about 60% of worldwide imports. In 2024, 23% of U.S. soybean production and 48% of Brazil’s production were exported to China. Historically, the United States has been one of China’s main suppliers, but this trend has shifted over the past decade (see farmdoc daily, February 20, 2024). From 2011 to 2017 – the seven years preceding the trade war – U.S. exports to China averaged 60% of total U.S. soybean exports. In the seven years following the trade war, from 2018 to 2024, that share declined to an average of 47%. During the same period, Brazil’s average share increased slightly from 73% to 74% (see Figure 3).
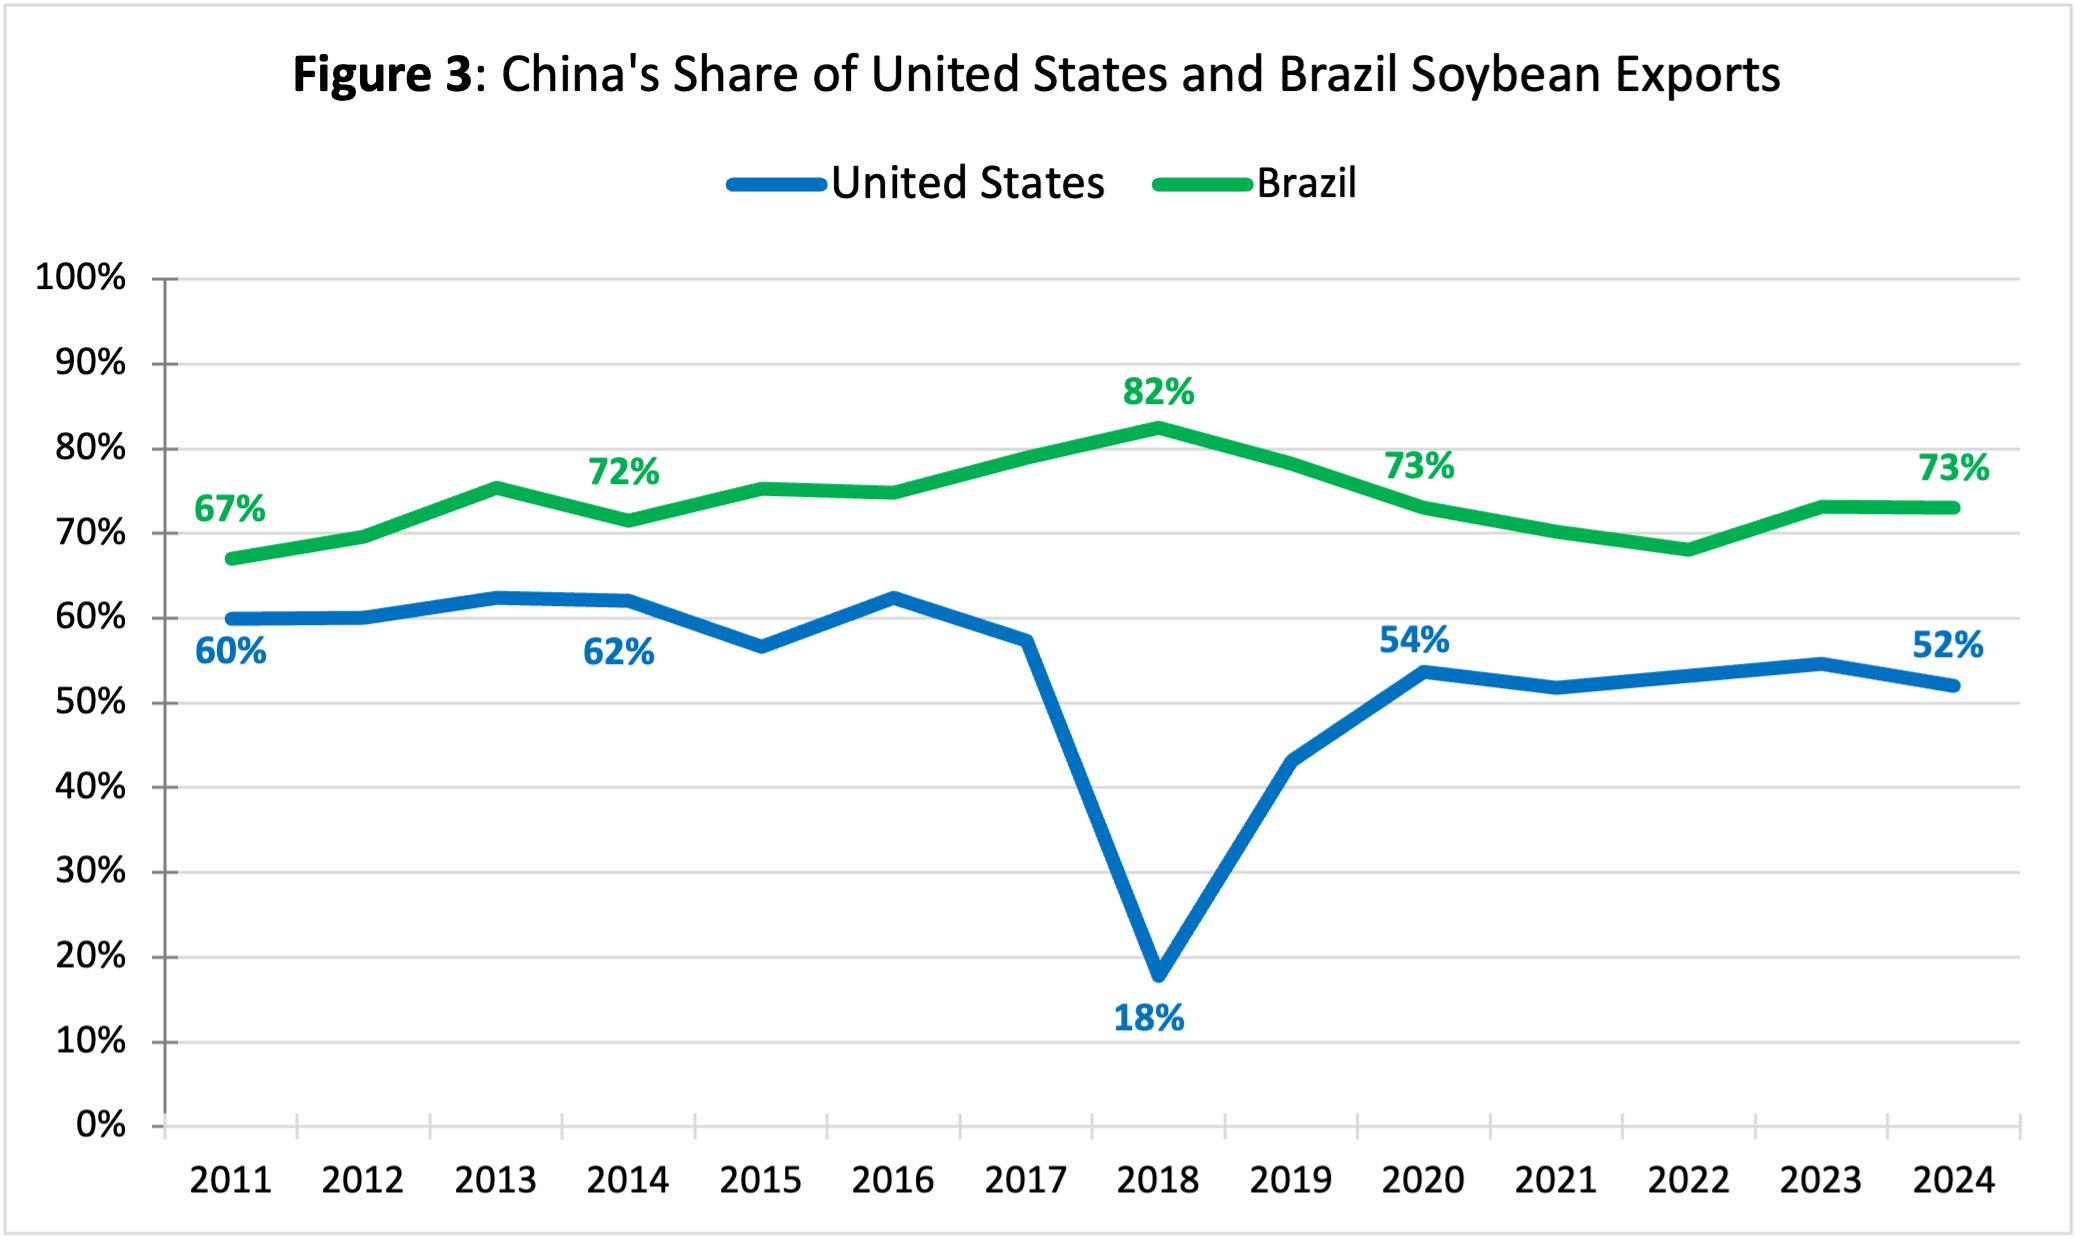
Figure 3: China’s Share of United States and Brazil Soybean Exports
Note: Exports by calendar year since the countries have different marketing years
Source: USDA and Secex/Brazil
China’s share of U.S. soybean exports has been rising since 2020 but has not fully returned to pre–trade war levels, and in 2025, it now risks dropping sharply again. If no deal is reached in the coming weeks, Brazil’s exports to China are expected to rise to levels last seen in 2018. As China increased its soybean purchases from Brazil, the two countries’ interdependence is deepening, raising questions about whether their agricultural ties represent greater opportunity or growing overdependence (see farmdoc daily, May 7, 2025).
The United States was the world’s top soybean exporter for many years. In 2013, Brazil overtook the U.S. in soybean shipments for the first time, following one of the country’s last major droughts. Since then, Brazil’s share of the global soybean trade has steadily expanded, with exports reaching 3.63 billion bushels in 2024, according to Secex/Brazil data. That same year, U.S. soybean exports totaled 1.93 billion bushels, according to the USDA (see Figure 4).
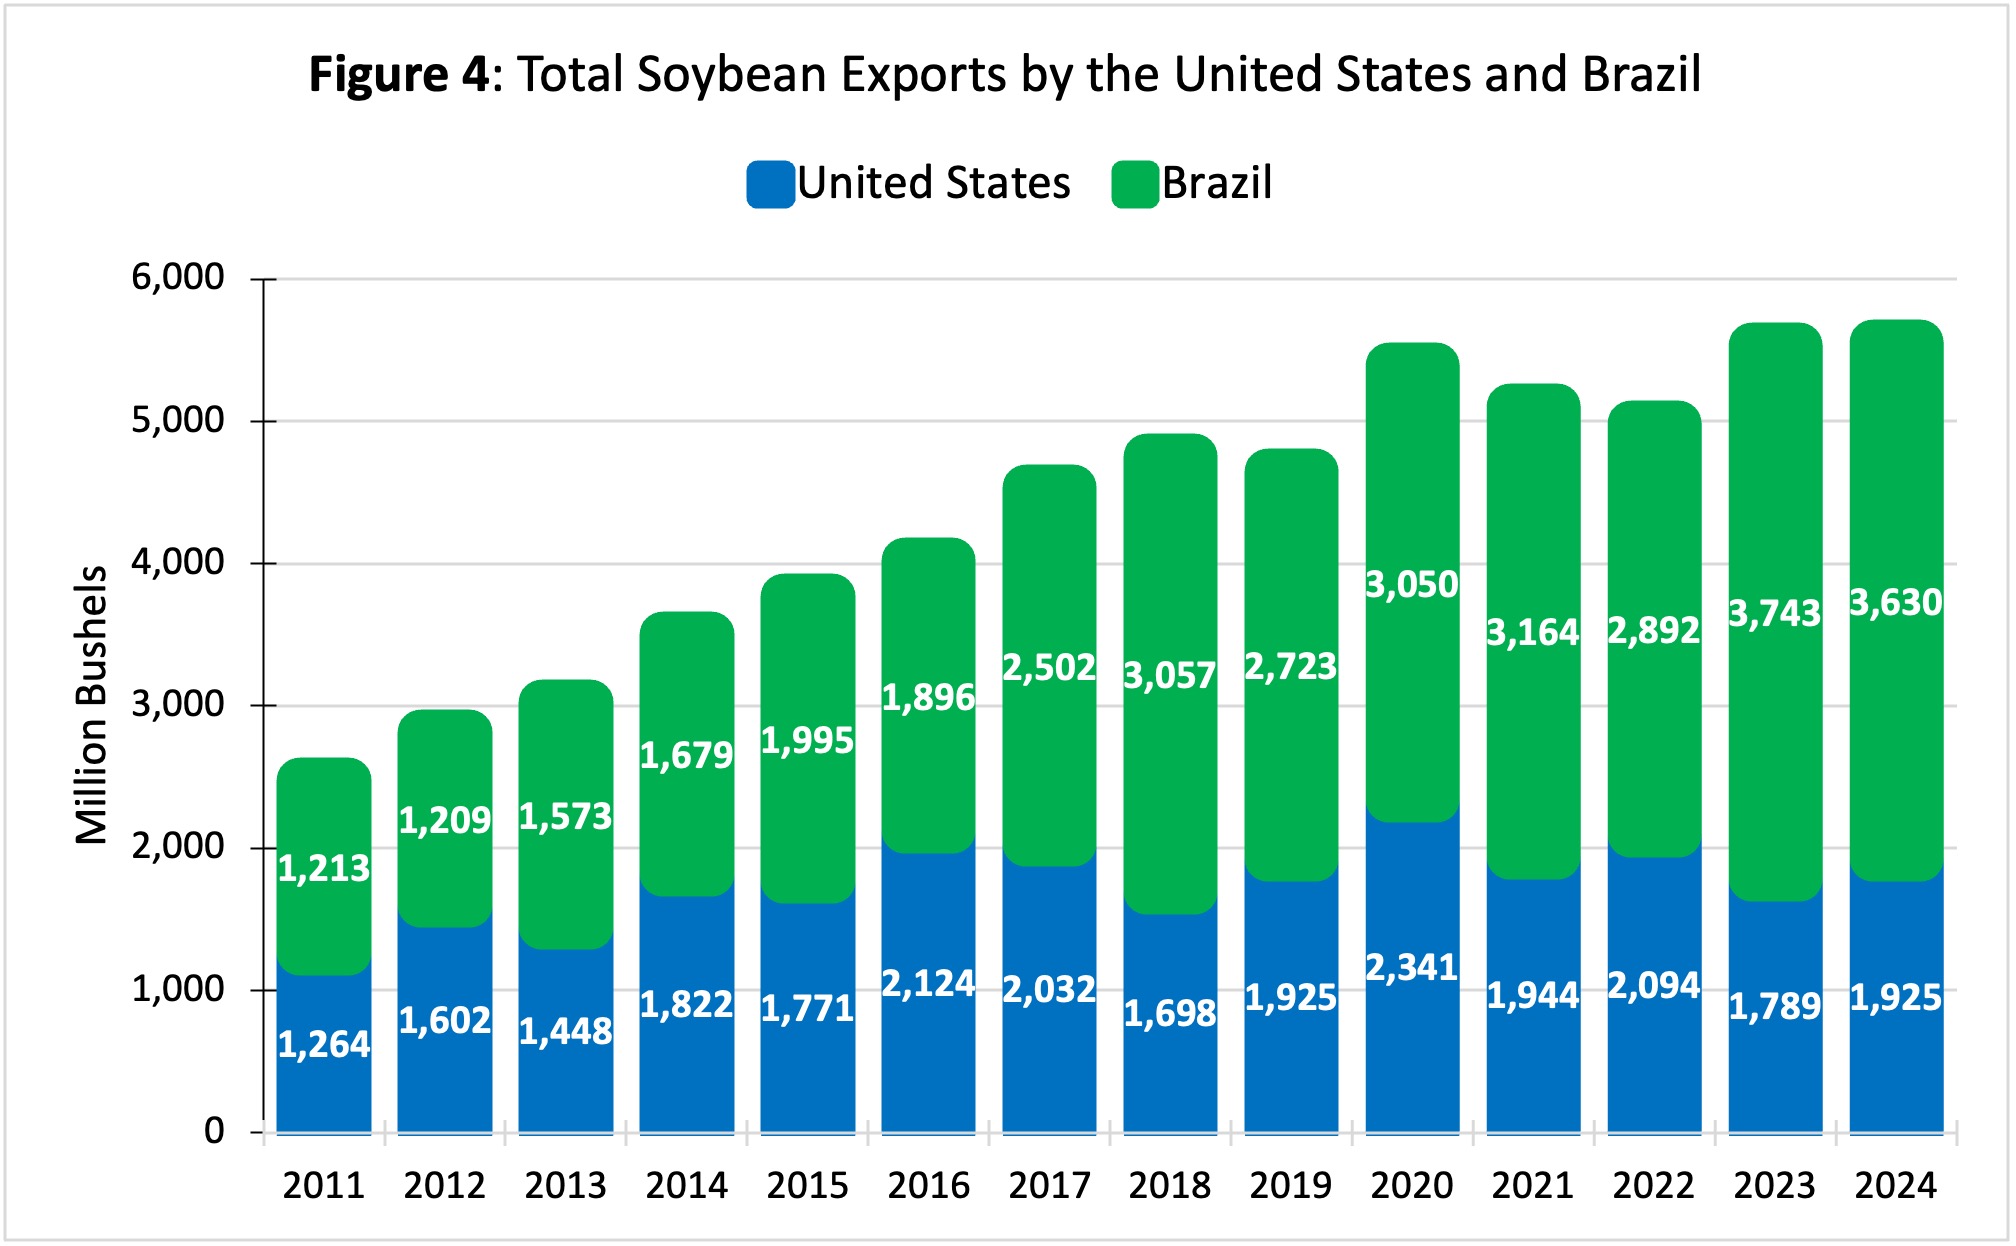
Figure 4: Total Soybean Exports by the United States and Brazil
Note: Exports by calendar year since the countries have different marketing years
Source: USDA and Secex/Brazil
It is important to note that the United States’ reduced role in global soybean markets reflects not only weaker trade ties with China but also rising domestic demand. Soybean crush capacity in the United States has been growing since 2020. This expansion is primarily fueled by the increasing demand for soybean oil, particularly from the renewable diesel sector. In the past five years, the renewable diesel boom has spurred new demand for soybean oil as a feedstock in the production of biofuels (see farmdoc daily, September 10, 2025).
Although Brazil has also been increasing biodiesel production in recent years, driven by government incentive policies, the country has likewise expanded its soybean acreage, particularly by converting degraded pastureland into cropland in the Brazilian savanna, the Cerrado. Looking to the future, a study based on geospatial databases and led by the Brazilian Agricultural Research Corporation (Embrapa) shows that Brazil has the potential to convert an additional 70 million acres of pastureland to crop production (Bolfe et al., 2024).
Potential Consequences of a Failed U.S.–China Trade Deal
If a trade deal isn’t reached this fall, U.S. soybean producers reliant on Chinese buyers could suffer significant losses, adding even more financial stress to crop farms. Rising input expenses, such as fertilizer, chemicals, and seed, combined with declining domestic prices, are already shrinking profits. Moreover, many producers may be forced to store their harvested soybeans rather than sell at steep losses, impacting the entire supply chain – from grain elevators and processors to the rail network that moves the crop across the country.
Even before the recent hiccup in U.S. soybean exports, net returns were projected to be relatively low. The current export situation magnifies the problem. Some relief might come from federal government payments to producers, as happened during the first round of trade war, but in many cases, that assistance may not be enough to prevent an uptick in financial stress. In the medium term, the prolonged uncertainty could disrupt planting decisions for the growing season of 2026 and reduce farmers’ capacity to repay term debt and invest in their farm operations.
While U.S. soybean exports to China decline, further eroding the market share lost during the 2018 trade war, Chinese buyers are expected to keep shifting purchases to Brazil and other suppliers. As a result, Brazil and other South American producers such as Argentina, Paraguay, and Bolivia may increase soybean acreage as early as this year, with planting for the 2025/26 crop beginning soon across the Southern Hemisphere.
Moreover, Argentina’s announcement that it will remove export taxes (called retenciones, in Spanish) on all grains until October 31, in an effort to boost its dollar supply, is expected to spur additional exports from the world’s third-largest exporter of soybeans and the leading exporter of soybean meal and oil. This move will give China yet another attractive option for purchasing soybeans and related products on the global market this fall.
References
American Soybean Association. 2025. “Soybeans Without a Buyer: The Export Gap Hurting U.S. Farms.” August. PDF. https://soygrowers.com/wp-content/uploads/2025/08/China-Trade-Paper-FINAL.pdf
Bolfe, É. L., Victoria, D. D. C., Sano, E. E., Bayma, G., Massruhá, S. M. F. S., & de Oliveira, A. F. (2024). Potential for Agricultural Expansion in Degraded Pasture Lands in Brazil Based on Geospatial Databases. Land, 13(2), 200. https://doi.org/10.3390/land13020200
Colussi, J., G. Schnitkey, N. Paulson and J. Coppess. “Brazil and China’s Strong Ag Relationship: Opportunity or Overdependence?” farmdoc daily (15):85, Department of Agricultural and Consumer Economics, University of Illinois at Urbana-Champaign, May 7, 2025.
Colussi, J., G. Schnitkey, J. Janzen and N. Paulson. “The United States, Brazil, and China Soybean Triangle: A 20-Year Analysis.” farmdoc daily (14):35, Department of Agricultural and Consumer Economics, University of Illinois at Urbana-Champaign, February 20, 2024.
Janzen, J., S. Irwin and Y. Wang. “The Soybean Industry Response to the Renewable Diesel Boom, Part 2: Squeezing More Oil from the Soybean Crush.” farmdoc daily (15):165, Department of Agricultural and Consumer Economics, University of Illinois at Urbana-Champaign, September 10, 2025.
Langemeier, M., M. Boehlje and J. Colussi. “Financial Stress on Crop Farms: Who Is Most at Risk in the 2024–26 Downturn?” Center for Commercial Agriculture, Purdue University, September 3, 2024.
![]()
![]()
![]()
![]()
![]()
TAGS:
TEAM LINKS:


RELATED RESOURCES
UPCOMING EVENTS
We are taking a short break, but please plan to join us at one of our future programs that is a little farther in the future.