December 17, 2025
U.S. Corn & Soybean Exports: Diversification Drives Growth in Corn & Cushions Decline in Soybeans
by Lourival Monaco, Joana Colussi, and Michael Langemeier
![]()
![]()
![]()
![]()
![]()
The U.S. agricultural export scenario has experienced a transformation in 2025, with diversification of export destinations emerging as an important factor for both the corn and soybean markets. Analysis of USDA export data through October 2025, shows distinct patterns of market evolution with implications for U.S. crop producers and the agricultural economy. While these two major commodities have followed different trajectories, with corn exports expanding and soybean exports contracting, both demonstrate the strategic value of diversified market portfolios rather than keeping a high dependence on a single market.
New Markets Softens the Impact of Soybean Declining Volumes
The biggest change in U.S. soybean exports between 2024 and 2025 has been the diversification of destination markets. While 2025 soybean export totals are tracking below 2024 levels, and given historical seasonal patterns, are unlikely to reach last year’s volumes even with November and December data, the diversification has helped moderate what could have been a far more severe reduction. In 2024, China accounted for 46.7% of U.S. soybean exports. The European Union held the second position at 9.9%, followed by Mexico at 8.6% (see Figure 1).
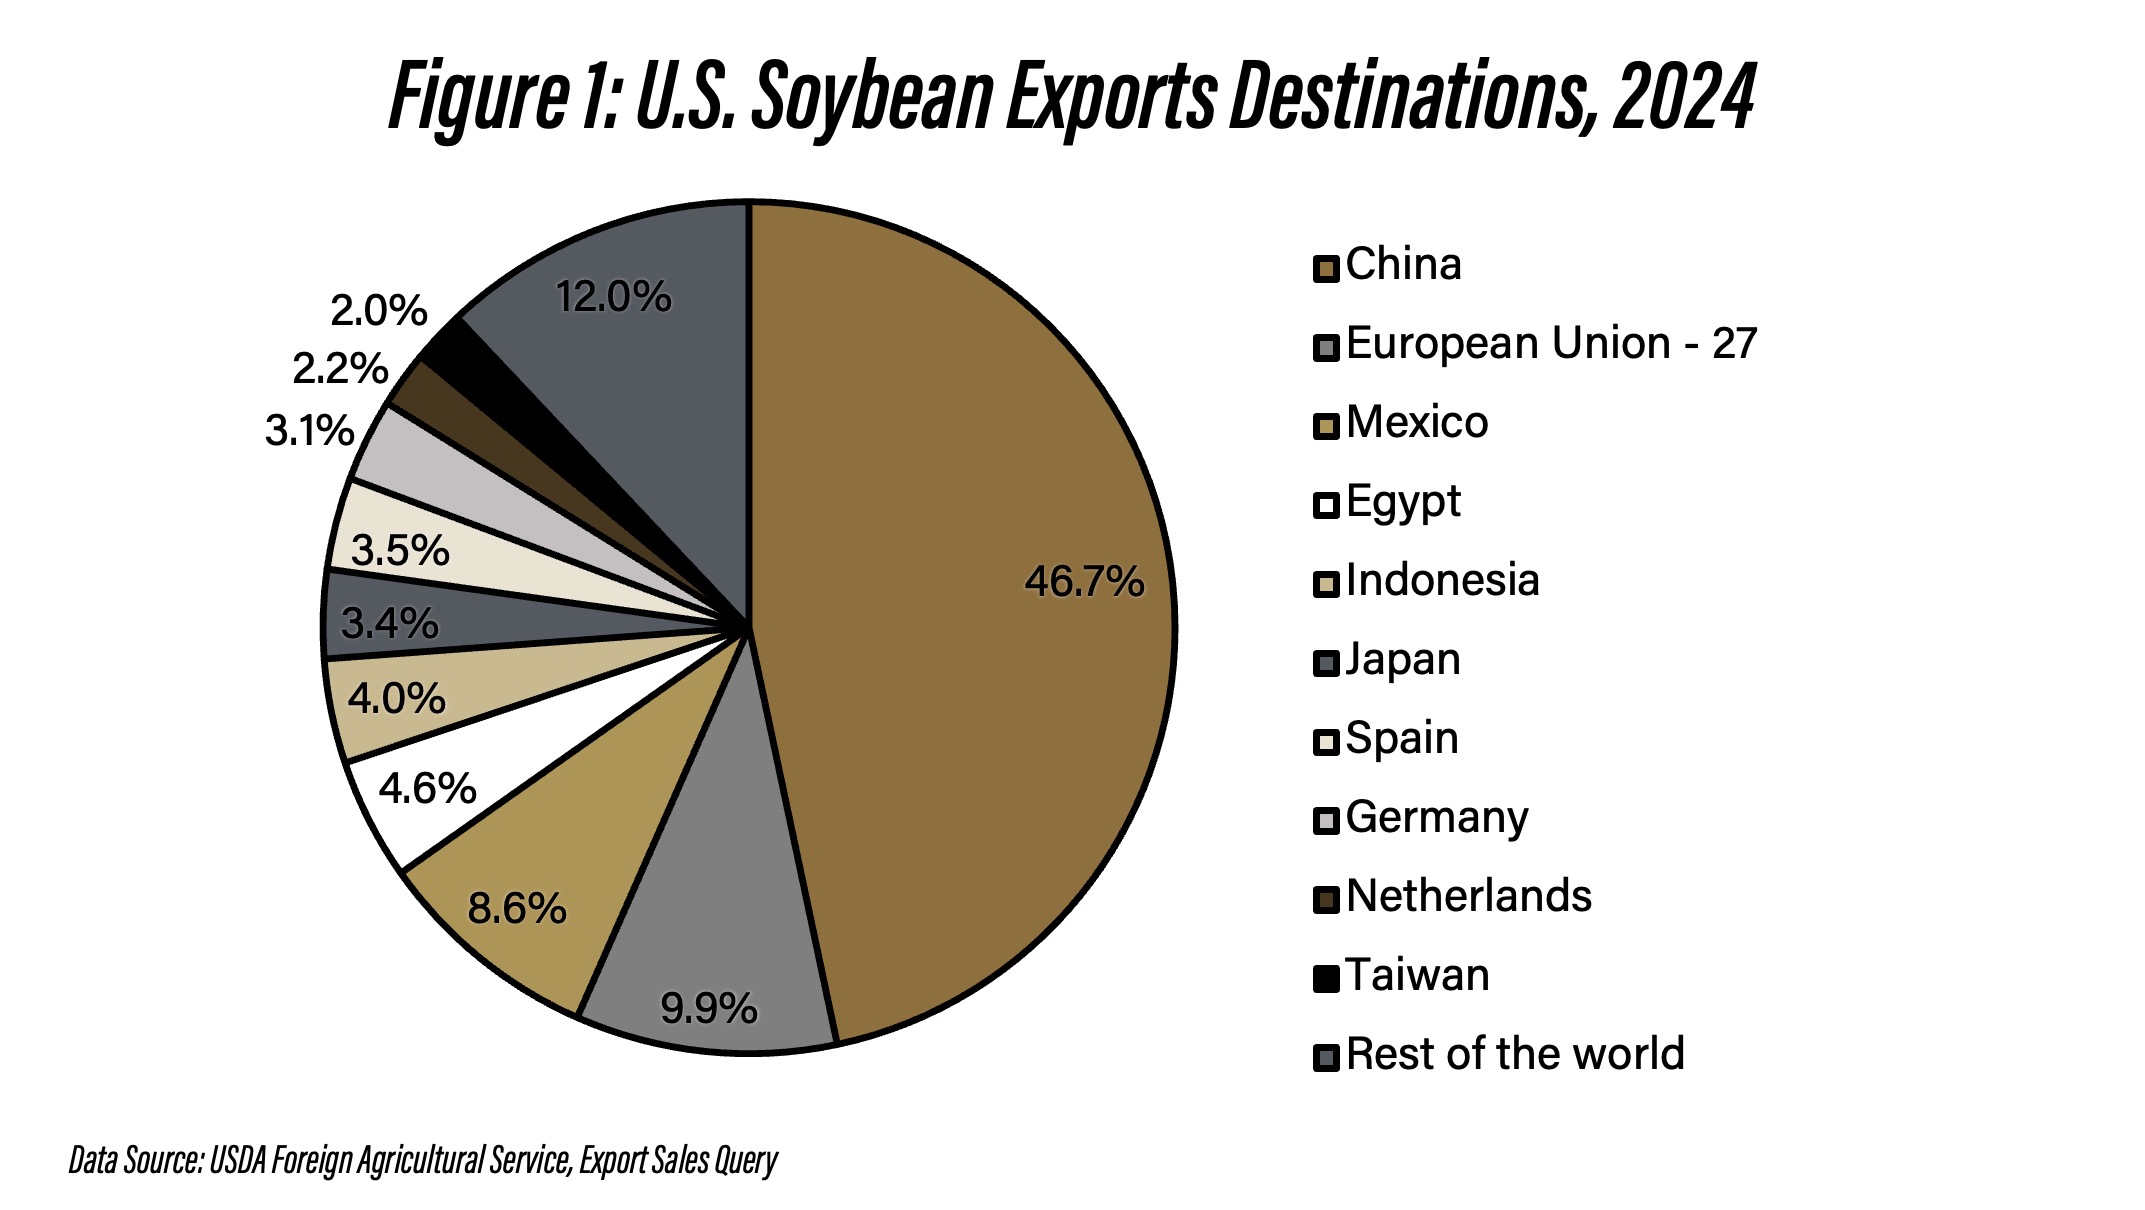
Figure 1: U.S. Soybean Exports Destinations, 2024
The 2025 export profile demonstrates a restructuring of U.S. soybean export markets. China’s share declined dramatically to 18.7%, a reduction of 28 percentage points, while the “Rest of the world” category surged to 21.6%, becoming the largest category (see Figure 2). The European Union increased its share to 12.9%, and Mexico expanded to 12.6%. Additional gains came from include Egypt (10.2%), Japan (5.4%), and Indonesia (5.0%).
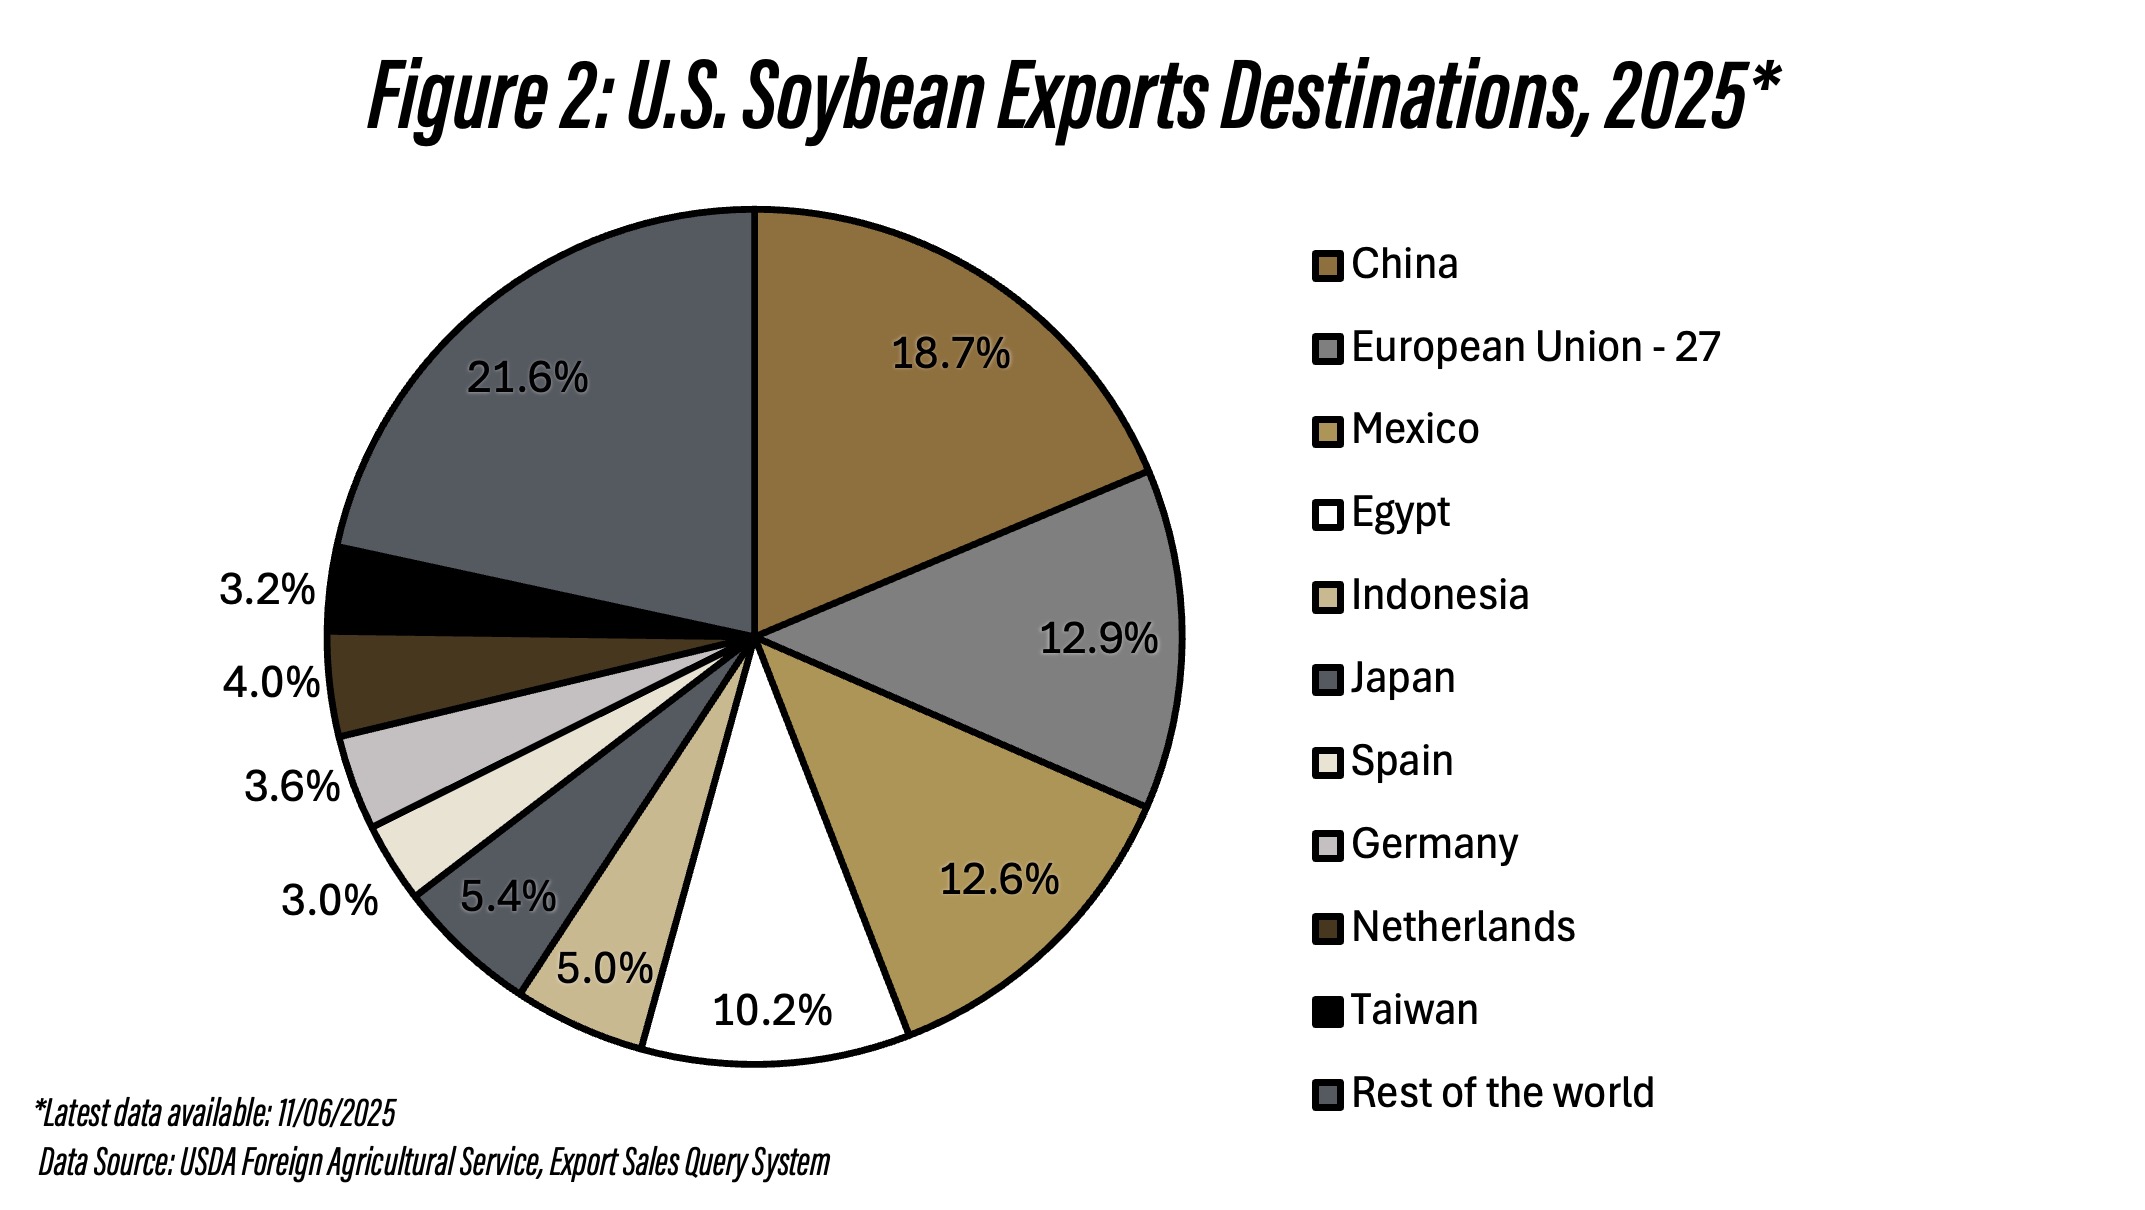
Figure 2: U.S. Soybean Exports Destinations, 2025
This shift has proven important as overall U.S. export volumes have declined in 2025, with China reducing its import volumes substantially due to the second round of the trade war (see Colussi & Langemeier, 2025). This heavy reliance on China created vulnerability to market disruptions and policy changes in that single destination.
Total U.S. soybean exports are projected to total 44.50 million metric tons in 2025, representing 38% of total soybean production and a decrease of 13% compared to 2024 (WASDE-USDA, 2025). While some months in 2025 show lower volumes when compared to 2024, the magnitude of decline has been moderated by gains in alternative markets. October 2025 stands out as the month with the largest year-over-year difference, coinciding with the peak of the soybean harvest and zero purchases by Chinese buyers until then (see Figure 3).
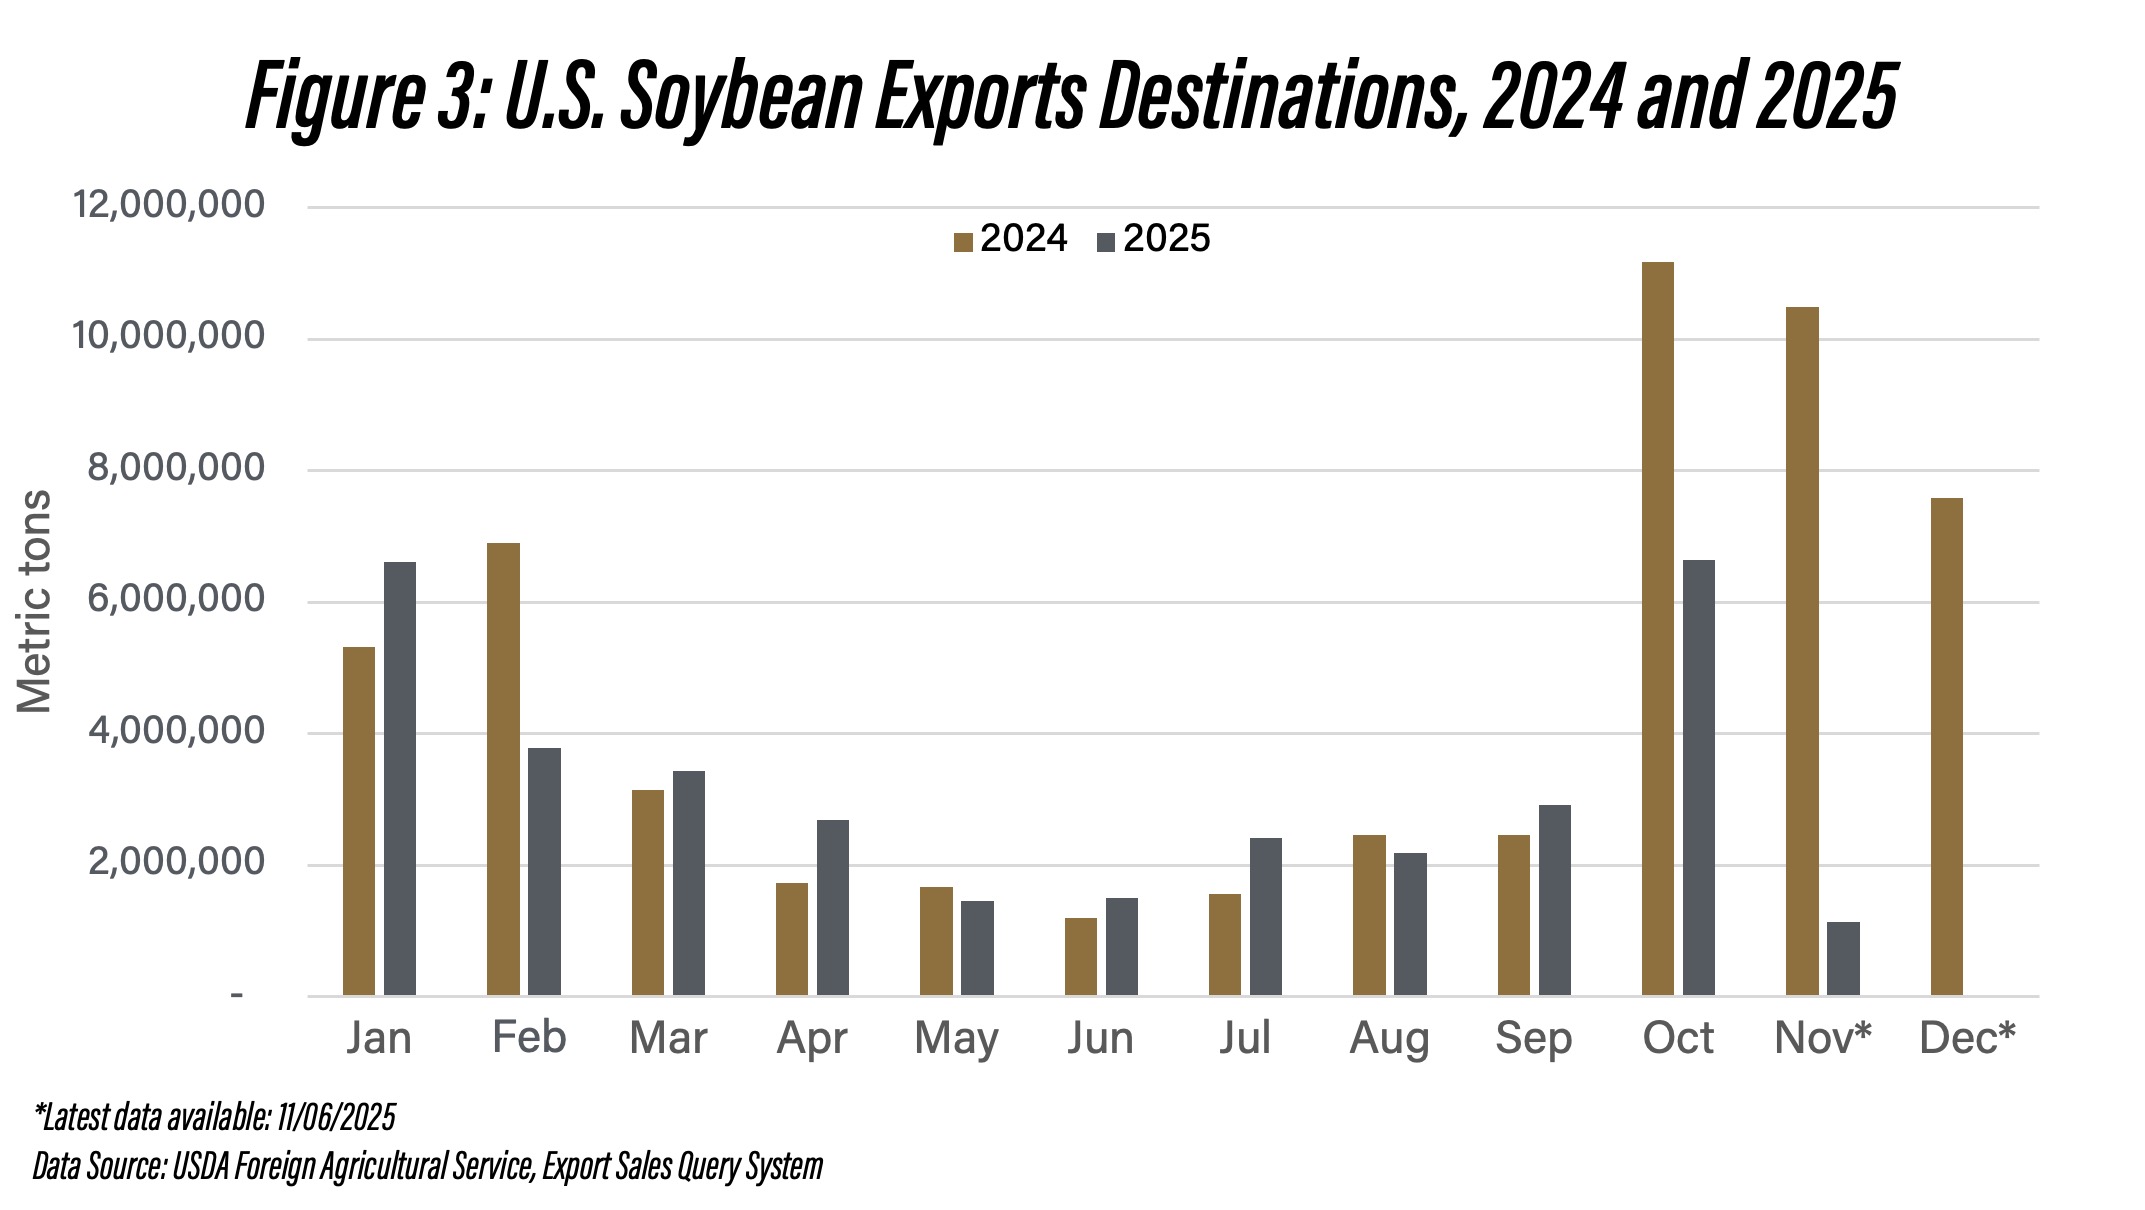
Figure 3: U.S. Soybean Exports Destinations, 2024 and 2025
If China reduced its purchases to the same absolute level observed in 2025, but the U.S. market structure remained as concentrated as in 2024, the overall decline would have been catastrophic. Instead, the expansion into Southeast Asia, North Africa, Europe, and Latin America absorbed a substantial portion of the displacement, transforming what could have been a market crisis into a manageable contraction.
Diversification Enables Corn Volume Growth
The U.S. corn export market presents a contrasting but equally instructive story. Despite reductions in purchases from traditional top markets such as Mexico, Japan, and Colombia, overall export volumes in 2025 have already exceeded 2024 levels, even with data only through early November. This result demonstrates that diversification can not only cushion declines but also drive growth when market conditions are favorable.
In 2024, Mexico dominated U.S. corn exports with a 38% share, followed by Japan at 20% and Colombia at 12%. The European Union and South Korea accounted for 12% and 5%, respectively (see Figure 4). This distribution reflected relatively stable, long-standing trade relationships, mainly with Mexico under the United States-Mexico-Canada Agreement (USMCA).
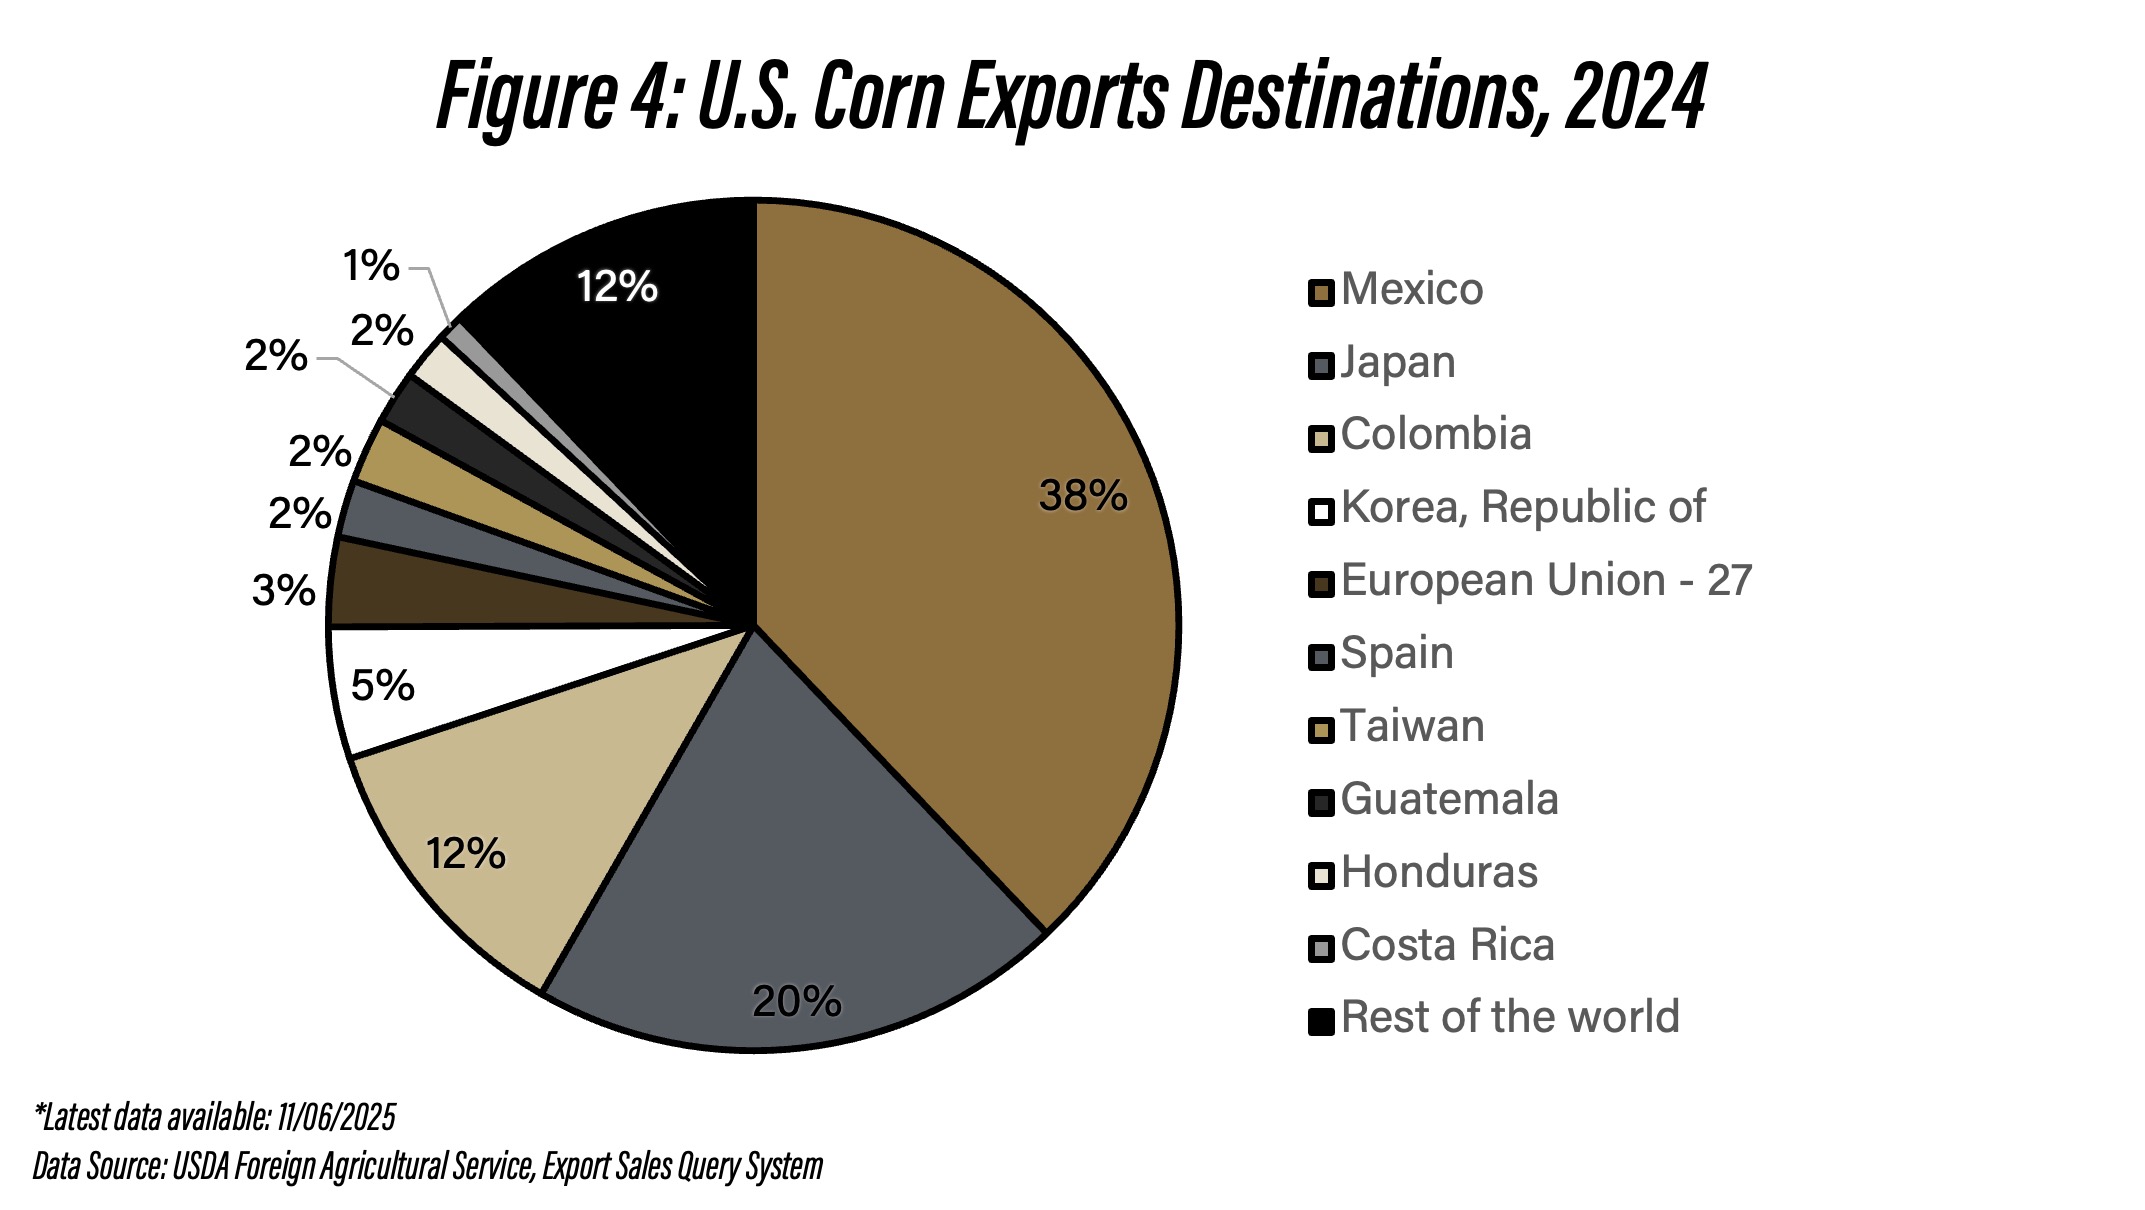
Figure 4: U.S. Corn Exports Destinations, 2024
The 2025 export pattern shows Mexico’s share declining to 29%, Japan’s to 18%, and Colombia’s to 9%. However, these reductions in market share, and in some cases absolute volumes, were more than offset by gains in other markets. The “Rest of the world” category increased from 12% to 15%, while the European Union expanded to 6% (see Figure 5).
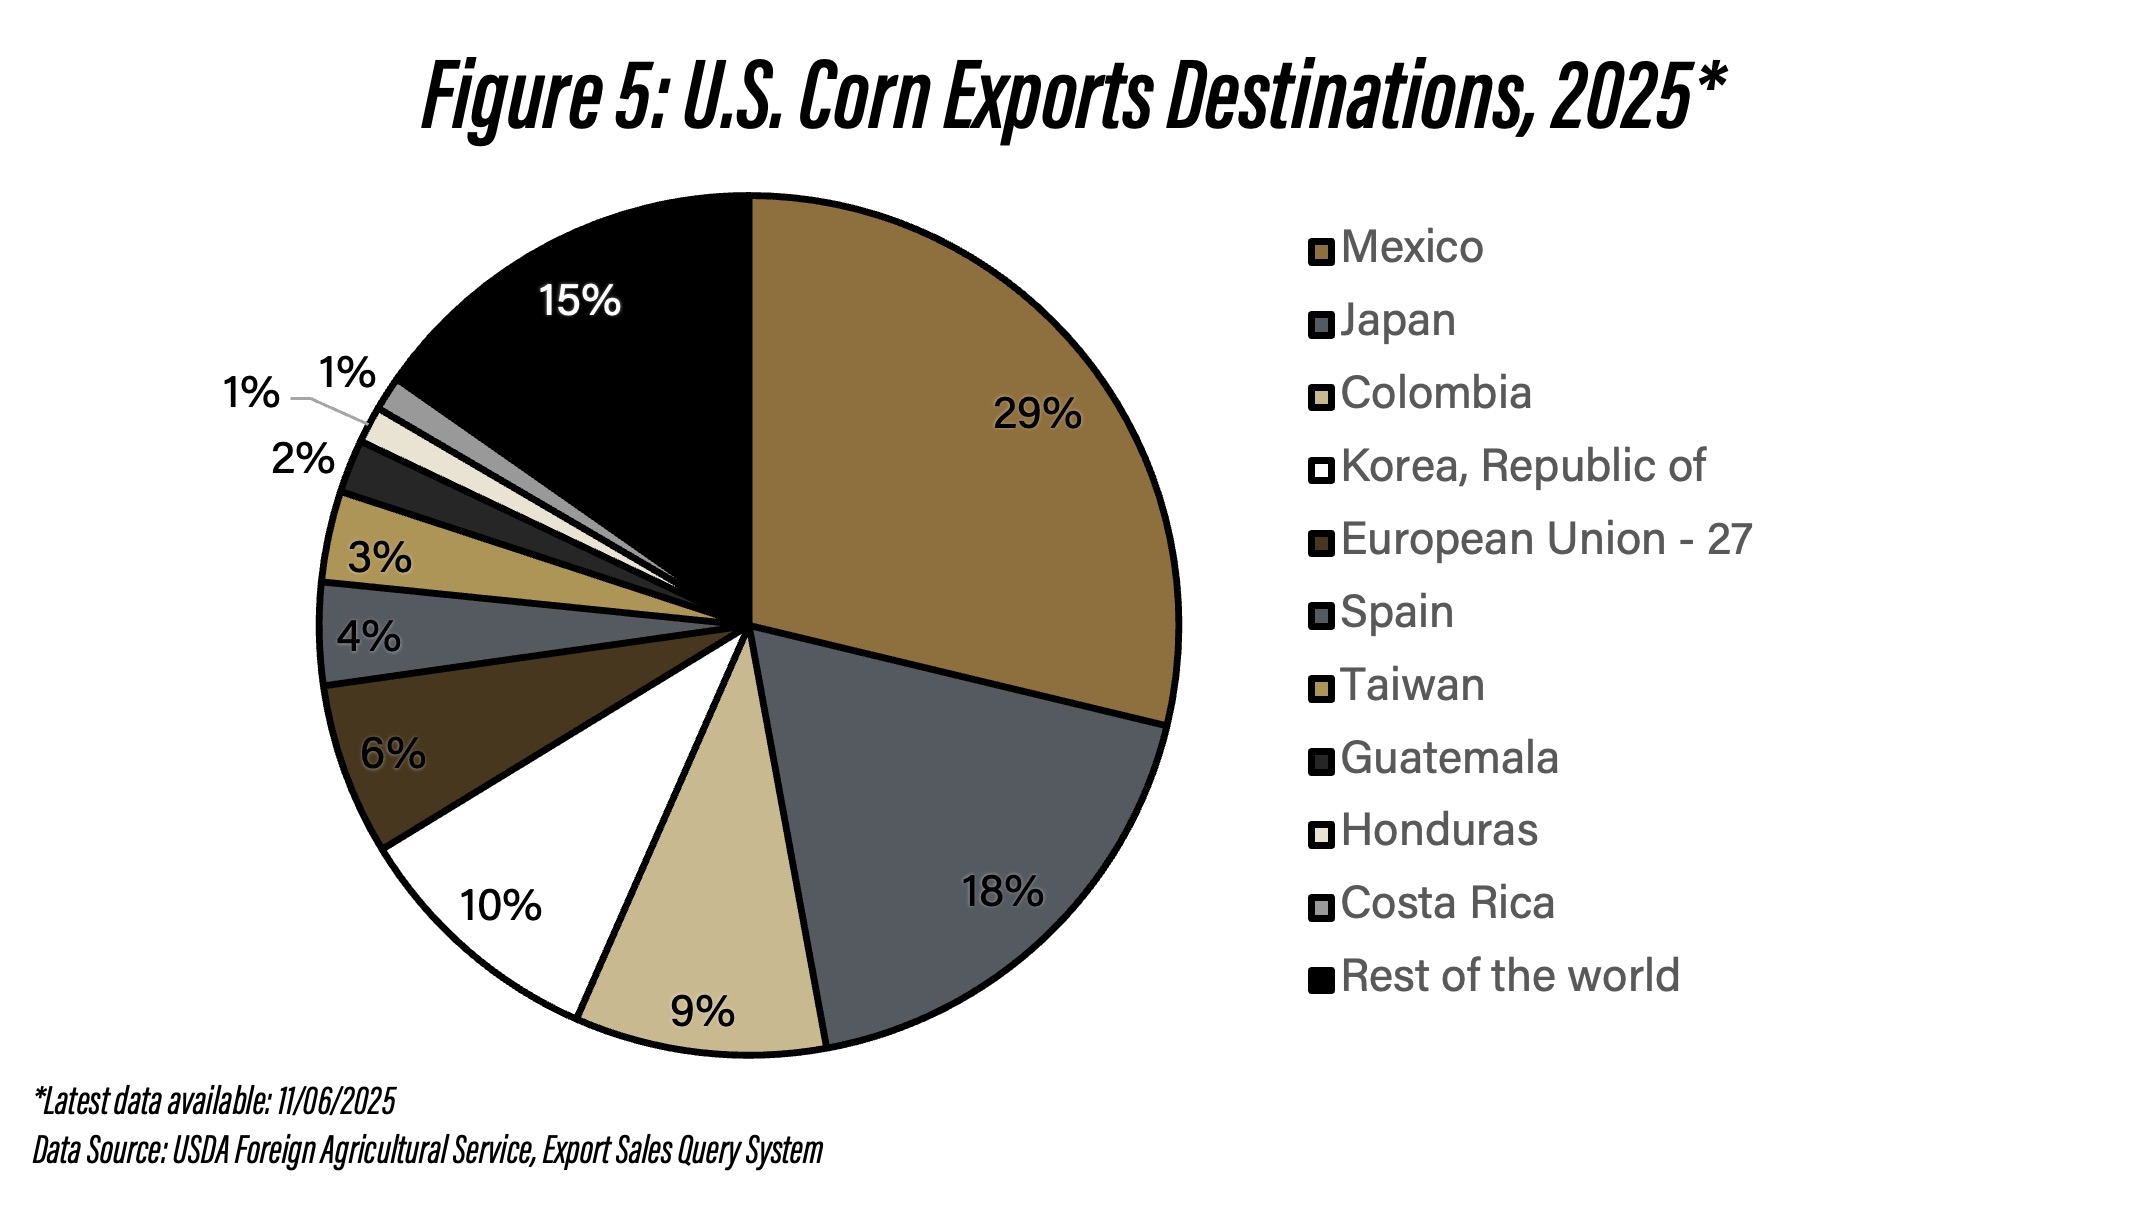
Figure 5: U.S. Corn Exports Destinations, 2025
Total U.S. corn exports are projected to reach 78 million metric tons in 2025, representing 18% of total corn production and an increase of 8% compared to 2024 (WASDE-USDA, 2025). Monthly export comparisons illustrate the growth trajectory. Without complete data for November and December 2025, corn exports have already surpassed 2024 levels in most months.
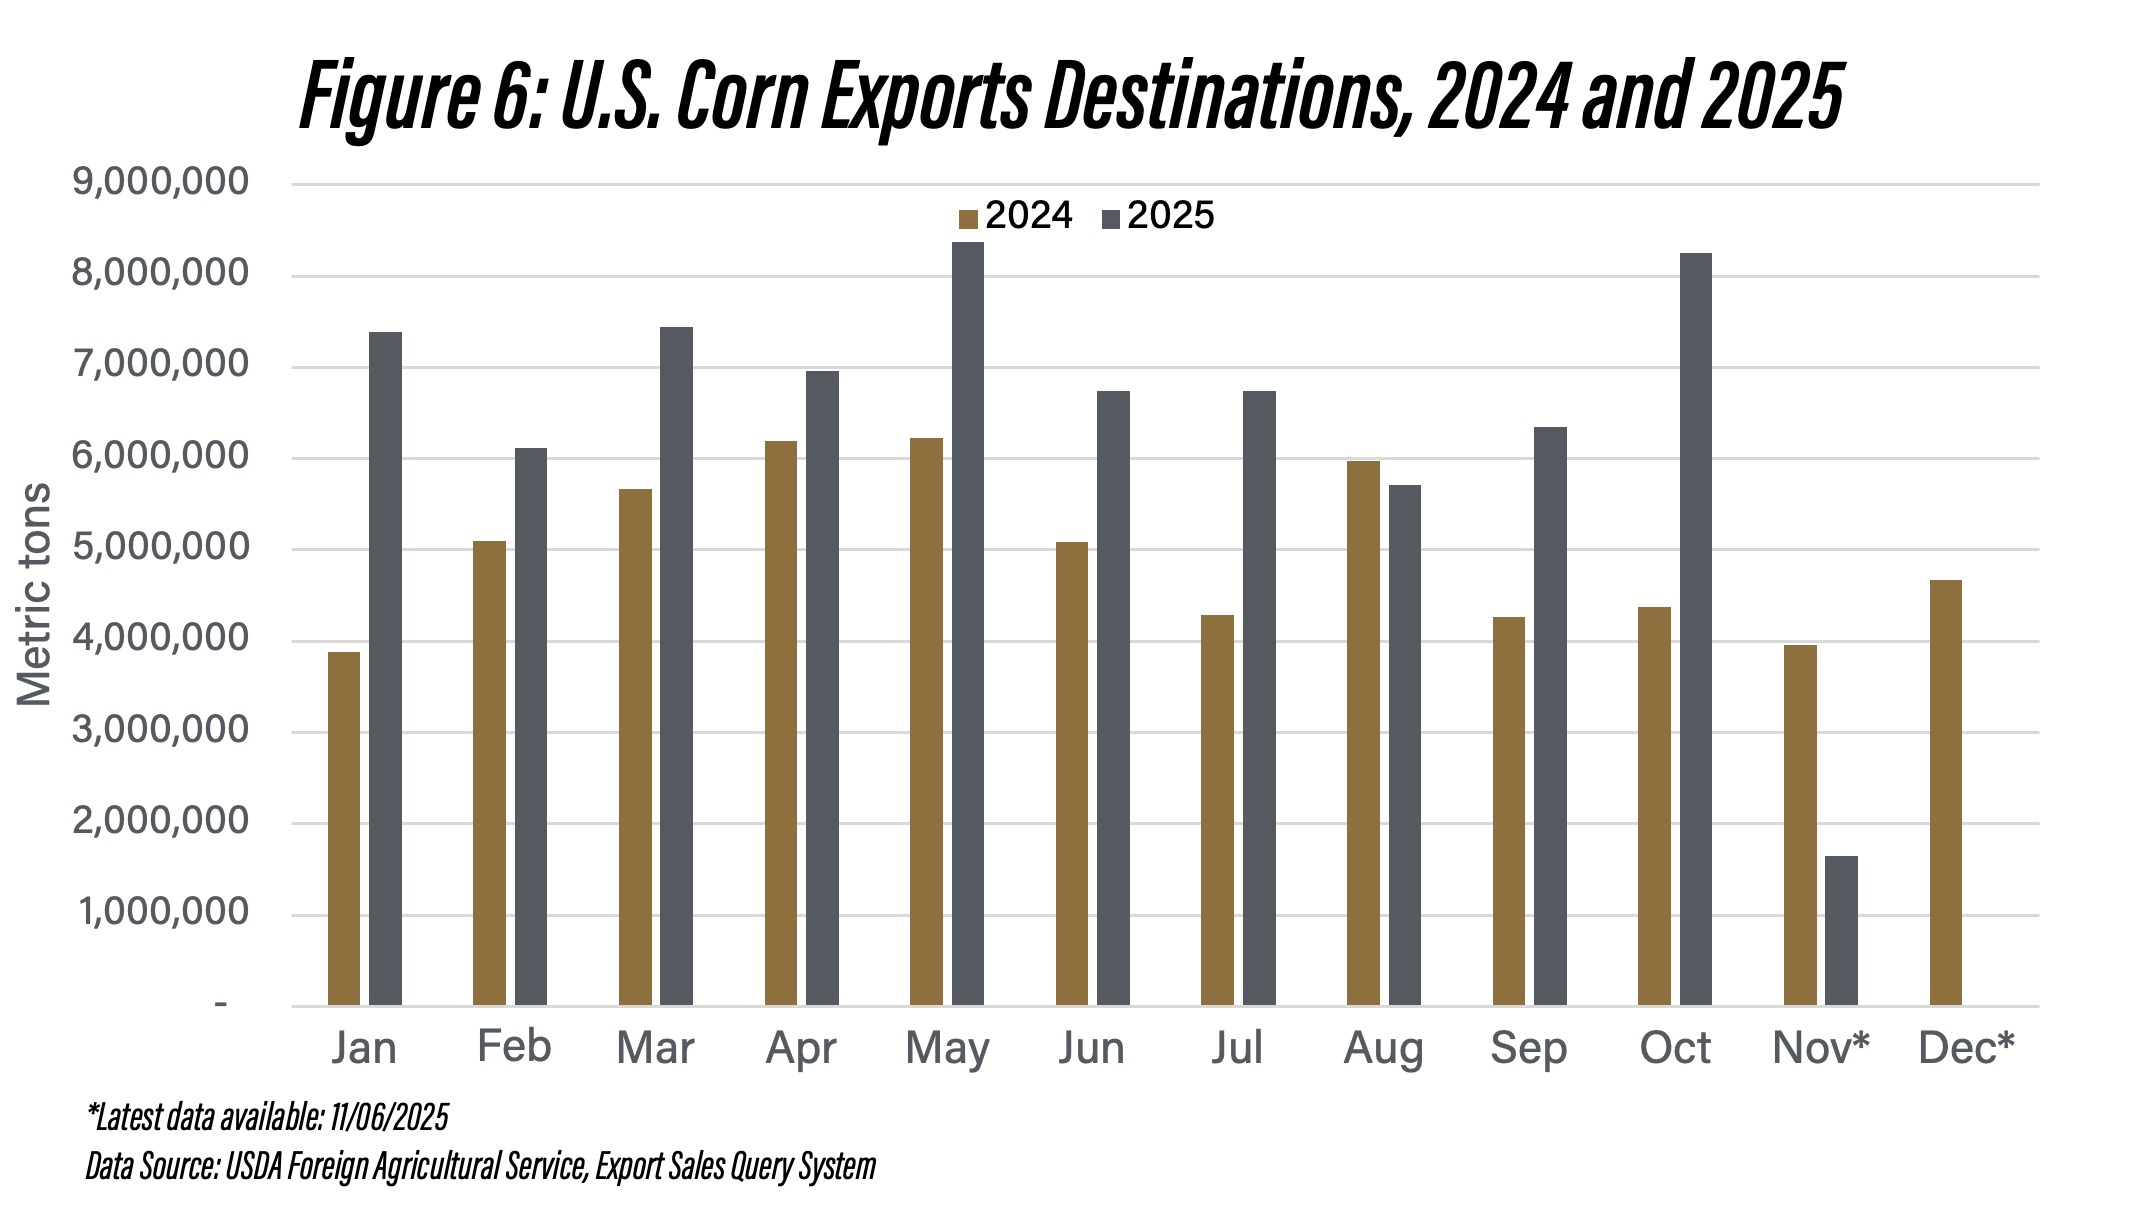
Figure 6: U.S. Corn Exports Destinations, 2024 and 2025
May 2025 showed particularly strong performance, with approximately 8.5 million metric tons exported, compared to 6 million in May 2024. October 2025 reached approximately 8 million metric tons versus 4.5 million in October 2024. These gains reflect strong demand across a more diversified export market, combined with a record U.S. corn crop exceeding 426 million metric tons (USDA-WASDE, 2025).
Final Considerations
The contrasting trajectories of corn and soybean exports in 2025 reinforce the dual nature of market diversification as both a defensive and offensive strategy. For soybeans, diversification has functioned primarily as a buffer, mitigating the impact of reduced Chinese demand and preventing a potential market collapse. The insight is not that diversification prevented a decline in total volumes, but rather that it prevented a collapse that would have occurred had the market remained as concentrated as it was in 2024.
For corn, diversification has served as an engine of growth, enabling total volumes to expand despite weakness in traditional markets. The expansion across different markets suggests that U.S. corn has captured market share through competitive pricing and reliable supply. By establishing stronger commercial relationships with diverse markets, U.S. exporters have laid the groundwork for future growth that is less dependent on any single buyer.
In both cases, corn and soybean markets, diversification has improved outcomes relative to what would have occurred under concentrated market structures. For soybeans, this means a manageable decline rather than a crisis. For corn, this means robust growth rather than modest gains. However, building market presence in new destinations requires time, investment in relationships, adaptation to local preferences and standards, and often infrastructure development.
References
Colussi, J., M. Langemeier. “U.S.–China Soybean Deal: Comparing Past Export Levels and Global Market Impacts.” Center for Commercial Agriculture, Purdue University, November 14, 2025.
Colussi, J., M. Langemeier. “U.S. Soybean Harvest Starts with No Sign of Chinese Buying as Brazil Sets Export Record.” Center for Commercial Agriculture, Purdue University, September 22, 2025.
USDA. 2025. World Agricultural Supply and Demand Estimates (WASDE). December 2025. U.S. Department of Agriculture, Office of the Chief Economist. Available at: https://www.usda.gov/oce/commodity/wasde/wasde1225.pdf
![]()
![]()
![]()
![]()
![]()
TAGS:
TEAM LINKS:


RELATED RESOURCES
UPCOMING EVENTS
We are taking a short break, but please plan to join us at one of our future programs that is a little farther in the future.