February 20, 2026
Corn Basis is Stable Across the Eastern Corn Belt, but Soybean Basis Varies
by Josh Strine
![]()
![]()
![]()
![]()
![]()
As we turn our attention to May futures contracts, corn basis across the Eastern Corn Belt has been broadly stable to slightly increasing. The strongest local corn basis is found across Ohio’s central belt, where it is positive. For example, Figure 1 shows a current basis of $0.04/bu relative to May futures. While the basis in Indiana is not as strong as in Central Ohio, the northern and central parts of the state have basis levels above -$0.10/bu relative to May futures. These levels are also above the three-year historical averages, as is corn basis across most of Michigan, Ohio, Indiana, and Illinois.
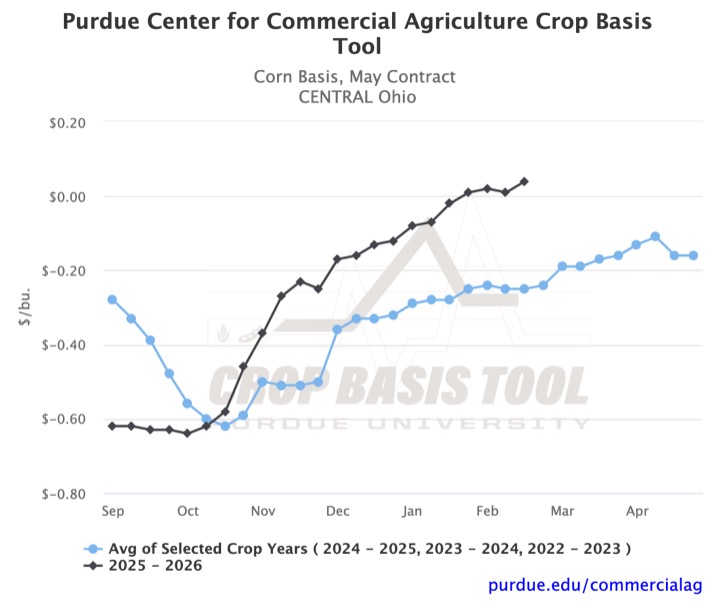
Figure 1. Corn Basis, May Contract for Central Ohio
In contrast, Iowa local corn basis levels remained well below the historical averages. However, the current basis levels across the state (-$0.40/bu) are not far below those in nearby Illinois districts (-$0.35/bu). This is a reversal of recent years, when parts of Illinois had a weaker basis.
Over the past month, soybean basis has been much more volatile, and as a result, current basis levels across the Eastern Corn Belt have a much greater spread. In a majority of the tracked crop reporting districts, soybean basis has increased or remained stable since the third week of January. However, several weakening trends are evident in Southern Indiana and Ohio, Western Illinois, and Iowa. While soybean basis has decreased by $0.12/bu in Southwest Indiana over the past four weeks, it is still one of the strongest local basis levels across the region (Figure 2). Similar patterns can be seen in Southeast Indiana and South-Central Ohio.
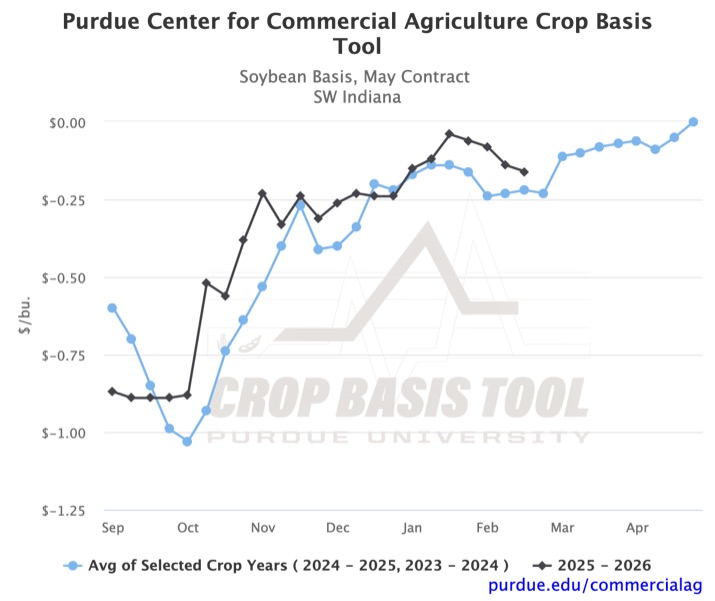
Figure 2. Soybean Basis, May Contract for Southwest Indiana
Consistent with corn basis, local soybean basis is weakest in Iowa. Across the state, basis is currently between -$0.80/bu and -$0.90/bu. This is $0.20-$0.30/bu below basis levels in Indiana, Illinois, Ohio, or Michigan. Just across the state line in Illinois, soybean basis is currently at -$0.40/bu.
Ethanol plants and soybean crush plants continue to offer price premiums over local delivery points, as observed by stronger basis levels. In Ohio, Ethanol plant basis has increased over the past four weeks and is now $0.17/bu (Figure 3). In the other four tracked states, ethanol plant basis has been stable over the past four weeks. Soybean crushing plant basis levels, however, have decreased over the past four weeks. In Ohio, Illinois, and Iowa, the state-level crush plant basis now sits below the two-year average. The strongest basis at soybean crushing plants can be observed in Indiana (Figure 4).
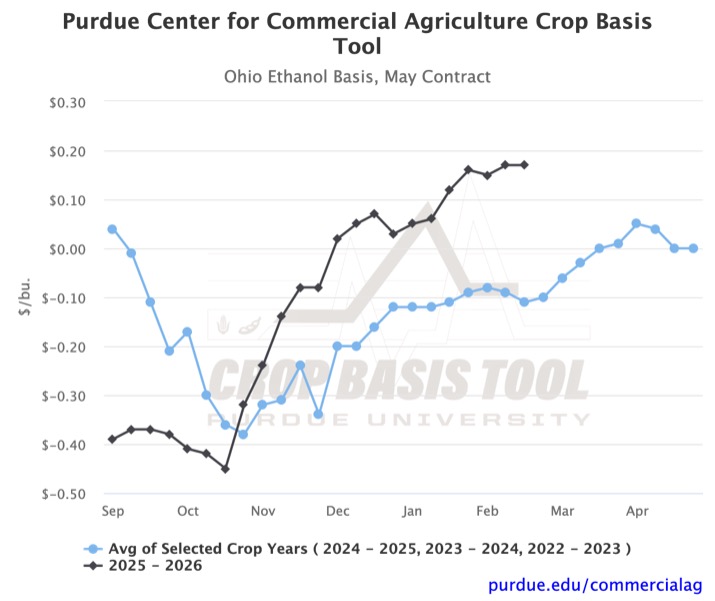
Figure 3. Ohio Ethanol Basis, May Contract
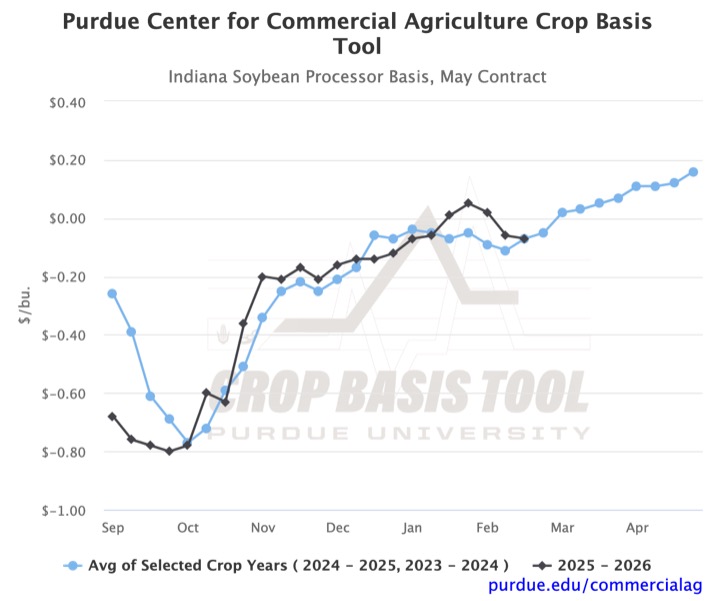
Figure 4. Indiana Soybean Processor Basis, May Contract
You can visit the Purdue Center for Commercial Agriculture’s Crop Basis Tool to see what ethanol or soybean crushing basis looks like in your state. You can also explore your district-level corn or soybean basis to all unexpired futures contracts in the 2025-2026 marketing year. In addition to the historical average, it may be insightful to examine the basis for previous years individually when the current marketing year significantly diverges from the average.
![]()
![]()
![]()
![]()
![]()
TAGS:
TEAM LINKS:

RELATED RESOURCES
UPCOMING EVENTS
We are taking a short break, but please plan to join us at one of our future programs that is a little farther in the future.