March 5, 2026
Producer Sentiment, Farm Growth, and Transition Planning
by Michael Langemeier and Joana Colussi
![]()
![]()
![]()
![]()
![]()
While U.S. livestock producers have benefited from stronger market conditions, crop producers continue to face tighter margins. Results from the February 2026 Purdue University-CME Group Ag Economy Barometer (AEB) survey provide insight into how these differences are influencing producer sentiment, growth expectations, and transition plans by farm type. The AEB index is computed monthly to gauge sentiment among approximately 400 U.S. agricultural producers (Langemeier and Colussi, 2026).
The barometer’s index for February 2026 was 116, indicating that average sentiment was more positive than during the index’s base period (i.e., the fourth quarter of 2015 and the first quarter of 2016). The AEB index is subdivided into two sub-indices: the Index of Current Conditions (ICC) and the Index of Future Expectations (IFE). Index values for February 2026 were 121 for the ICC and 113 for the IFE.
Producer Sentiment by Farm Type
Every month, respondents to the AEB survey are asked whether crop or livestock producers will have widespread good times or widespread bad times over the next five years. A separate question is used for crops and livestock. These two questions are addressed to all respondents. In the February 2026 survey, 22% of respondents indicated that crop producers will have widespread good times, and 69% of respondents indicated that livestock producers will have widespread good times.
The monthly survey also includes two questions related to livestock production. The first question asks producers whether their farm has a beef, hog, or dairy operation. The second question is addressed to those who answer the first question affirmatively and asks whether their livestock operation accounts for less than 25%, 25 to 50%, 50 to 75%, or more than 75% of their farm’s revenue.
We used the two livestock questions from the February 2026 survey to divide the monthly survey respondents into two groups. The first group (257 farms) derived less than 50% of their revenue from livestock production, and the second group (144 farms) derived 50% or more of their revenue from livestock production.
Producer sentiment in the February 2026 survey for all respondents and for crop and livestock farms is presented in Table 1. The average AEB index for livestock farms was 140, which was 38 points higher than the index for crop farms. A similar difference in producer sentiment between crop and livestock producers was found in the August 2025 survey (Langemeier, Mintert, and Colussi, 2025). The difference in the ICC index for the two groups was much wider than the difference in the IFE index. Producer sentiment for livestock farms can be used to help explain why the ICC index was higher than the IFE index for all respondents.
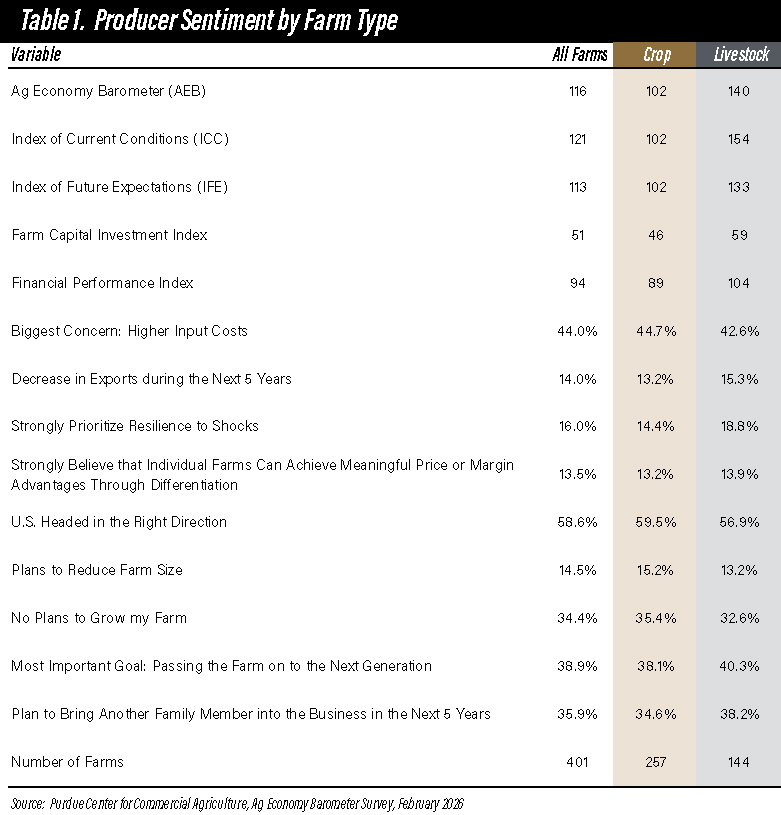
Table 1. Producer Sentiment by Farm Type
The Farm Capital Investment index measures whether respondents think now it is a good time or a bad time to make farm investments, including items such as machinery and buildings. An index below 100 indicates that more respondents think it is a bad time rather than a good time to make such investments. The Farm Capital Investment index was 46 for crop farms and a slightly more optimistic 59 for livestock farms in the February AEB survey.
The Financial Performance index measures whether a farm expects its financial performance to be better than, worse than, or about the same in the next 12 months. An index below 100 indicates that more farms expect their performance to be worse rather than better in the next 12 months. The average index for August was 94. The average index for crop farms was 89 while livestock farms, with a reading of 104, were more optimistic.
Another monthly AEB question asks respondents to identify their biggest concerns for their farm using the following response choices: lower crop and/or livestock prices, high input costs, environmental policy, farm policy, interest rates, and availability of inputs. High input costs were the biggest concern for both crop and livestock farms. Sentiment regarding exports in the next five years, resilience to shocks, the advantages of diversification, and whether the U.S. was headed in the right direction or on the wrong track was similar between crop and livestock producers.
Farm Growth and Transition Planning
Questions pertaining to farm growth, farm goals, and transition planning were included in the February 2026 AEB survey. The farm growth question was posed as follows: What is a reasonable annual growth expectation you have for your farm over the next five years? Potential answers include the following: reduce farm size, no plans to grow, 0 to 5% annual growth, 5 to 10% annual growth, 10 to 15% annual growth, and more than 15% annual growth. Summary information for the entire group of farms, for crop producers, and for livestock producers is presented in Table 1 and Figure 1. Approximately 51% of crop producers and 46% of livestock producers either plan to reduce their farm size or have no plans to grow. At the other end of the spectrum, a higher percentage of livestock producers (24% vs. 9%) intend to grow by more than 10%.
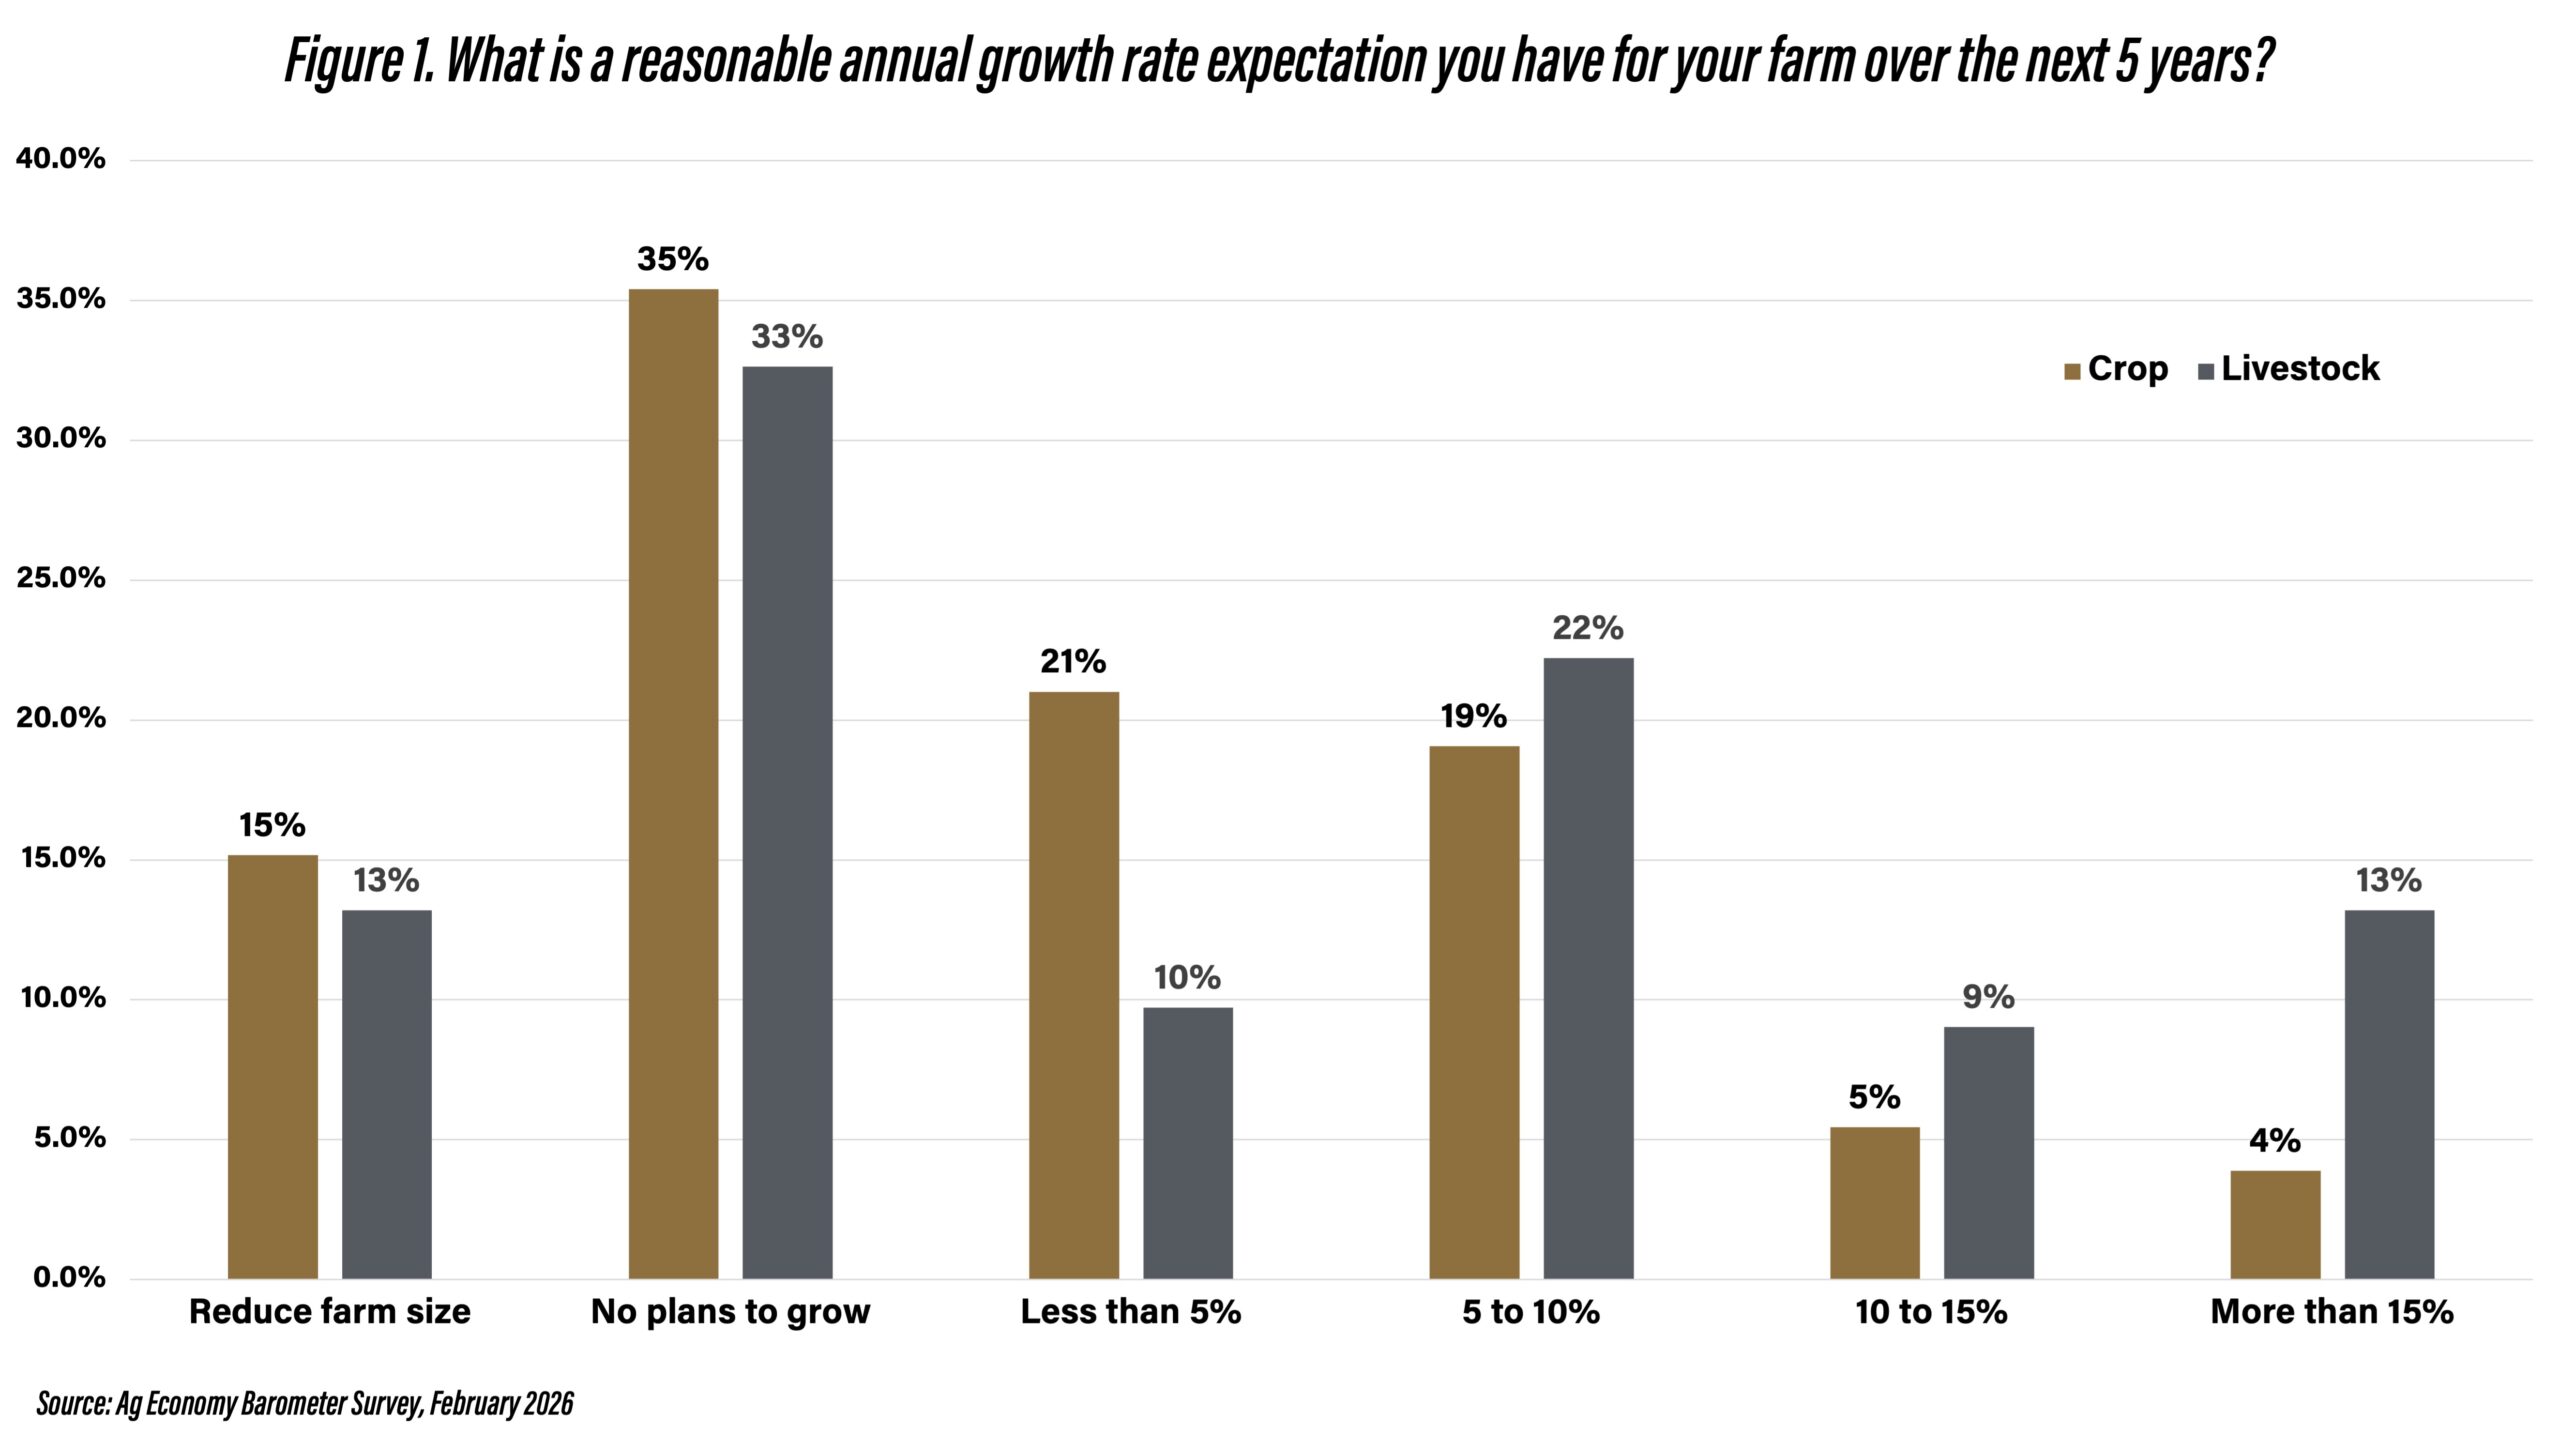
Figure 1. What is a reasonable annual growth rate expectation you have for your farm over the next 5 years?
The farm goal question was as follows: What is the most important farm goal for your operation? Choices were as follows: avoid years of low profit, maintain stable income; maintain or improve the quality of soil, water, and air resources; maximize profits; pass the farm on to the next generation; and reduce debt over time. For both crop and livestock producers, passing the farm on to the next generation was the most important goal, with 38% of crop producers and 40% of livestock producers choosing this goal as the most important. Consistent with this goal, approximately 35% of crop producers and 38% of livestock producers plan to bring another family member into the business in the next five years.
Conclusions
Given the large difference in prices received and projected net return prospects, it is not surprising to find a large difference in producer sentiment between crop and livestock producers in the February 2026 AEB survey. In contrast to producer sentiment, farm growth and transition plans are similar among crop and livestock producers. Approximately 50% of respondents to the February 2026 AEB survey plan to grow in the next five years, and approximately 36% of respondents plan to bring another family member into the business in the next five years.
References
Langemeier, M., J. Minert, and J. Colussi. “Crop vs. Livestock Sentiment.” Center for Commercial Agriculture, Purdue University, October 6, 2025.
Langemeier, M. and J. Colussi. “Farmer Sentiment Rebounds, but Future Expectations Continue to Slide.” Ag Economy Barometer, March 3, 2026. (https://ag.purdue.edu/commercialag/ageconomybarometer/).
![]()
![]()
![]()
![]()
![]()
TAGS:
TEAM LINKS:


RELATED RESOURCES
UPCOMING EVENTS
We are taking a short break, but please plan to join us at one of our future programs that is a little farther in the future.