May 12, 2026
Examining Tradeoffs between Conservation and Profitability
by Michael Langemeier
![]()
![]()
![]()
![]()
![]()
Introduction
There are numerous conservation practices that should be considered when exploring soil health. To acknowledge the array of conservation practices and to provide guidance as to the impact of these practices on soil health, helpful tools have been developed. For example, the Soil Health Matrix Decision tool developed by the Soil Health Nexus with assistance from extension colleagues in the North Central region explores soil health scores for current and planned practices related to tillage, manure, crop rotation, cover crops, and complementary practices (Soil Health Nexus, 2026). By comparing current and planned practices, a farm can assess changes in soil organic matter, nutrient capacity, water holding capacity, erosion, water infiltration, aggregate stability, soil compaction, organism habitat, and an overall soil health score. The values in the tool are meant to be a guide and may vary by location and the suite of practices actually used. As another example, Plastina (2024) has developed a carbon intensity score calculator for corn. This tool compares a carbon intensity score under current and alternative farming practices. To use the tool, a farm selects their state, county, cover crop use, manure use, and tillage practice from drop down menus, and enters corn acres, fertilizer use, and yield. The tool then illustrates the improvement in CI score associated with the implementation of specific practices.
The conservation tools briefly described above are helpful when evaluating changes in soil health or carbon associated with the adoption of specific conservation practices. For most farms, conservation is only one of several farm goals, which in addition to conservation may include risk reduction, profitability, farm transfer to a younger generation, and reduction in debt. How does a farm consider these other farm goals? This paper addresses this question by developing a conceptual framework that can be used to examine farm goal tradeoffs, with particular emphasis on the tradeoff between conservation and profitability.
Traditional Farm Management Tools
Partial budgets are a common tool used to analyze changes related to input use, crop mix, and input/output relationships (e.g., reduction in N rate on corn). Partial budgets compare additional costs and reduced revenue associated with an alternative to the additional revenue and reduced costs of the alternative. There is a net improvement in profit if additional revenue and reduced costs are greater than additional costs and reduced revenue. Examples of topics that can be addressed using partial budgets include the following. Should I apply a fungicide application to one of our corn fields? What would be the impact of reducing my seeding rate on corn from 36,000 plants per acre to 33,000 plants per acre? Should I store my corn or soybeans several months past harvest? Should I convert one of my fields from dryland to irrigated production? Should I plant wheat rather than corn or soybeans on a particular field? Should I replant one of my soybean fields? Notice that the above example addresses short-run decisions (i.e., decisions that do not have benefits and costs lasting more than one year).
Partial budgets are designed to measure the change in net returns resulting from making a change in the operation. Unfortunately, it is difficult to add the impact of the potential change to other goals such as risk mitigation or soil health improvement using the partial budget framework.
Capital budgeting is a useful tool to analyze management decisions or projects in which the funds used to purchase a capital item (e.g., machine; tile drainage) are paid out immediately or in the first year, and the income or benefits accrue over several years (Boehlje and Ehmke, 2005). Capital budgeting presents all income and cost information in present dollars using net present value analysis, which recognizes that a dollar today is worth more than a dollar tomorrow. The discounting procedure used in capital budgeting converts the cash flows that occur in the future to today’s dollars. Examples of problems in production agriculture for which capital budgeting is helpful are numerous. Capital budgeting is useful when analyzing capital purchases such as machinery and equipment, buildings and grain bins, tile drainage, irrigation wells and pivots, and land.
Capital budgeting is designed to measure the net returns associated with making a capital purchase. Essentially, we are comparing long-run benefits to long-run costs. As with partial budgets, it is difficult to examine other goals such as risk mitigation or soil health improvement when using capital budgeting. In particular, when dealing with long-run issues, it is important to think about the risk-return tradeoff. In general, higher potential returns are associated with higher risk (e.g., a higher standard deviation of returns), while lower potential returns are associated with lower risk. If farm conservation or transferring the farm to the next generation are also important to a farm, the impact of these goals on the risk-return tradeoff would also need to be considered. The next two sections will discuss the tradeoff between farm goals and the use of scenario planning to explore goal tradeoffs.
Tradeoffs between Farm Goals
Though this article discusses multiple goals, much of the focus is on conservation as a farm goal. When thinking about the adoption of conservation practices, it is important to note two things. First, adoption rates have ebbs and flows. In other words, adoption does not necessarily follow a steady trend. Second, sometimes conservation practices are disadopted. A recent article by Plastina et al. (2024) examined trends in cover crop and no-till adoption in Iowa, Illinois, and Indiana. After doubling from 2012 and 2017, the rate of adoption of cover crops slowed from 2017 to 2022. Moreover, in 32% of the counties in these states, the cover cropped area actually declined from 2017 to 2022. Total no-till acres were only slightly higher in 2022 compared to 2017, with approximately one-half of the counties experienced disadoption. We contend that at least a portion of the disadoption is likely due to a misalignment of goals. If the conservation goal is ranked considerably below goals such as profit maximization, farms that adopt these conservation practices, perhaps as a result of an economic incentive, may disadopt if profits are not forthcoming, or the incentives are short-term in nature. Another potential issue with the adoption of some conservation practices is the fact that benefits change, often increasing, over time. Chen et al. (2025) developed a model to examine optimal cover crop adoption, accounting for cumulative effects on soil fertility, uncertain fertilizer and output prices, and machinery decisions. They found significant cumulative effects of cover crops on yields and long-term substitution effects between cover crops and nitrogen use. As another example of the importance of long-run benefits, Cusser et al. (2020) indicated that over a decade was needed to detect the consistent effects of no-till.
As noted above, it is uncommon for a farm to have a single goal, such as profit maximization or soil conservation. Having a hierarchy of goals is important because goals may conflict with one another. For example, safety-first risk models first ensure that downside risk is amenable and then maximize profits. As another example, a farm could establish a specific target with regard to soil erosion and then maximize profits given this target. It is important to keep in mind that each farm prioritizes goals in a different manner. This means that there is not a “correct answer” or “unique answer” to the tradeoff examples discussed below in this paper.
If data pertaining to net returns, risk, and soil health improvement associated with specific conservation practices are readily available, linear programming can be used to examine the relationship between various goals. For example, Langemeier (2023) examined the tradeoffs between crop net returns, risk, and conservation practices. This model was used to illustrate the cost associated with specific reductions in soil erosion and GHG emissions. Often data is not readily available, so we have to use other methods, such as scenario analysis to explore goal tradeoffs. Scenario analysis is discussed in the next section.
Scenario Analysis of Conservation Practice Adoption
Scenario analysis (sometimes referred to as scenario planning) is a planning and risk management technique that can be used to evaluate the potential impact of key management decisions (Courtney et al., 1997; Schwartz and Randall, 2007). Plausible scenarios are developed to determine the impact of each scenario on key performance indicators. In the process, businesses can prepare for various possibilities, make informed decisions, and develop more flexible and resilient strategies. Scenario analysis is often used in situations involving uncertainty (i.e., situations where there is limited data pertaining to outcomes and the probabilities of these outcomes). Scenarios are used in this section to examine the tradeoff between profit maximization and attaining conservation targets. Profitability is measured using net returns per acre while soil health is proxied using estimates of soil loss and GHG emissions, and an overall soil health score. The primary data sources for the scenarios were as follows: the Soil Health Matrix Decision Tool, the most recent Precision Conservation Management report, and Langemeier (2024).
Table 1 compares scenarios that include reduced till (scenario A) and no-till (scenario B). The adoption of no-till practices reduced soil loss, reduced GHG emissions, and improved the overall soil health score from -0.5 to 0.0. In addition to conservation benefits illustrated in table 1, no-till can be used to preserve water, an extremely important consideration in the Western Corn Belt, and due to the reduction in tillage operations, reduce labor and fuel costs per acre. The reduction in net returns associated with the adoption of no-till was larger for soybeans than for corn. The rotational decline in net returns was $11 per acre. The numerous benefits associated with no-till account for its widespread adoption. Approximately 50% of the survey respondents in Langemeier (2025) used no-till on a majority of their crop acres. Plastina (2024) noted that approximately one-third of crop acres in Iowa, Illinois, and Indiana used no-till practices.
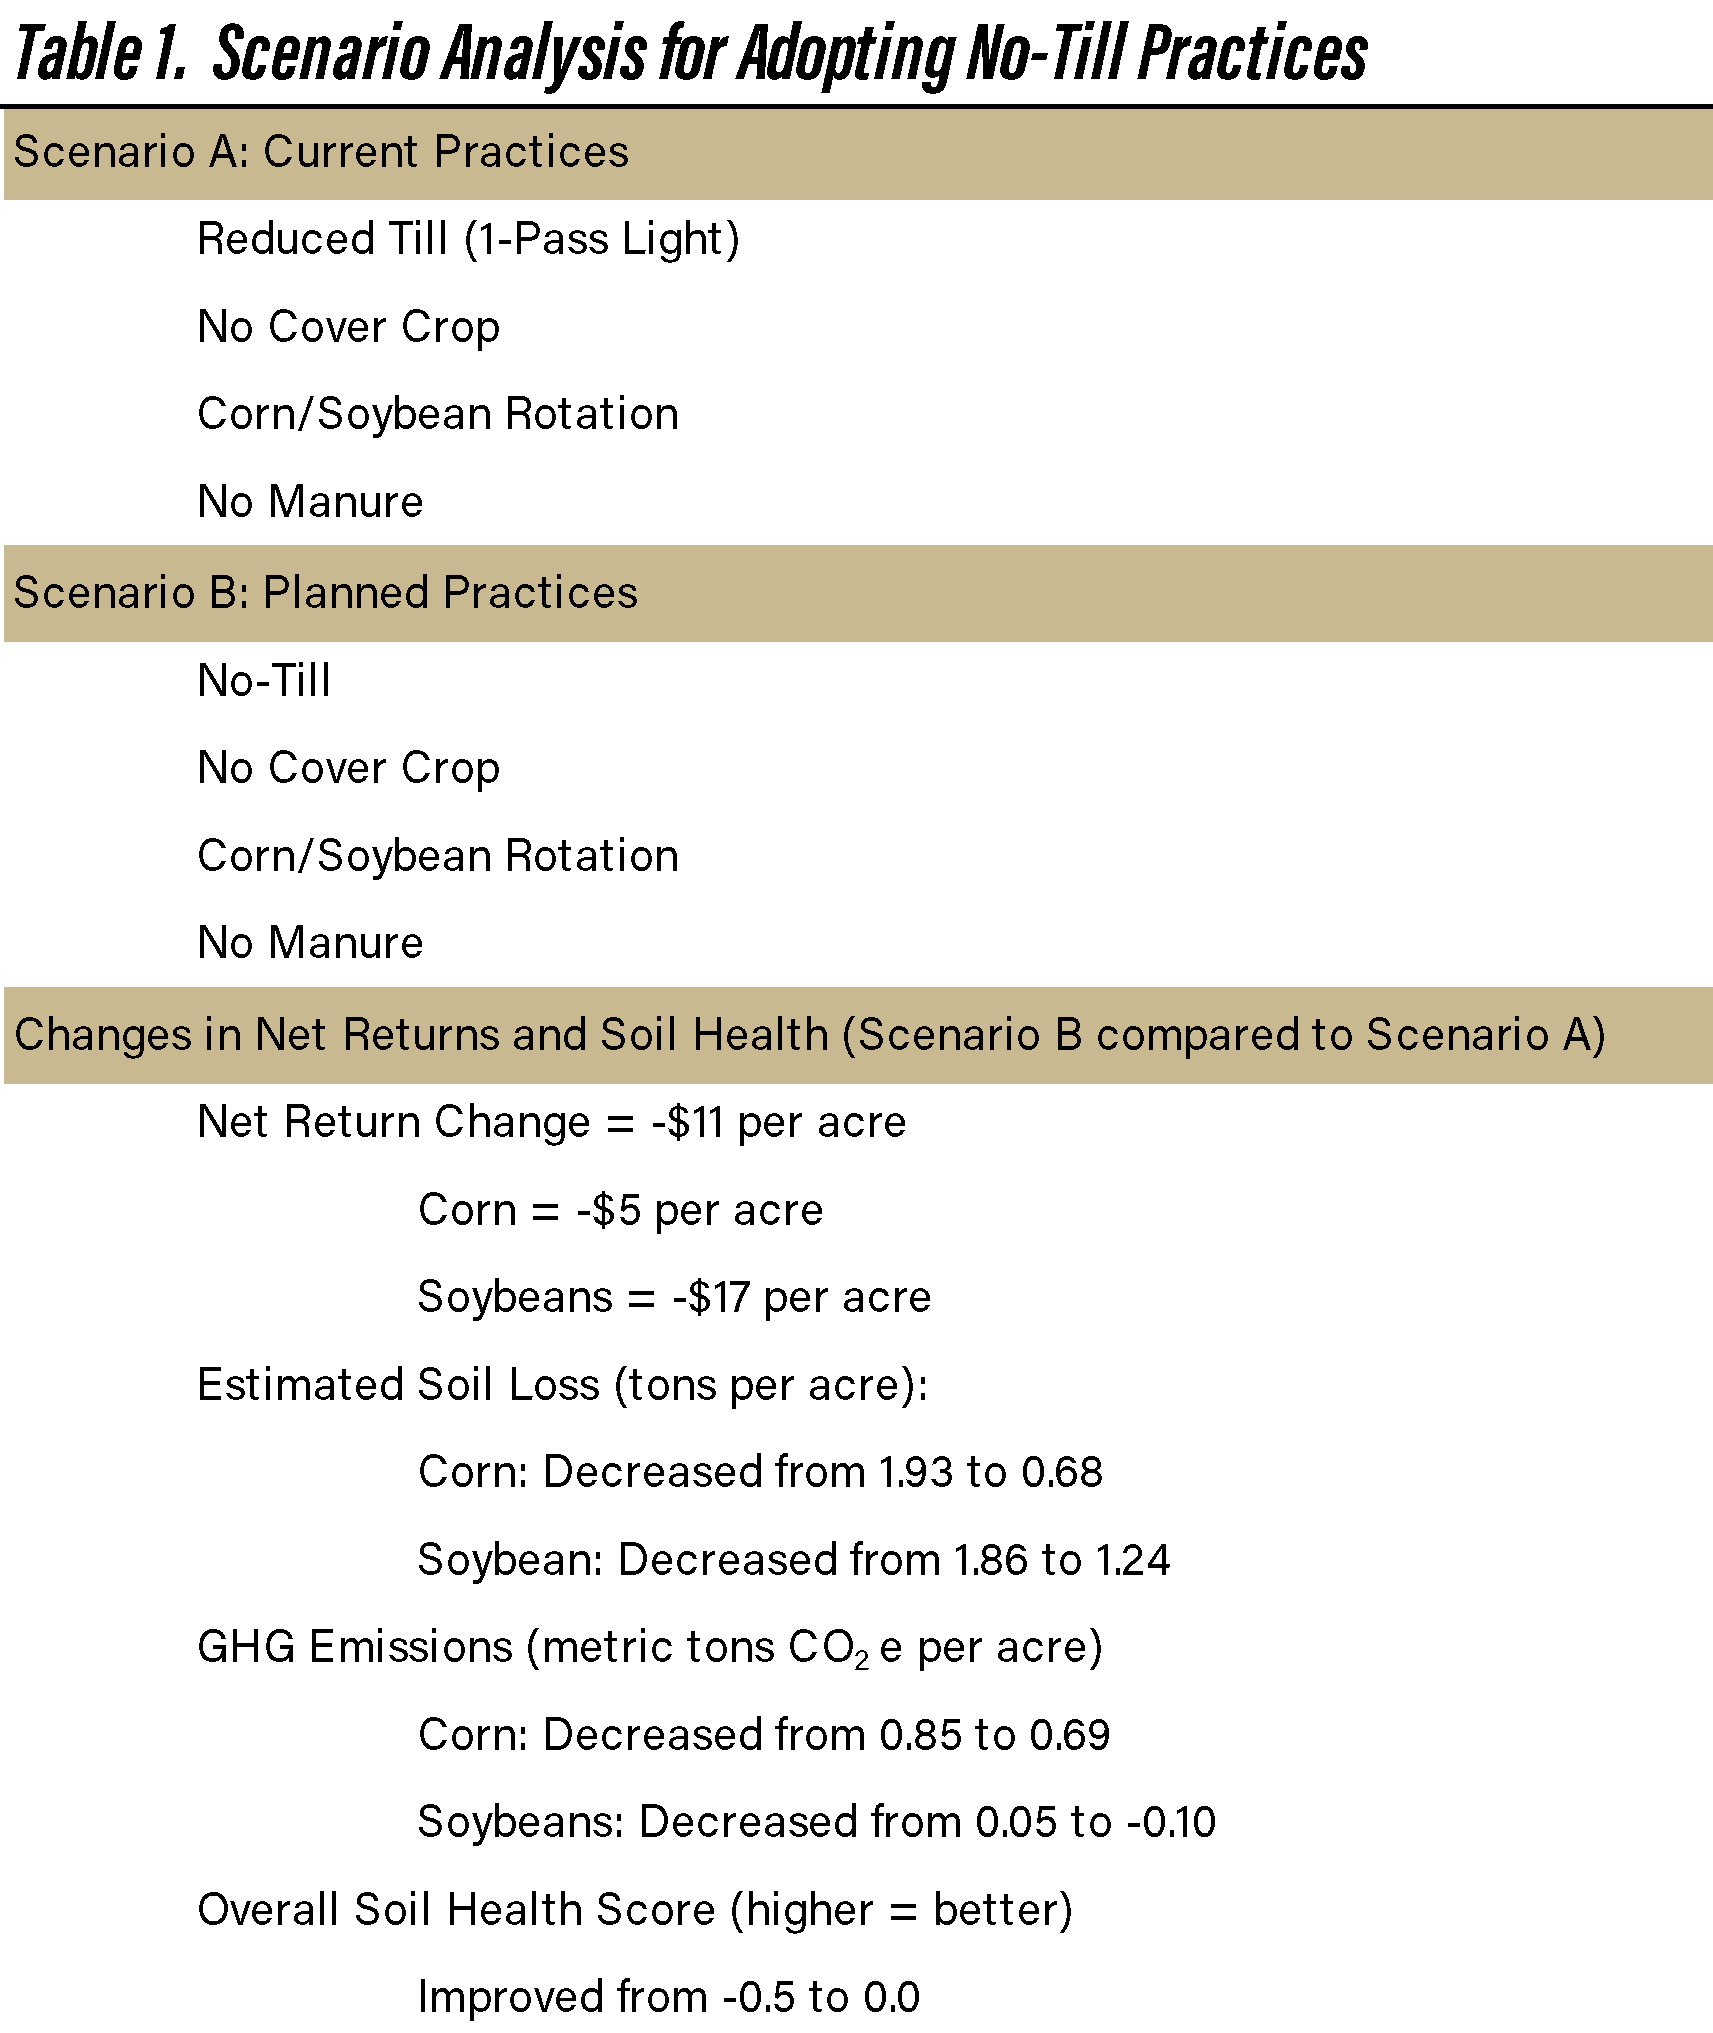
Table 1. Scenario Analysis for Adopting No-Till Practices
Another method that can be used to improve overall soil health is to add another crop to an existing crop rotation. Table 2 illustrates the impact of adding winter wheat to a corn/soybean rotation (Scenario D). Information on soil loss or GHG emissions was not available in this case. Adding winter wheat improved overall soil health slightly. Unfortunately, this improvement in soil health came at a cost. Rotational net returns dropped $17 per acre. There are numerous other considerations involved in the decision to add winter wheat including determining whether a farm is set up to plant, spray, harvest, and store another crop. For farms that have the option to double crop soybeans on wheat acres, a scenario that involves adding wheat/double crops soybeans to the crop mix would be of interest.
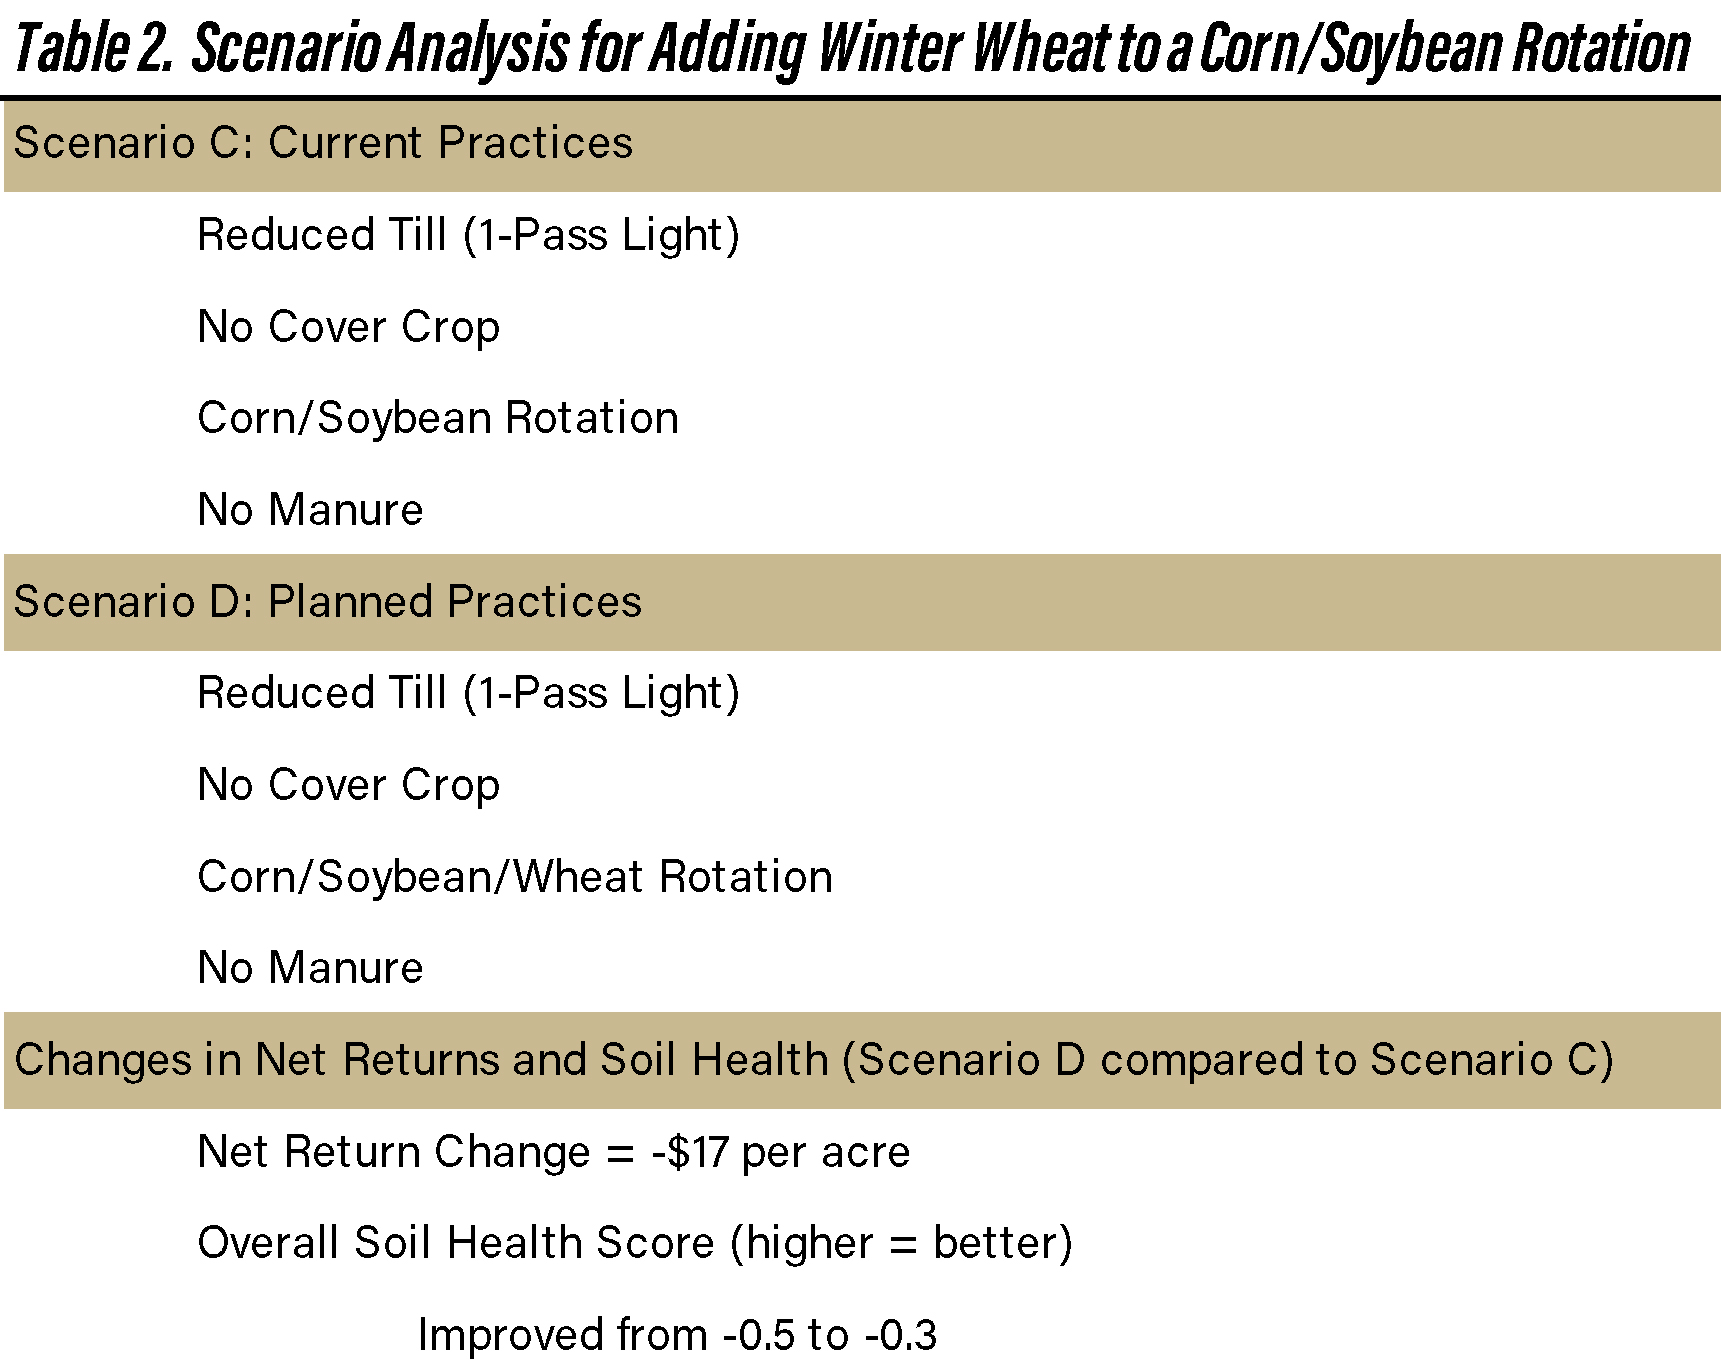
Table 2. Scenario Analysis for Adding Winter Wheat to a Corn/Soybean Rotation
Table 3 illustrates scenarios (E and F) for corn and soybeans related to the use of cover crops. Using cover crops reduced soil loss, reduced GHG emissions, and improved the overall soil health score from -0.5 to 0.0. The drop in yield for corn and soybeans associated with the use of cover crops was 8 and 3 bushels per acre, respectively. Due to differences in gross returns and costs, net returns per acre for the corn/soybean rotation declined by $36 per acre with the use of cover crops. The large difference in net returns between scenarios E and F are consistent with the relative low use of cover crops in Iowa, Illinois, and Indiana reported in Plastina et al. (2024). Using data from the 2012, 2017, and 2022 Census of Agriculture, Plastina et al. (2024) noted that the adoption rate for cover crops in 2022 represented only 5.1% of crop acres. The net change in acreage from 2012 to 2022 was only 3.0%.
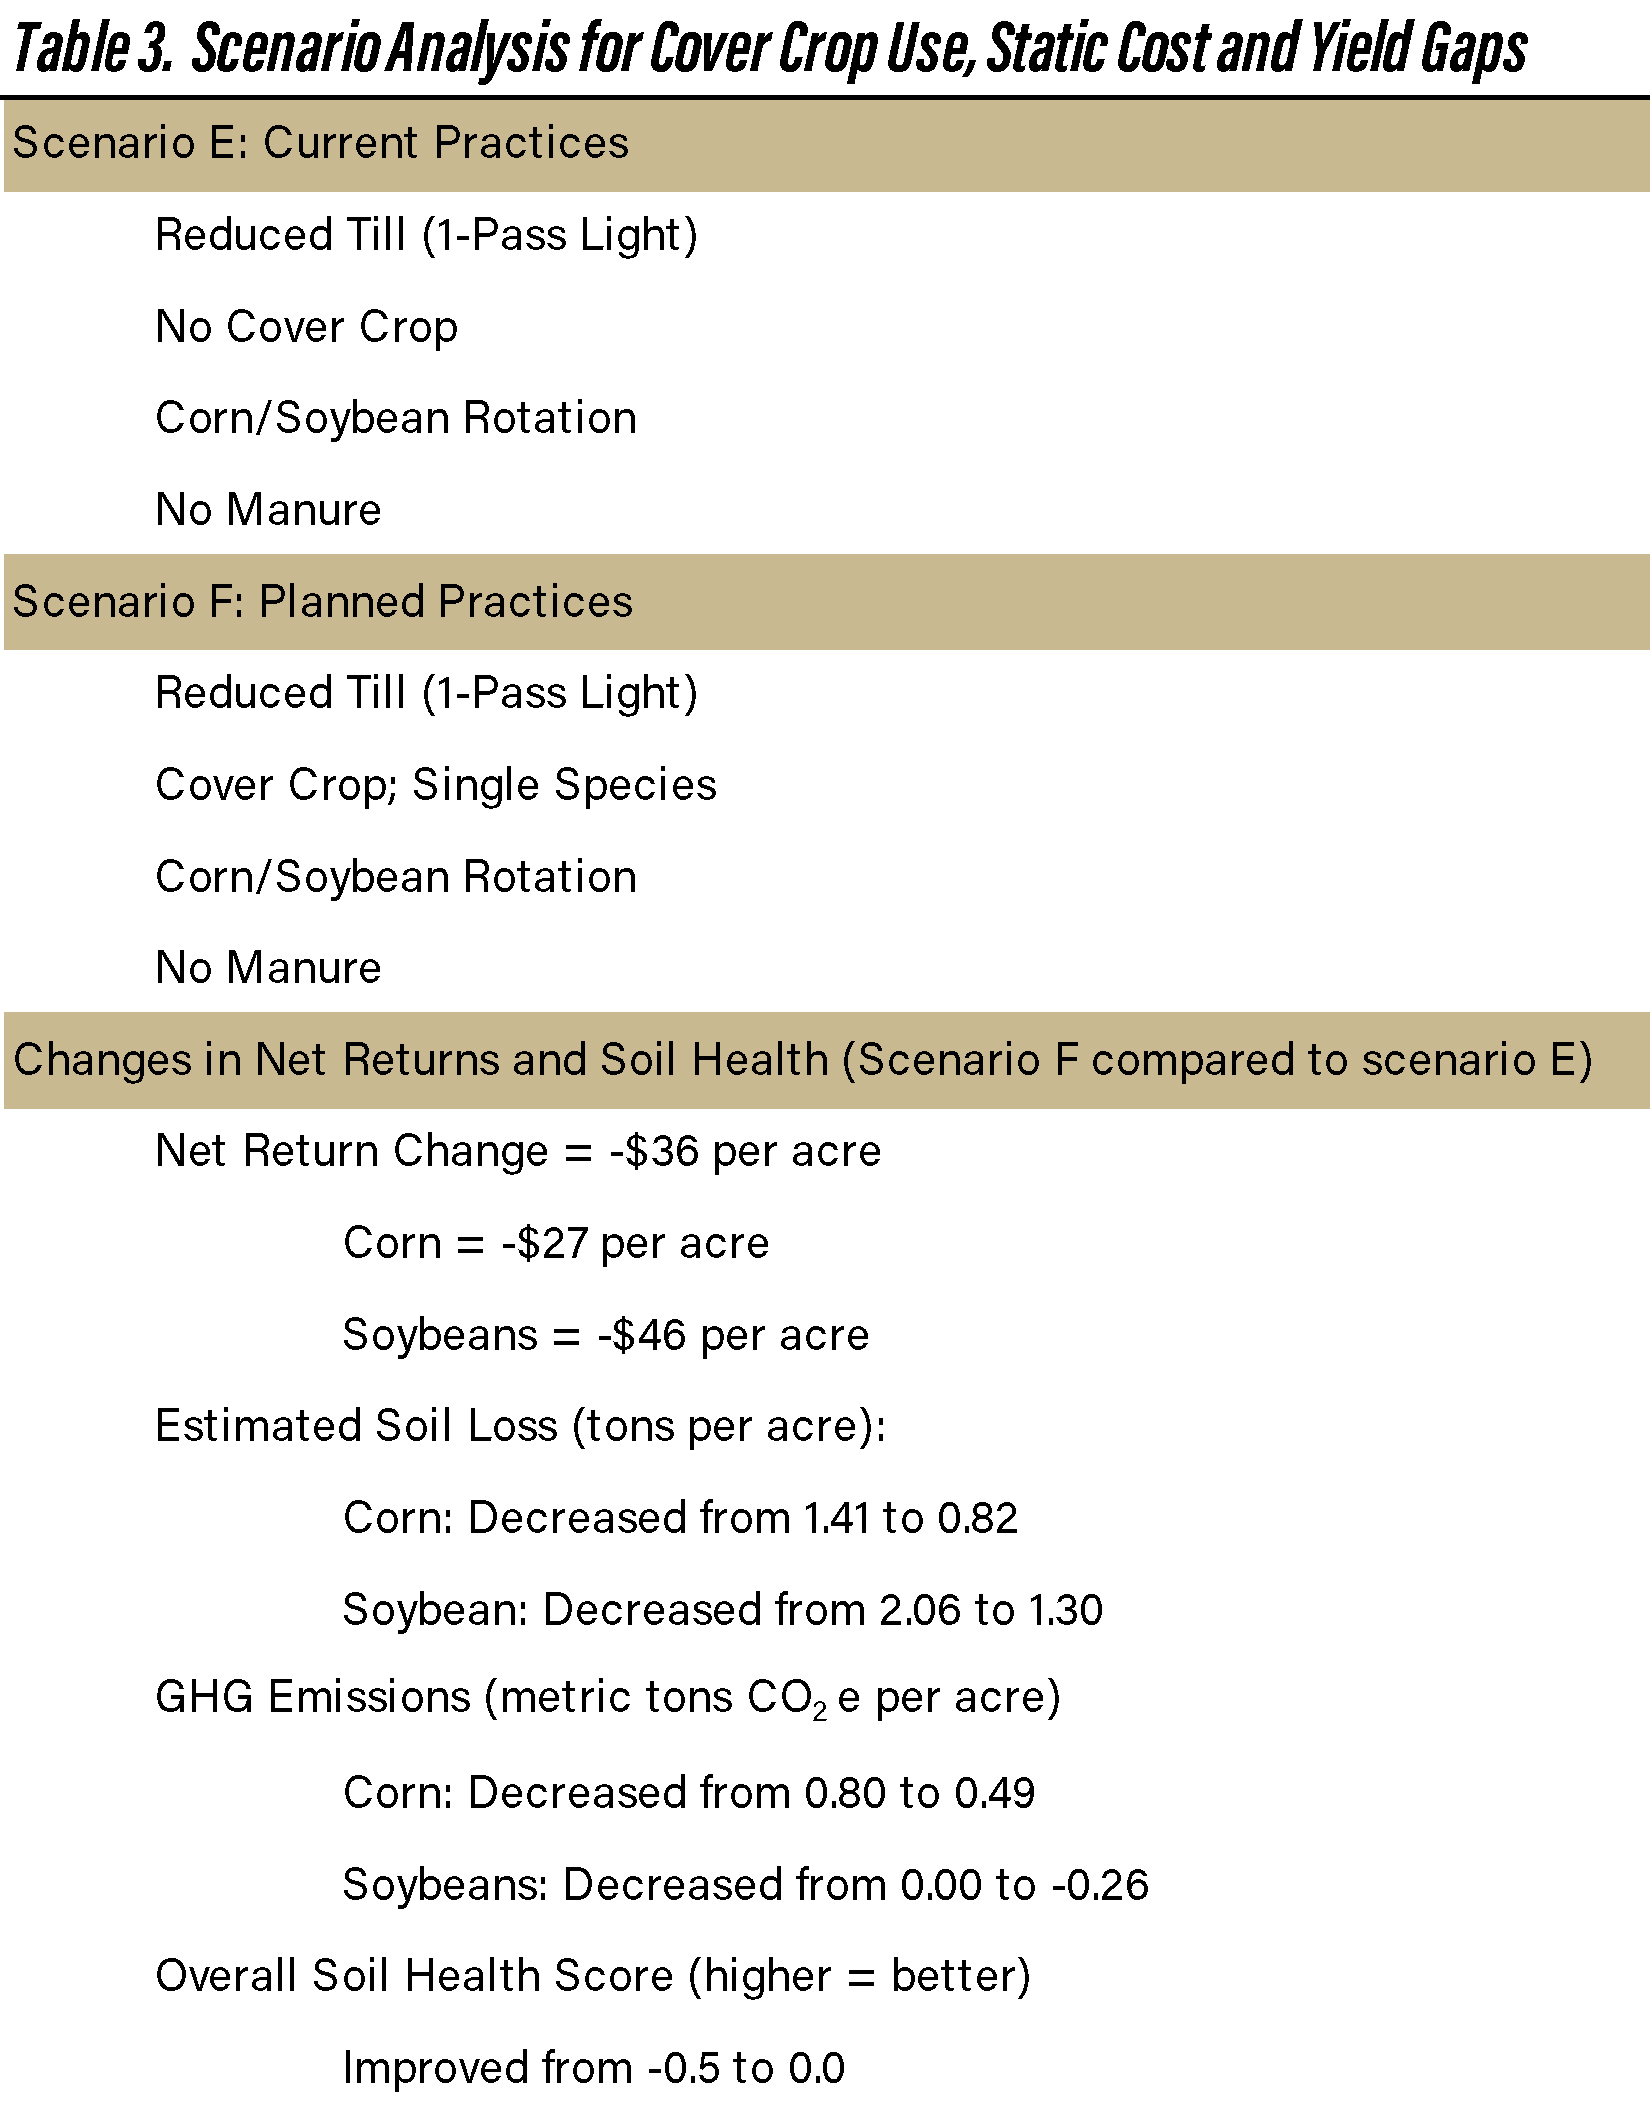
Table 3. Scenario Analysis for Cover Crop Use, Static Cost and Yield Gaps
As noted by Chen (2025), the benefits associated with cover crops often accrue over time. To account for this fact, we created scenarios below for which the fertilizer costs dropped by $20 per acre for both corn and soybeans (table 4) and for which the corn and soybean yield gaps between the no cover crop scenario and cover crop use scenario shrunk to zero over a ten-year period (table 5).
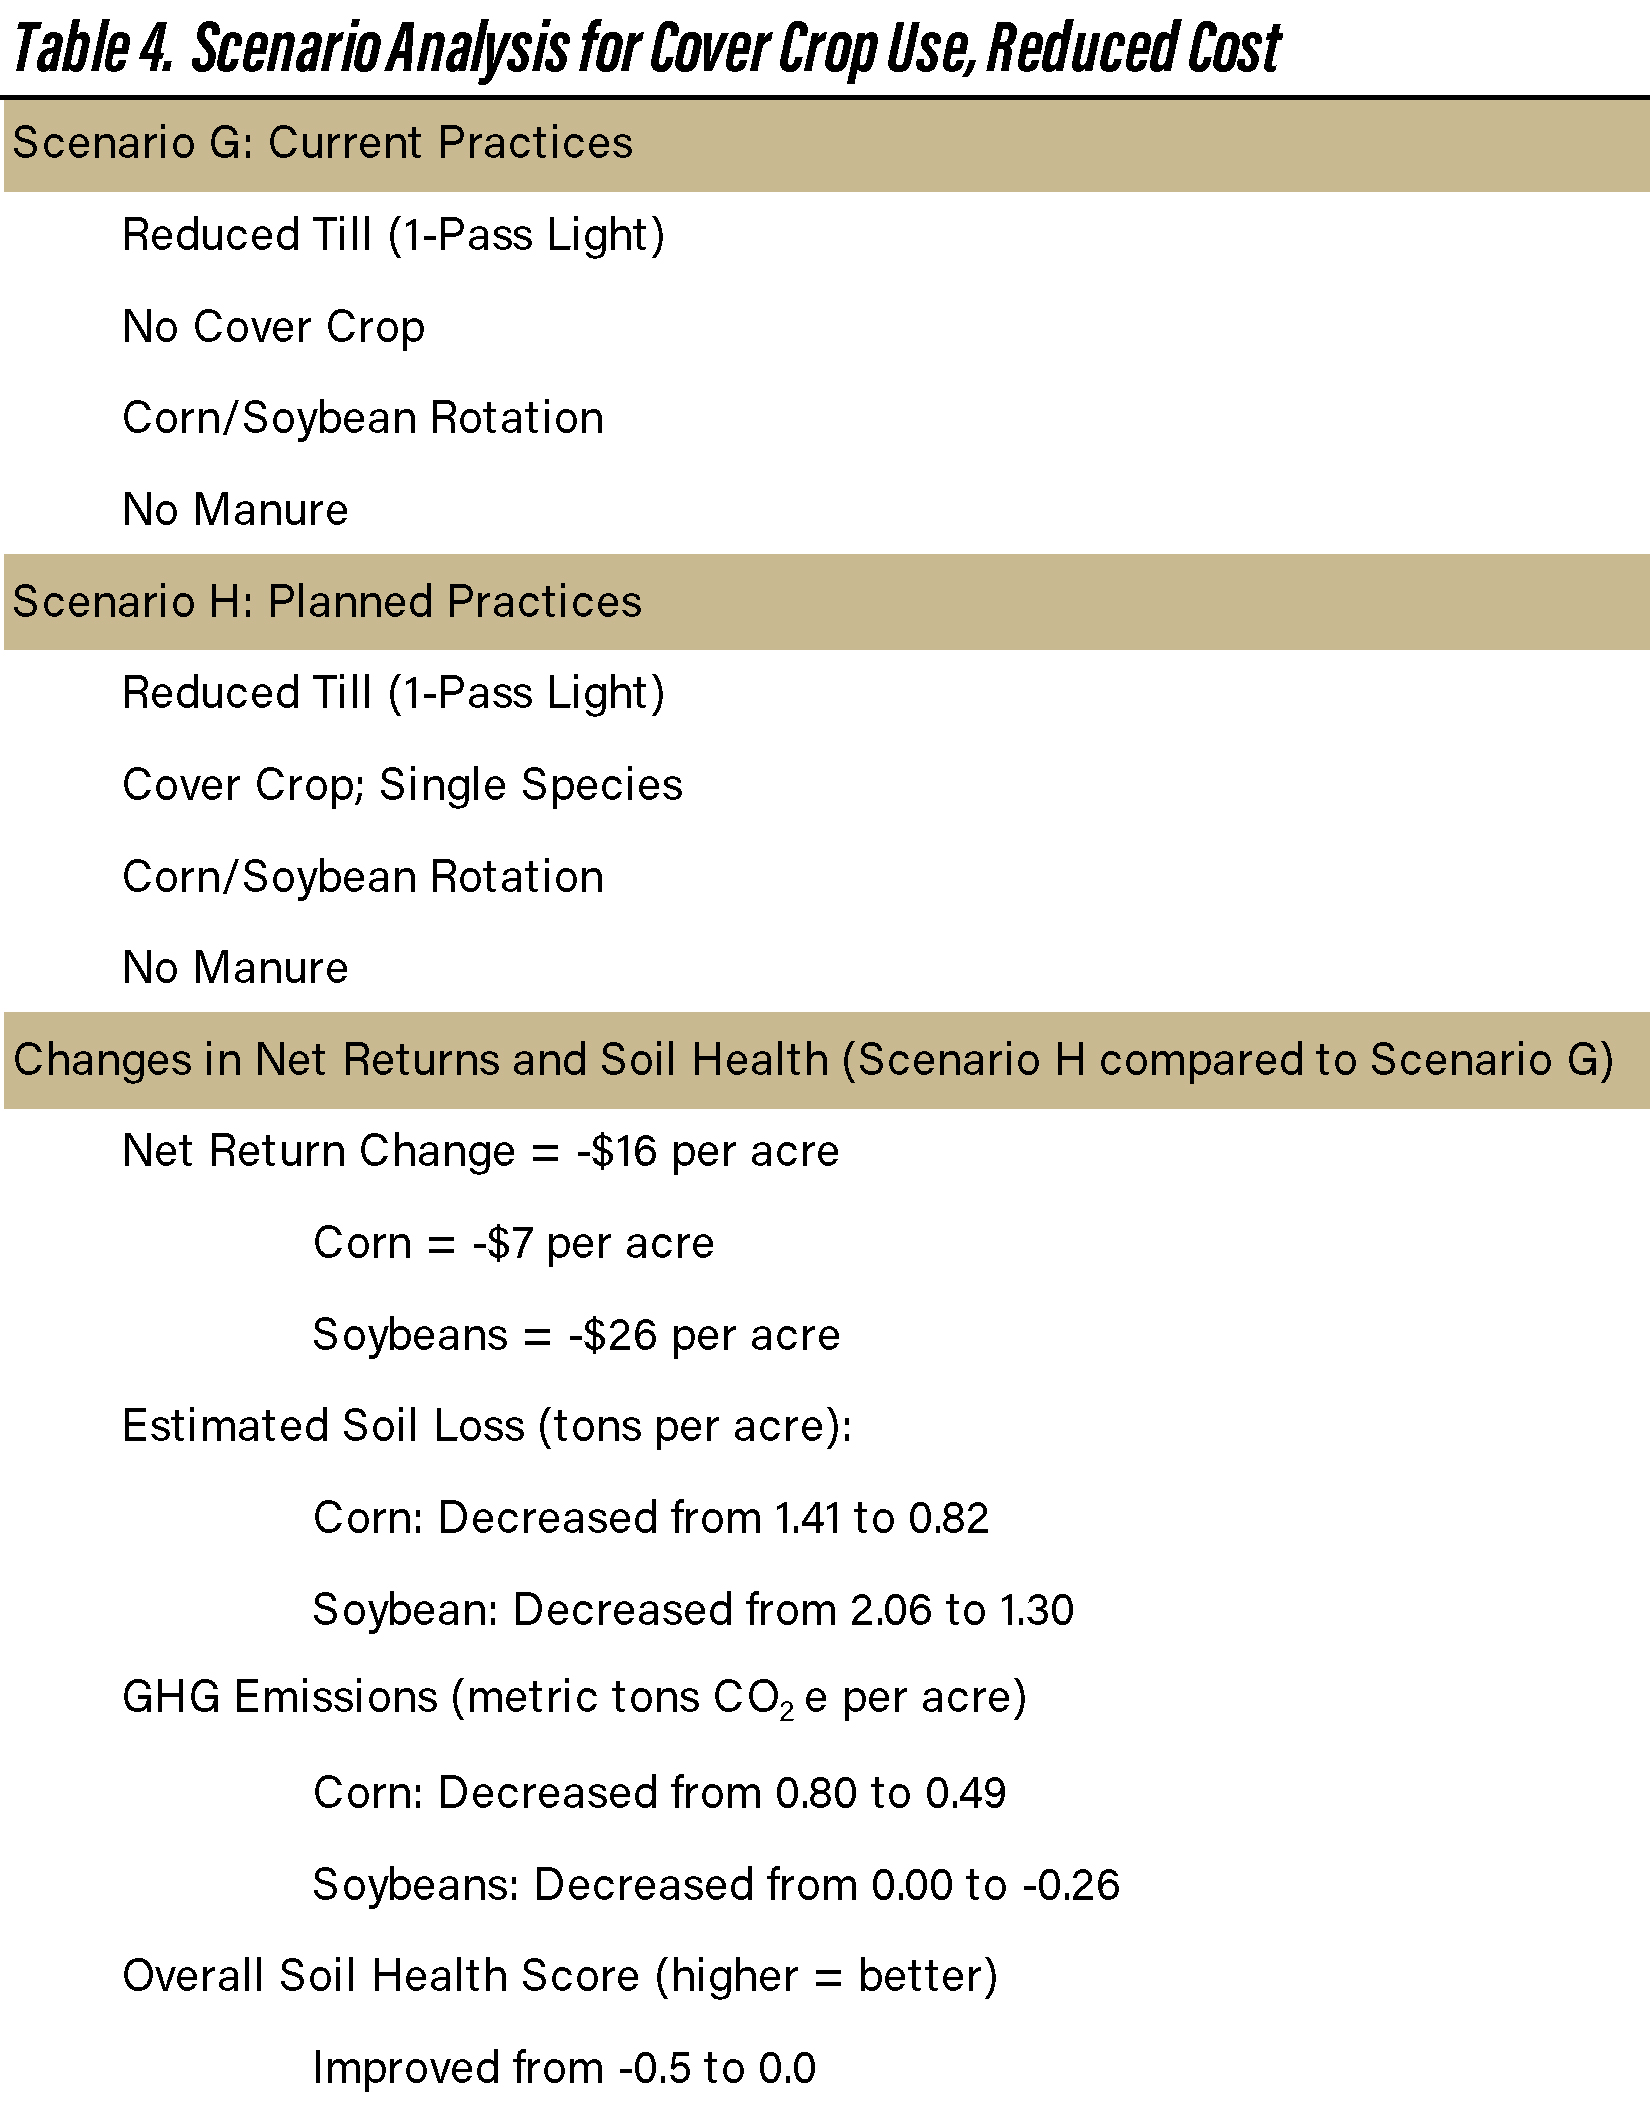
Table 4. Scenario Analysis for Cover Crop Use, Reduced Cost
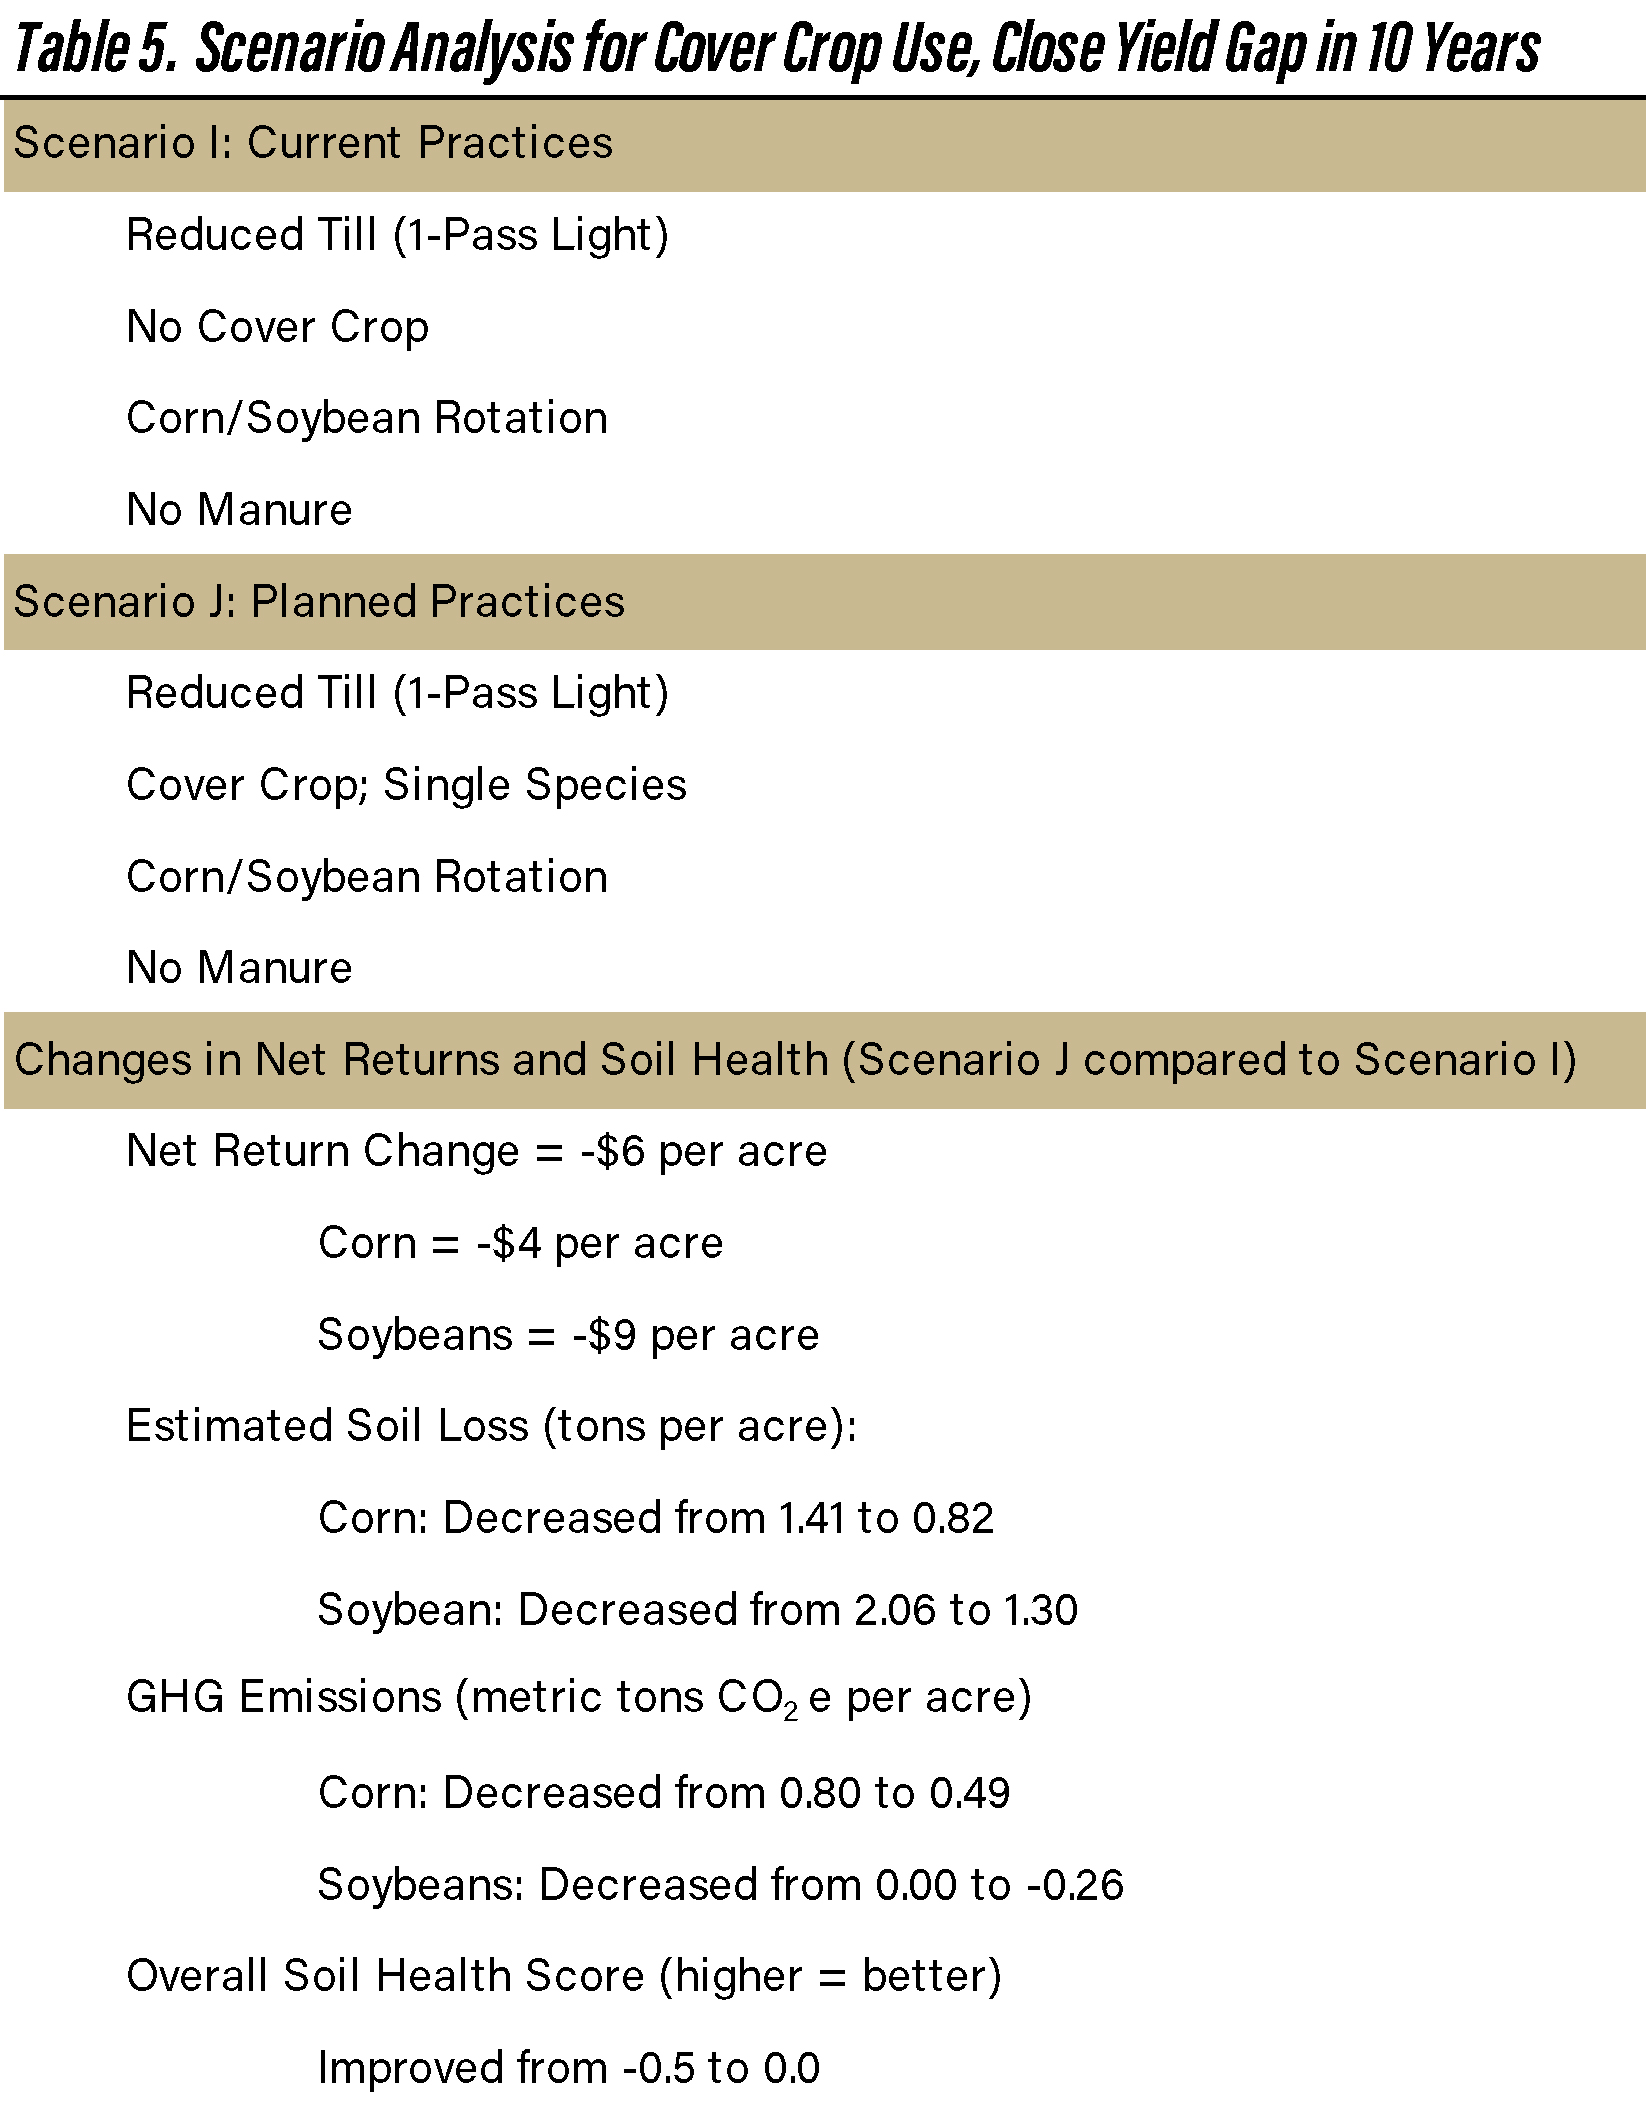
Table 5. Scenario Analysis for Cover Crop Use, Close Yield Gap in 10 Years
The impact of a potential reduction in fertilizer costs on cover crop use is illustrated in table 4. Changes in soil loss, GHG emissions, and the overall soil health score are the same as they were in table 3. In this case, the drop in rotational net returns falls to $16 per acre. If cost reductions are possible with the use of cover crops, the decision to use cover crops becomes more difficult.
Table 5 illustrates the use of cover crops assuming the yield gaps between corn and soybeans associated with the use of cover crops shrink to zero over a 10-year period (Scenario J). Again, the changes in soil loss, GHG emissions, and overall soil health score remain the same as those illustrated in table 3. In this case, the decline in net returns for the rotation is only $6 per acre. Those for which the conservation goal is very important and/or that prioritize long-run goals rather than short-run profits would certainly find cover crops more appealing under the assumptions in table 5.
Using scenario analysis does not provide an optimal solution when farm goals are multi-dimensional. Rather, it provides a mechanism to explore how a change in the operation impacts multiple goals. How would a farm use the information in tables 1-5? Think of the scenarios as choice experiments. A farm that ranks soil conservation as their most important goal may prefer scenarios that improve soil health (scenarios B, D, F, H, or J) over scenarios with less attractive soil health characteristics (scenarios A, C, E, G, or I). Conversely, a farm that ranks profit maximization as their most important goal, but is also concerned about soil health, may focus on comparisons with the least impact on net returns (e.g., scenario A versus scenario B, or scenario I versus scenario J).
The scenarios examined in this article focused on profit maximization and conservation. These scenarios would be helpful when trying to close the soil health gap (Maharjan et al., 2020) or when evaluating incentives associated with various carbon programs (Plastina, 2024). Conservation practices were examined one at a time rather as a suite. It would be possible to examine a suite of conservation practices or incorporate goals other than profit maximization and conservation into a scenario analysis. The key is to compare current practices to planned practices and to analyze the change in each goal represented by the change in practices.
Conclusions
This article develops a conceptual framework that can be used to examine tradeoffs between soil conservation, profitability, and other farm goals. The conceptual framework is illustrated by examining tradeoffs between conservation and profit maximization. Scenario planning is used to compare scenarios that depict current practices with planned practices. Specifically, scenarios address the adoption of no-till practices, the addition of winter wheat to a corn/soybean crop rotation, and cover crop use. Of the three conservation practices, the adoption of no-till practices improved overall soil health and was less expensive to adopt than the other two practices. Results help explain why winter wheat is not commonly rotated with corn and soybeans, and why the adoption of no-till is much more widespread than the use of cover crops in the Eastern Corn Belt.
Citations
Boehlje, M. and C. Ehmke. “Capital Investment Analysis and Project Assessment.” Purdue Extension, EC-731, June 2005.
Chen, L., R.M. Rejesus, Z.S. Brown, C.N. Boyer, and J.A. Larson. “Dynamically Optimal Cover Crop Adoption.” European Review of Agricultural Economics, forthcoming, 2025.
Courtney, H., J. Kirkland, and P. Viguerie. “Strategy Under Uncertainty.” Harvard Business Review, November-December 1997, pages 1-16.
Cusser, S., C. Bahlai, S.M. Swinton, G.P. Robertson. “Long-Term Research Avoids Spurious and Misleading Trends in Sustainability Attributes of No-Till.” Global Change Biology. 26(2020):3715-3725.
Gessaman, P.H. “Identifying Farm/Ranch and Family Goals.” Business Management in Agriculture, EM 8340, Oregon State University Extension Service, September 1987.
Langemeier, M. “Examining the Relationship between Crop Net Returns, Risk, and Conservation Practices.” in Strategic Tillage and Soil Management, edited by R. Nogueira de Sousa, Agricultural Sciences, IntechOpen, 2023.
Langemeier, M. “Comparison of Conventional and Organic Crop Rotations: Spreadsheet Tool.” Center for Commercial Agriculture, Purdue University, April 2024.
Langemeier, M. “Farm Goals.” Center for Commercial Agriculture, Purdue University, July 2025.
Maharjan, B., S. Das, and B.S. Acharya. “Soil Health Gap: A Concept to Establish a Benchmark for Soil Health Management.” Global Ecology and Conservation.” 23(2020):1-6.
Plastina, A. “Carbon Intensity Score Calculator.” Ag Decision Maker, Iowa State University, A1-80, July 2024.
Plastina, A., W. Sawadgo, and E. Okonkwo. “Cover Crop Adoption Decelerates and No-Till Area Stagnates in the I-States.” CARD Agricultural Policy Review, Iowa State University, Winter 2024.
Precision Conservation Management. The Business Case for Conservation: Cost-Benefit Analysis of Conservation Practices. 2015-2024 Data Summary. Champaign, Illinois: Precision Conservation Management, 2025.
Schwartz, P. and D. Randall. “Ahead of the Curve: Anticipating Strategic Surprise.” in Blindside, edited by F. Fukuyama. Washington, D.C.: Brookings Institution Press, 2007.
Soil Health Nexus. Soil Health Matrix Decision Tool, Soil Health Matrix Decision Tool – Soil Health Nexus, accessed April 16, 2025.
Sull, D. The Upside of Turbulence: Seizing Opportunity in an Uncertain World. New York: Harper Collins, 2009.
![]()
![]()
![]()
![]()
![]()
TAGS:
TEAM LINKS:

RELATED RESOURCES
UPCOMING EVENTS
We are taking a short break, but please plan to join us at one of our future programs that is a little farther in the future.