September 16, 2020
Measuring Farm Profitability
by Michael Langemeier
![]()
![]()
![]()
![]()
![]()
Farm profitability can be measured using earnings before interest, taxes, and amortization (EBITA), net farm income, operating profit margin ratio, rate of return on farm assets, and rate of return on farm equity. EBITA, as the name implies, is used to cover interest, taxes, and amortization, which includes depreciation on machinery and buildings. Net farm income is used for family living, to repay debt, and to purchase new and used assets. Though these two measures are extremely important to monitor over time on a particular farm, due to the fact that these measures depend on farm size, it seldom makes sense to compare EBITA and net farm income with other farms. Because they take into account farm size, the profitability measures other than EBITA and net farm income are more useful when making comparisons among farms. The rates of return on assets and equity are extremely useful when comparing farm investments with other investments. However, these two measures are sensitive to how farm assets are valued on the balance sheet. For this reason, the operating profit margin is more conducive for benchmarking profitability among farms. In this article, a case farm in west central Indiana is used to examine operating profit margin benchmarks.
The operating profit margin ratio is computed by adding interest expense and subtracting operator and family labor from net farm income, and dividing the result by value of farm production. Net farm income, interest expense, and value of farm production can be obtained from the farm’s income statement. A discussion of an accrual income statement can be found (here). Operator and family labor can be estimated using family living expenditures. At first glance, it seems odd to add interest expense and subtract operator and family labor from net farm income. There are important reasons for making these two adjustments. Including interest expense in the computation of the operating profit margin ratio makes it easier to compare farms with very little debt to farms with high debt to asset ratios. Net farm income plus interest expense can be thought of as a return to equity and debt used in the business. Including operator and family labor in the computation enables us to compare farms that rely solely on operator and family labor to those for which hired labor is a major proportion of the labor used on the farm. Unlike operator and family labor, hired labor is an expense reported on an income statement. Subtracting operator and family labor from net farm income in the computation of the operating profit margin ratio ensures that both hired labor and operator and family labor are incorporated into our benchmarks.
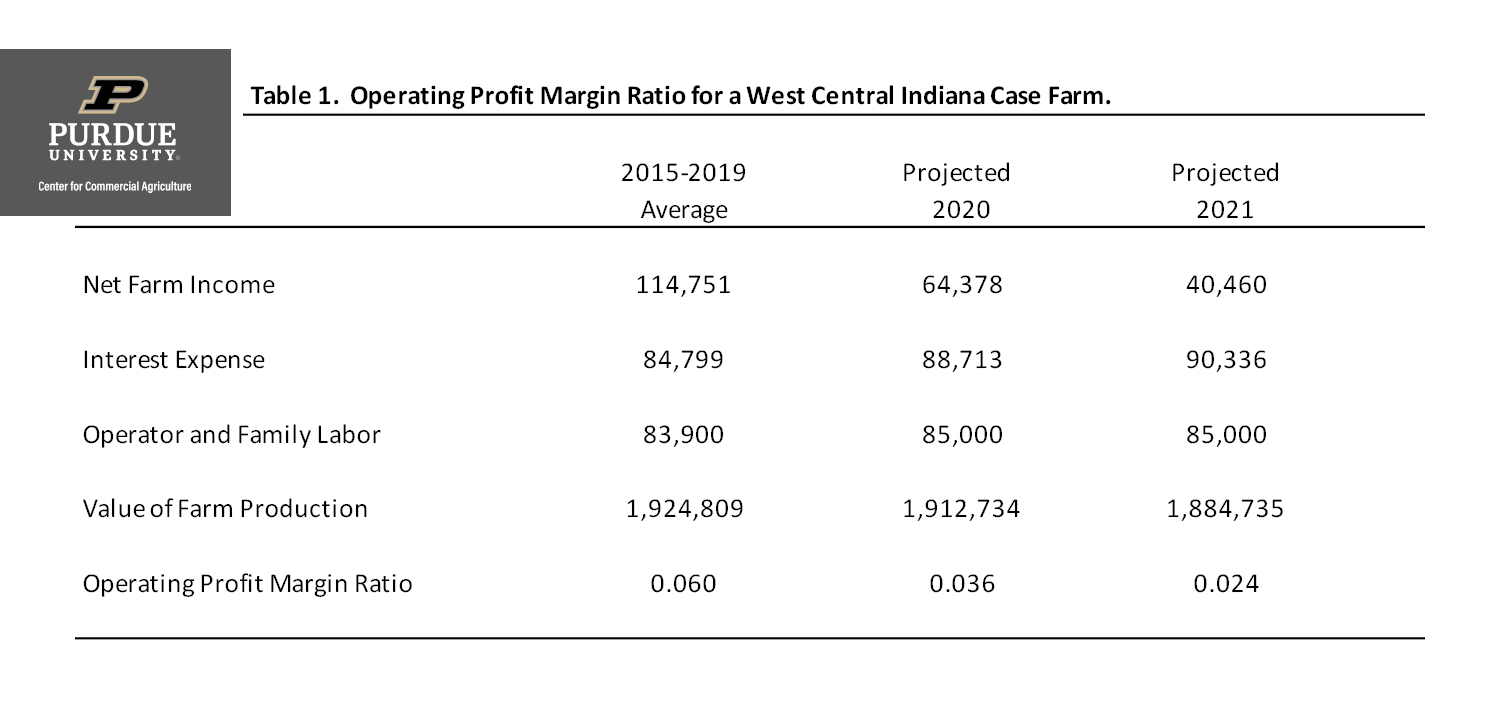
Table 1. Operating Profit Margin Ratio for a West Central Indiana Case Farm.
Table 1 presents the computation of the operating profit margin ratio for a west central Indiana case farm. The case farm has 3000 acres of corn and soybeans. Of the 3000 acres operated by the farm, 2250 acres are cash rented from several landlords and 750 acres are owned. The columns in table 1 compare the projections for 2020 and 2021 with the five-year average ratio for the 2015 to 2019 period. Using stoplight terminology, the “green” region for the operating profit margin ratio is 20 percent and above, the “yellow” region applies to a ratio between 10 and 20 percent, and the “red” region applies to a ratio below 10 percent. These benchmarks apply to long-run performance, not individual years. Notice that the performance for this case farm was considerably below the 20 percent benchmark during the last several years.
To further evaluate the performance of the case farm, we can compare the farm’s profit margin from 2015 to 2019 to data obtained from the Illinois Farm Business and Farm Management (FBFM) Association and the Center for Farm Financial Management (FINBIN database). The median operating profit margin from these two sources for the most recent five-year period for which data are available was from 5 to 6 percent. Using this information, the case farm’s performance during the time period was average.
This article discussed the measurement of farm profitability. Using a case farm, the computation of the operating profit margin ratio was illustrated and discussed. The historical profit margin for the case farm is similar to that experienced by other farms during the 2015 to 2019 period. The operating profit margins projections for 2020 and 2021 at 3.6 and 2.4 percent, respectively, are relatively low, even compared to the most recent five-year period.
![]()
![]()
![]()
![]()
![]()
TEAM LINKS:

PART OF A SERIES:

RELATED RESOURCES
UPCOMING EVENTS
We are taking a short break, but please plan to join us at one of our future programs that is a little farther in the future.