Analysis of global tree population explains baffling trends in species richness
Local species richness, the number of species that coexist in a local community, is a key measure of biodiversity. Scientists have known for more than 200 years that large numbers of local species live near the equator, then decline toward the middle and higher latitudes. However, why local species richness differs from place to place remains largely unknown.
Purdue University has now led a study involving 249 co-authors from more than 50 nations that analyzed a database of unrivaled size and detail to understand the geographic variation of local tree species richness across the world’s forested regions, and the underlying causes of this global pattern. They found that multiple factors, such as landforms, soil, and human impact, control local species richness, especially in the tropics.
“Conventionally, people would’ve expected that temperature and precipitation are the main drivers behind the local species richness and biodiversity patterns,” said Jingjing Liang, associate professor of quantitative forest ecology at Purdue. “However, one of the surprises that we found, especially in the tropical region, is that it is actually a combination of different factors."
The study, based on 1.3 million sample plots and 55 million trees archived in the Global Forest Biodiversity Initiative database, appears in the journal Nature Ecology and Evolution. The co-author list includes 11 Purdue scientists affiliated with the Forest Advanced Computing and Artificial Intelligence Laboratory, the departments of Forestry and Natural Resources and Botany and Plant Pathology, and the Rosen Center for Advanced Computing.
“It is exciting to see the leadership skills and technical knowledge that Jingjing brings to enable a global assessment of biodiversity patterns. He brought together an impressive group of experts and lots of data to accomplish this important task.” said Karen Plaut, Purdue’s Glenn W. Sample Dean of Agriculture.
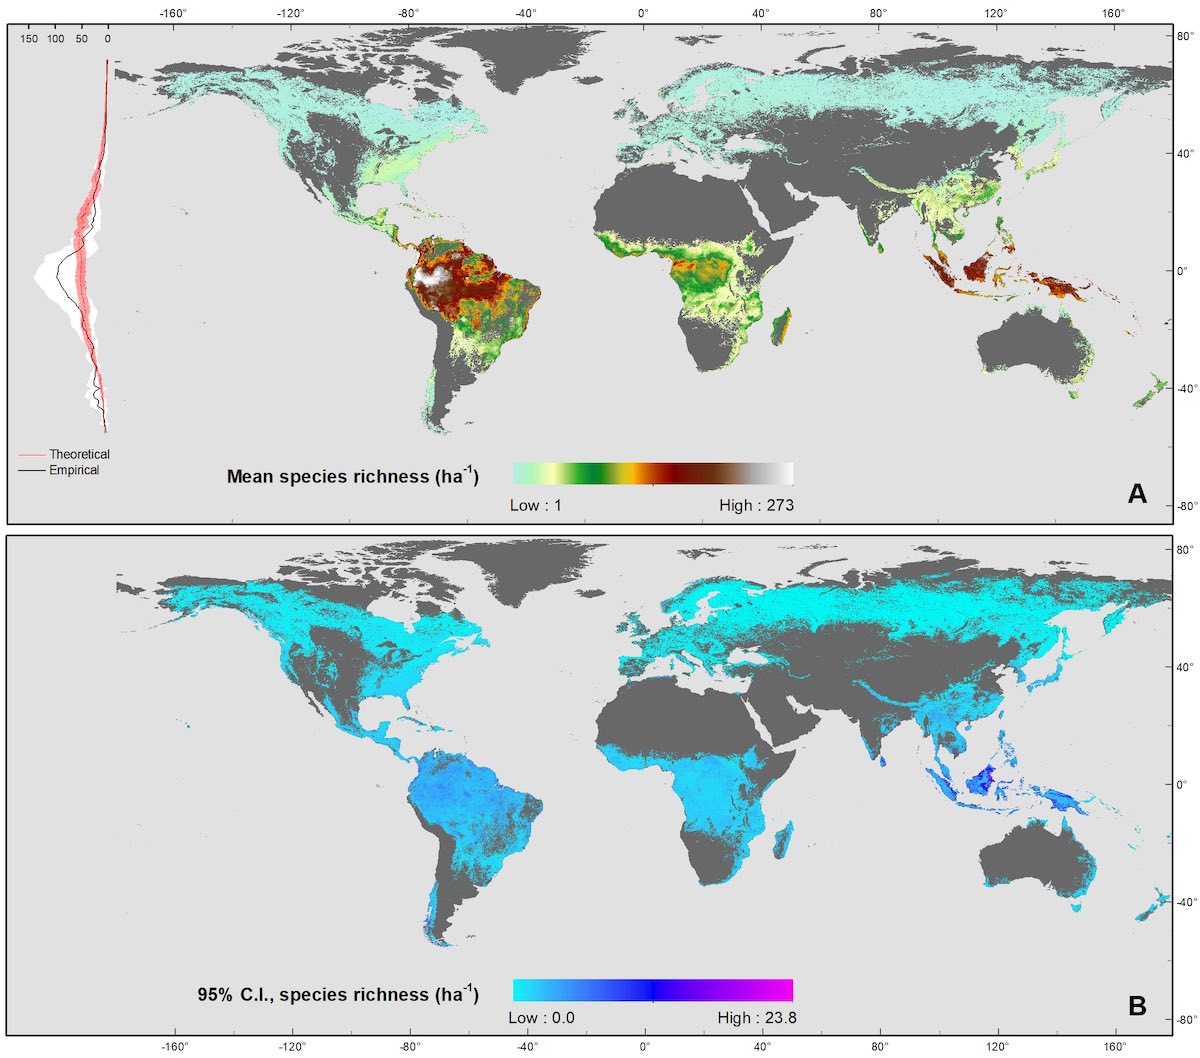
They meshed the findings, covering 97% of the world’s forests, with previously established trends of species richness of other organisms by latitude. The trend starts at on average 98 species per hectare (an area covering nearly 2.5 acres) at the equator. The number of species declines until it becomes stable at about four species per hectare at both 50 degrees north and south of the equator. The team pinpointed locations of the most diverse tropical forests on Earth (in Amazonia with more than 200 tree species per hectare), as well as the most diverse temperate forests (in south-central Chile with up to 50 species per hectare).
“Given the very limited resources available for biodiversity conservation, the high-resolution species-richness and co-limitation maps produced here are foundational to optimizing conservation efforts globally as well as locally,” said study co-author Mo Zhou, associate professor of forest economics and management at Purdue. “They will help enable spatially explicit and coherent planning that is ecologically sound and economically efficient.”
One-third of the study co-authors are based in traditionally underrepresented regions such as Africa and South America. Liang was able to harness the strengths of his highly diverse team via Science-i, a web-based platform that he founded.
“Every single aspect of the project is documented and made available to every co-author instantaneously, so everyone can discuss, contribute and provide inputs in a transparent, fair, and streamlined fashion,” Liang said.
 Jingjing Liang, professor of qualitative forest ecology, in Purdue University’s high performance computing facility used to process data on more than 38 million trees worldwide. Liang is a professor in Purdue’s Department of Forestry and Natural Resources.
The research will help scientists better understand the dire statistics for life on Earth, said study co-author Bryan Pijanowski, director of Purdue’s Center for Global Soundscapes. “One out of every seven species is in the threatened-endangered category. Right now, we don’t have good assessments of what creates the natural patterns of diversity that we've seen on Earth and how human disturbance affects that. The paper focuses on both of those aspects.”
The resources at Purdue’s Rosen Center for Advanced Computing, including the Brown and Bell supercomputing clusters, were needed to process the gigabytes of data that the co-authors provided. But first, the researchers had to organize and format their massive global data set in the same way, then analyze it with one modeling approach.
“The analysis and modeling framework that was used in this study is really quite novel in itself,” said study co-author Douglass Jacobs, the Fred M. van Eck Professor of Forest Biology and Associate Department Head of Purdue Extension. “One of the most exciting things about this paper is the potential to use the same type of framework to tackle even more pressing, more ambitious questions in the future.”
The possibilities for future work include using the global network and database to look at patterns of change in biodiversity over a period of years.
“Scientists are trying to quantify climate-change impacts at a local, regional, and potentially global scale,” Jacobs said. Such studies could help answer questions related to how climate change affects tree growth and survival at various scales.
Scientists from underrepresented nations around the world can now leverage the Science-i platform to propose new ideas that the entire team can help support.
“There are brilliant young scientists from developing countries across the world, but they are limited by their resources to conduct high-impact research,” Liang said.
 This map shows the number of tree species per hectare across the global forest range, which was derived using data from ~1.3 million global forest inventory plots compiled and standardized by the research team.
 A PhD student working in the Jacobs lab already is taking advantage of the Science-i platform. Aziz Ebrahimi had studied the Persian walnut of Iran earlier in his career. Now he uses Science-i to survey the global diversity of walnut species.
A task ahead will be to make it easier for scientists everywhere to obtain clean, consistent and readily adapted datasets from underrepresented regions of the world.
“That could be a research initiative in its own right. And Jingjing has the platform to accomplish that goal,” Jacobs said.
In a separate but related NASA-funded project, Liang and Pijanowski have combined their efforts to map global biodiversity patterns by using their datasets on tree diversity and animal sounds. With these datasets—the largest of their kind in the world—the duo will map global diversity patterns while accounting for their natural and human-driven causes. Plus, they continue to add new data collected by passive recording devices, drones, and sensors mounted on the International Space Station.
“We've been challenged for hundreds of years to understand biodiversity patterns on Earth,” Pijanowski said. “It's only recently that we are able to collect the data and assemble it and bring it all together and have the computers help us to analyze it. I'm hoping that this is the first of many studies on different kinds of organisms at a global scale.”
This work is supported in part by the U.S. Department of Agriculture (1017711 and 1016676), National Aeronautics and Space Administration (12000401), and the National Science Foundation (NSF-DBI-2021898).


