October 5, 2023
Corn and Soybean Basis Weaken as Harvest Heats Up
by Nathanael Thompson


As harvest heats up across the Midwest corn and soybean basis have been weakening. Weakening basis during harvest is typical of seasonal basis patterns. Therefore, to give context to current basis levels it is helpful to compare them to historical basis levels. For example, looking at the 2019-2020, 2020-2021, and 2021-2022 crop marketing years, corn basis in Central Indiana declined by $0.31/bu. on average from the first week of September to the first week of October (blue line in Figure 1). However, notice that corn basis last year declined by more than $0.50/bu. over this same time period (green line in Figure 1). Weaker than normal basis last fall was largely influenced by transportation disruptions caused by low Mississippi River levels. Low river levels are again a factor in the fall of 2023. As a result, corn basis levels in Central Indiana are tracking 2022 basis levels nearly identically (black line in Figure 1).
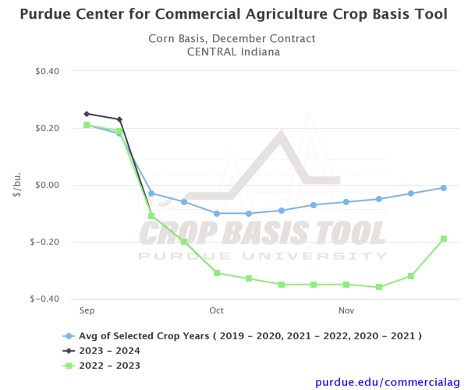
Figure 1. Corn Basis, December Contract Central Indiana, Purdue Center for Commercial Agriculture Crop Basis Tool
Looking at corn basis levels for terminals along the Ohio River paints a slightly different picture (Figure 2). While current basis levels are much weaker than normal—basis during the first week of October is $-0.45/bu. compared to an average of -$0.11/bu. during the 2019-2020, 2020-2021, and 2021-2022 crop marketing years—notice that basis appears to have firmed this week and is $0.55/bu. stronger than the same date last year.
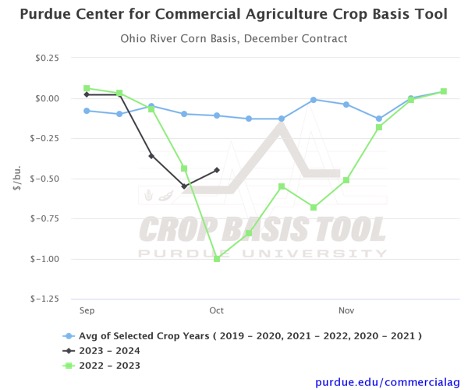
Figure 2. Ohio River Corn Basis, December Contract, Purdue Center for Commercial Agriculture Crop Basis Tool
The story for soybean basis is similar. Soybean basis in Central Indiana has declined by $0.66/bu. from the first week of September to the first week of October 2023 (black line in Figure 3). As a result, current soybean basis for the first week of October—$0.55/bu. under November 2023 soybean futures—is $0.14/bu. weaker than the same week last year and $0.23/bu. weaker than the two-year average of the 2020-2021 and 2021-2022 crop marketing years.
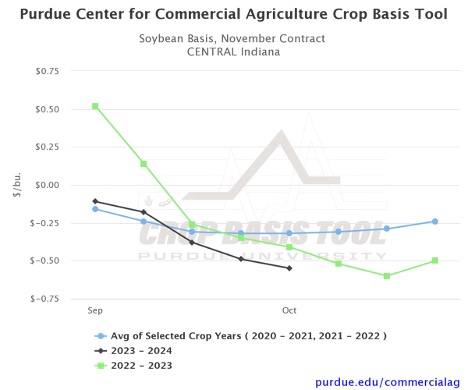
Figure 3. Soybean Basis, November Contract Central Indiana, Purdue Center for Commercial Agriculture Crop Basis Tool
However, similar to corn, soybean basis at terminals along the Ohio River have actually firmed this week (Figure 4). Nonetheless, soybean basis at these locations—currently $0.73/bu. under November 2023 soybean futures—are $0.62/bu. weaker than the two-year average of the 2020-2021 and 2021-2022 crop marketing years and very similar to soybean basis at these locations for the same week last year.
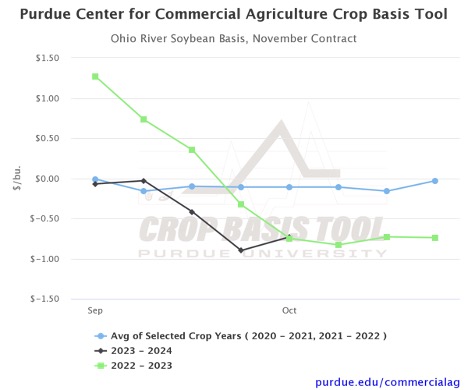
Figure 4. Ohio River Soybean Basis, November Contract, Purdue Center for Commercial Agriculture Crop Basis Tool
Corn and soybean basis levels typically reach their seasonal lows during the month of October. However, it is important to point out that river levels are not projected to improve over the next month. Therefore, the risk of lower basis levels remains yet this fall.
Visit the Purdue Crop Basis Tool to check current corn and soybean basis levels and historical basis trends for your local area.
TAGS:
TEAM LINKS:

RELATED RESOURCES
UPCOMING EVENTS
Join educators from across the Midwest to build skills for communicating soil health concepts on Nov. 4-5, 2026. In the field, we’ll evaluate the relationship between soil health and water management focusing on irrigation and edge of field practices. The in-service will have both classroom and on farm demonstrations.
The Land of Opportunity: A Conference for Farmland Owners will be held at two locations on October 5 and October 6, providing farmland owners with valuable information and resources to help them make informed decisions about their land. The conference will feature keynote presentations, educational breakout sessions, and networking opportunities designed specifically for those who own, manage, or have an interest in farmland.