March 7, 2024
Corn and Soybean Basis Continue to Steadily Strengthen at Most Eastern Corn Belt Locations
by Nathanael Thompson
![]()
![]()
![]()
![]()
![]()
In recent weeks, many Eastern Corn Belt locations have seen steady to slightly stronger corn and soybean basis levels. For example, corn basis in central Indiana for the first week of March was $0.24/bu. under May ’24 corn futures (Figure 1). This is $0.05/bu. stronger than the first week of February, but still about $0.18/bu. weaker than the historical 3-year average corn basis for the region. This weakness in corn basis levels relative to historical levels is something we have been dealing with since harvest in the fall of 2023. However, it is worth noting that the difference between 2023-2024 basis levels and typical basis levels in the most recent three years (2020-2021, 2021-2022, and 2022-2023) has been steadily narrowing. This trend is likely to continue for the next 4-6 weeks. However, as we approach planting of the ’24 crop, new crop conditions will begin to weigh heavily on old crop basis levels. As a result, our research has shown that predicting basis levels during May, June, and July is very difficult. Those still owning ’23 crop will want to be cognizant of this risk and pay close attention to basis levels if they plan to continue owning grain into the summer months.
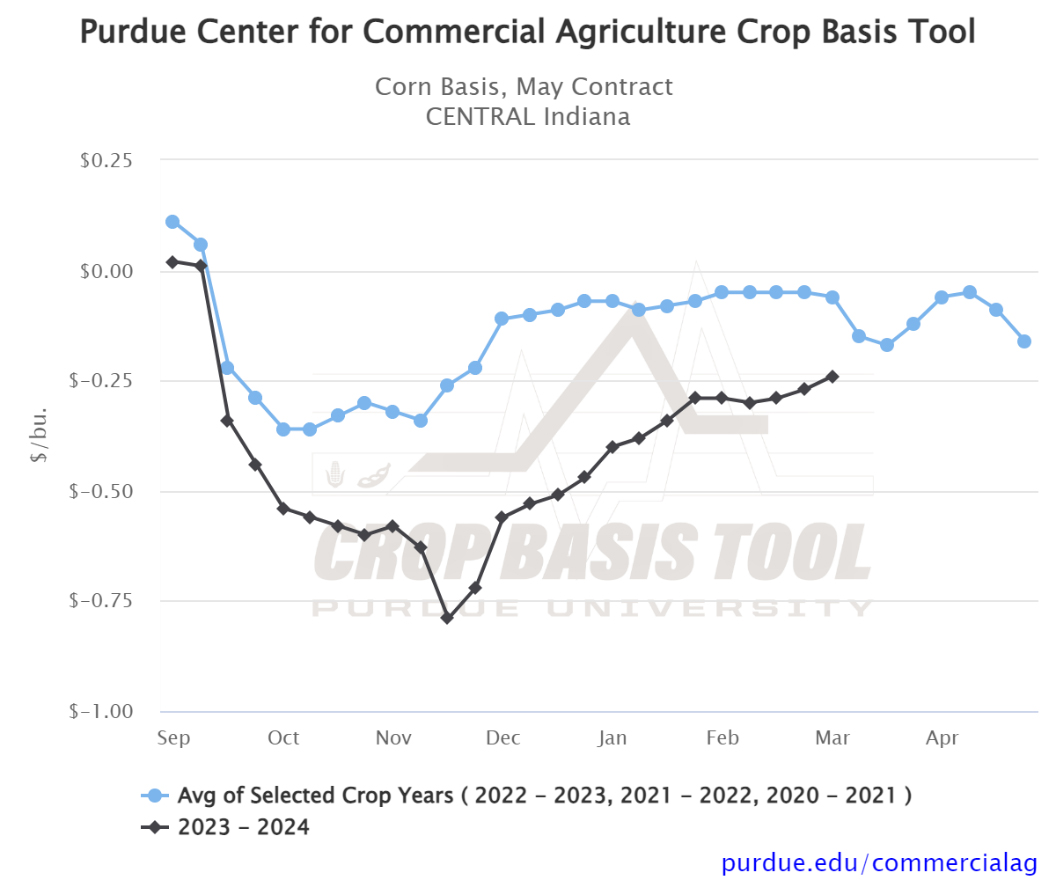
Figure 1. Corn Basis, May Contract for Central Indiana
Source: Purdue Center for Commercial Agriculture Crop Basis Tool
Soybean basis in central Indiana for the first week of March was $0.25/bu. under May ’24 soybean futures (Figure 2). This is just $0.01/bu. stronger than the first week of February, but is $0.09/bu. weaker than the historical 2-year average soybean basis for the region.
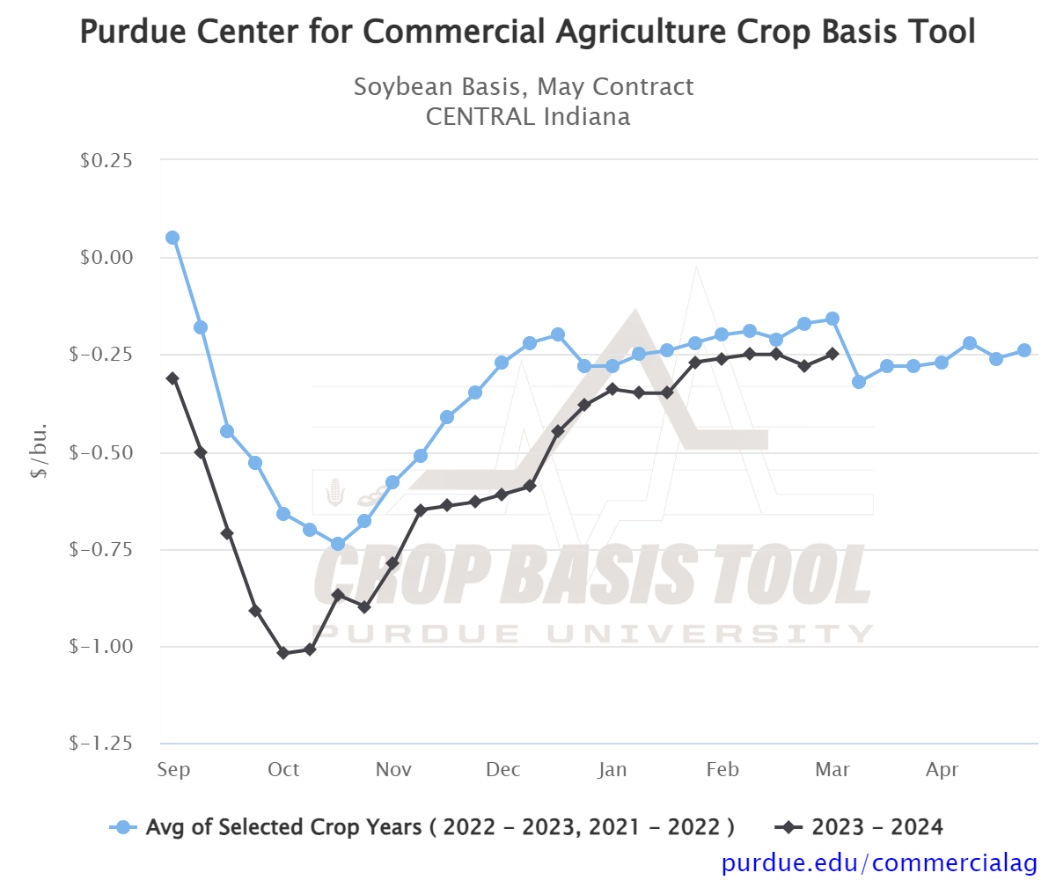
Figure 2. Soybean Basis, May Contract for Central Indiana
Source: Purdue Center for Commercial Agriculture Crop Basis Tool
It is also worth noting that as of my last update in early February, corn and soybean basis at Ohio River terminals had taken an unseasonal dip prior to February USDA and CONAB adjustments to Brazilian production. Not surprisingly, corn and soybean basis at Ohio River terminals strengthened in response to reduced Brazilian production estimates (Figure 3). For example, soybean basis at Ohio River terminals for the first week of March was $0.06/bu. over May ’24 soybean futures. This is $0.17/bu. stronger than the first week of February, but is still $0.17/bu. weaker than the historical 2-year average soybean basis for these terminals. With nearly half of Brazilian soybean harvest complete at this point, we will continue to pay attention to Brazilian production as it plays a critical role in soybean export markets. As always, be sure to visit the Purdue Center for Commercial Agriculture Crop Basis Tool to check current corn and soybean basis levels and historical basis trends in your local area.
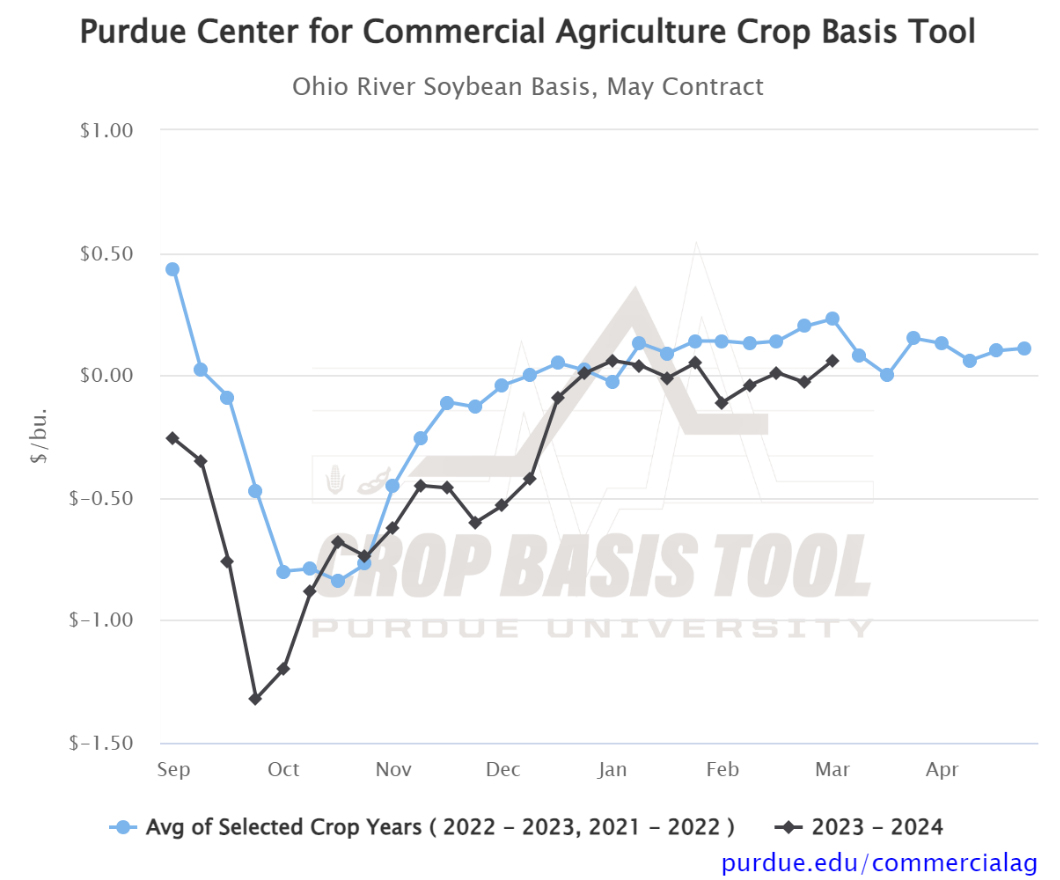
Figure 3. Ohio River Soybean Basis, May Contract
Source: Purdue Center for Commercial Agriculture Crop Basis Tool
![]()
![]()
![]()
![]()
![]()
TAGS:
TEAM LINKS:

RELATED RESOURCES
UPCOMING EVENTS
We are taking a short break, but please plan to join us at one of our future programs that is a little farther in the future.