June 7, 2024
Stay Tuned for Possible Basis Swings This Summer
by James Mintert and Josh Strine
![]()
![]()
![]()
![]()
![]()
Since early May, Indiana corn basis has flattened or improved modestly, depending on the location. Corn basis levels throughout Indiana remain well below their three-year average as illustrated in Figures 1 and 2. Although basis levels remain below their multi-year average, basis has risen sharply since the low points observed last fall. For example, when measured from its fall low to early June, central Indiana corn basis increased by $0.65/bu. which was $0.16/bu. more than the average basis increase of the prior three years. Similarly, July corn basis at Indiana ethanol plants over the same period improved by about $0.68/bu. compared to an average increase of just $0.48/bu.
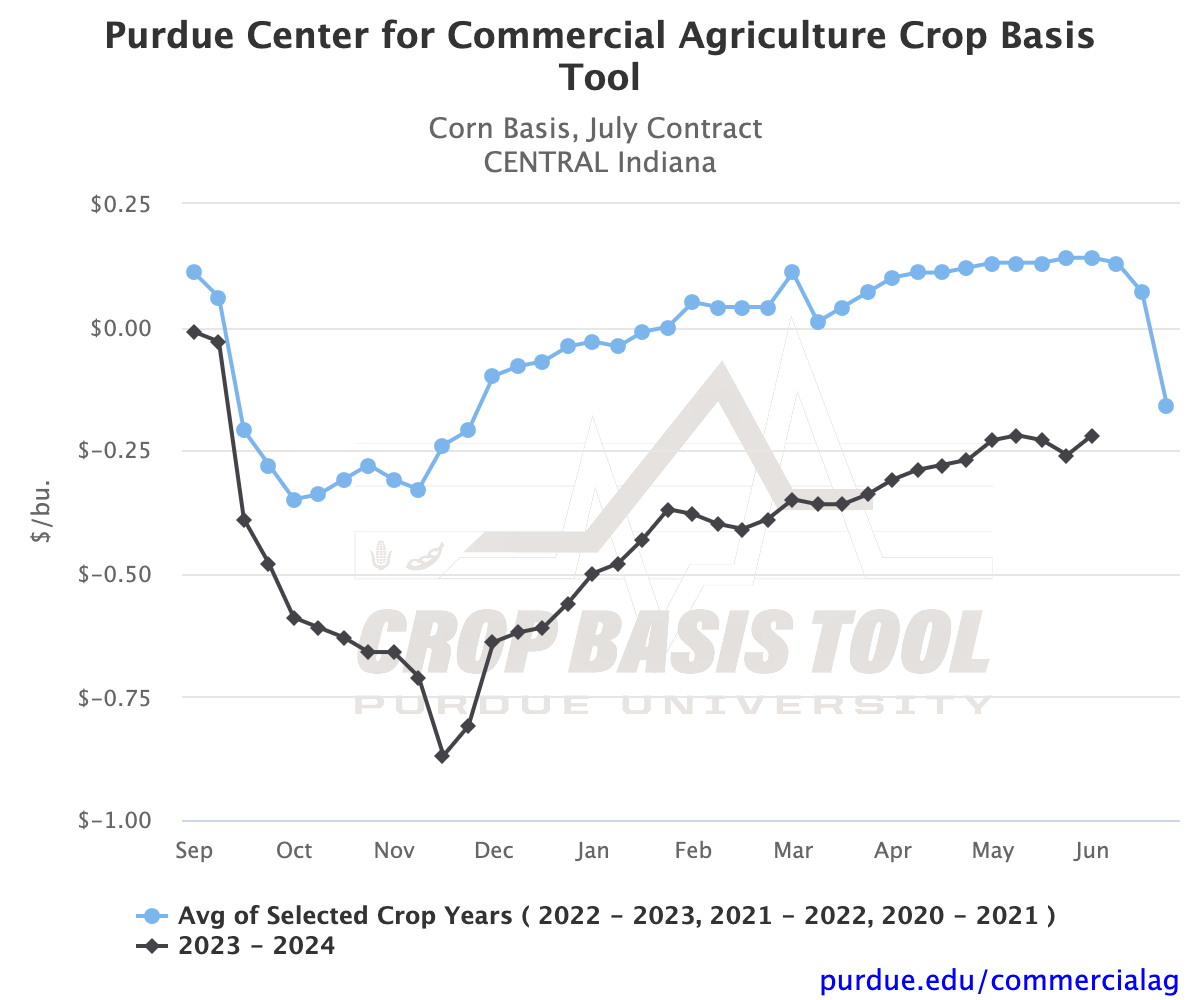
Figure 1.
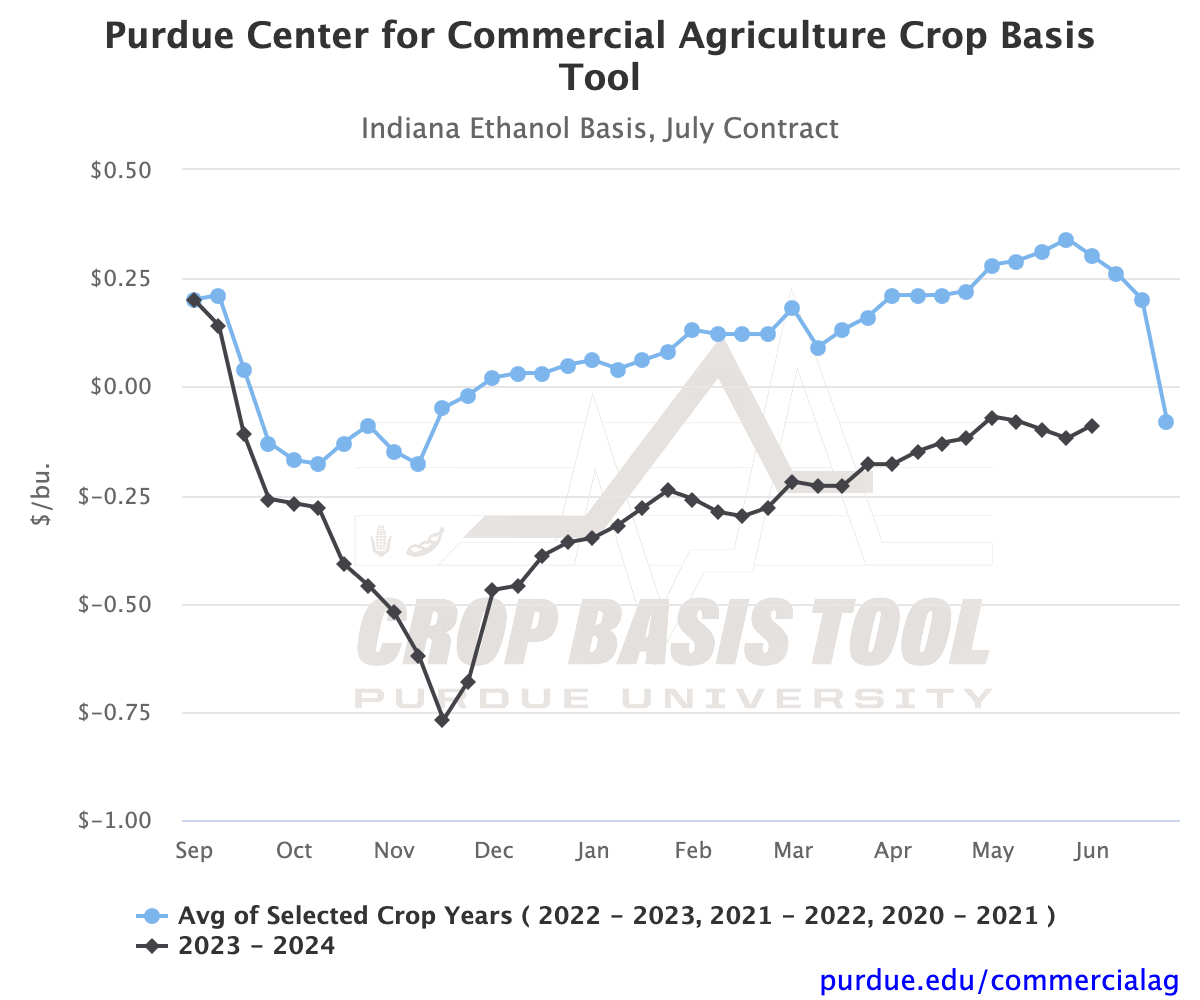
Figure 2.
Similar to corn, Indiana soybean basis levels remain below the multi-year average (figures 3 and 4). Also, like corn, soybean basis levels have increased sharply since the lows established during last fall’s harvest. One notable difference between this year’s corn and soybean basis changes since fall is that, unlike corn, the increase in soybean basis from last fall to early June has been about equal to or a bit less than average. For example, central Indiana soybean basis has improved by about $0.86/bu. from its fall low to early June vs. an average increase of about $0.89/bu. Soybean processor basis over the same time rose about $0.90/bu. compared to an average increase of just over $1/bu.
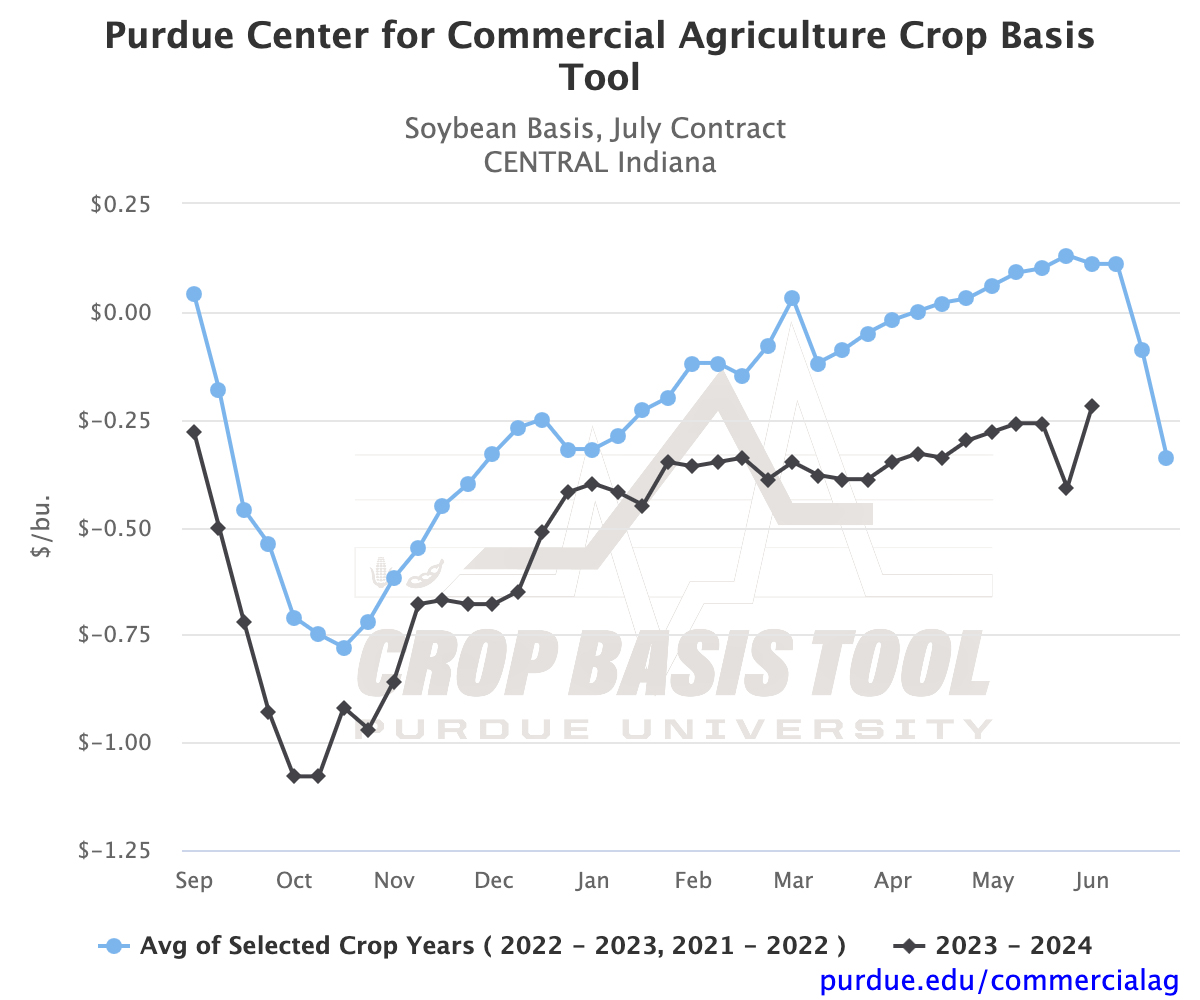
Figure 3.
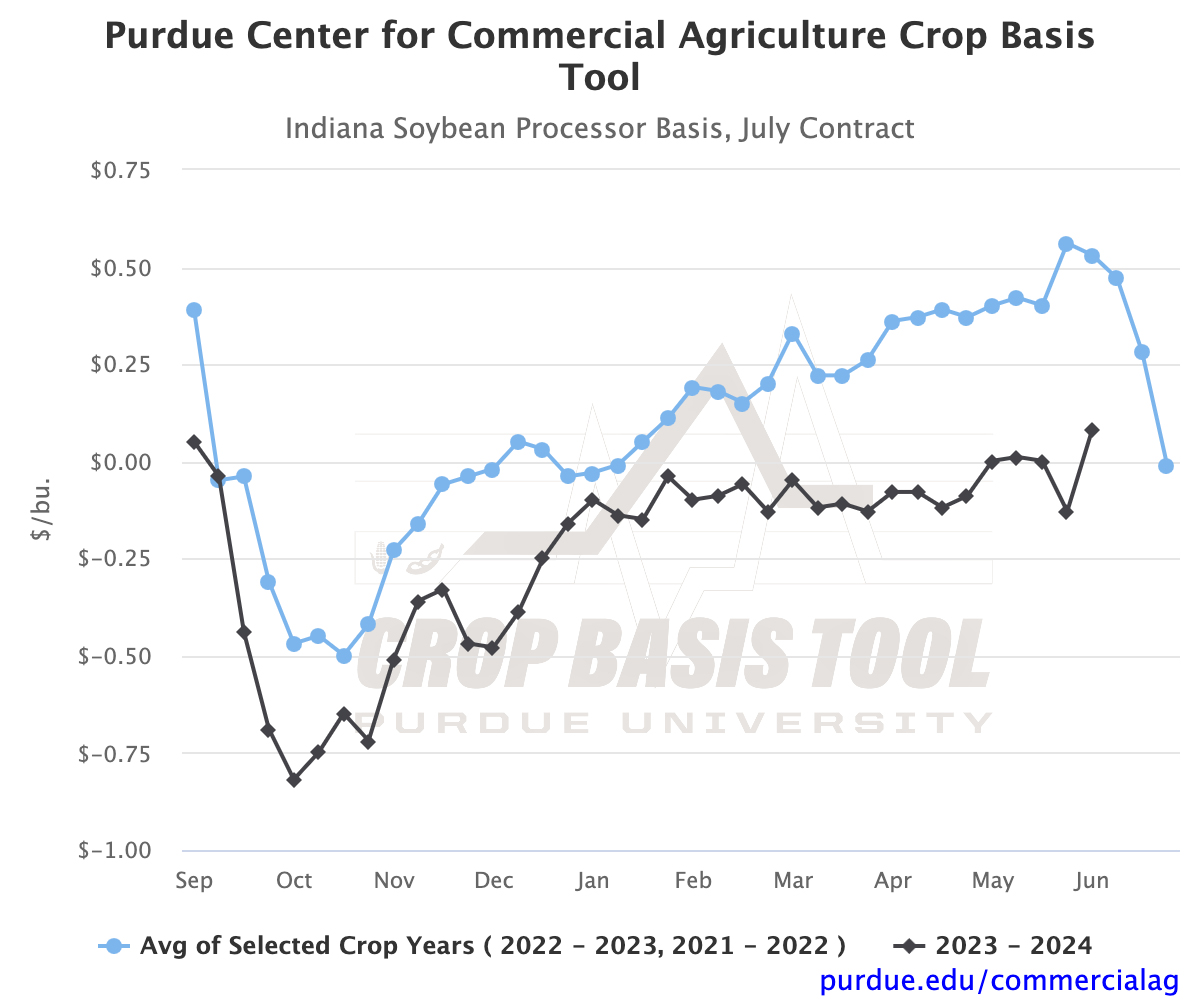
Figure 4.
The corn and soybean basis charts provide a note of caution for producers still holding old crop inventories. Historical analysis indicates that basis predictability drops off sharply by late June and early July. The charts suggest that, on average, corn and soybean basis weakens as the growing season progresses. In reality, basis levels for the rest of the summer will be heavily influenced by Corn Belt growing conditions and crop production expectations which could lead to wide swings in basis between now and the end of the storage season. As always, be sure to visit the Purdue Center for Commercial Agriculture Crop Basis Tool to check current corn and soybean basis levels and historical basis trends in your local area.
![]()
![]()
![]()
![]()
![]()
TAGS:
TEAM LINKS:

RELATED RESOURCES
UPCOMING EVENTS
We are taking a short break, but please plan to join us at one of our future programs that is a little farther in the future.