June 5, 2025
Decomposition of Statement of Cash Flows
by Michael Langemeier
![]()
![]()
![]()
![]()
![]()
There are three major categories of cash on a statement of cash flows (often referred to as a sources and uses of funds statement): cash provided by operating activities, cash provided by investing activities, and cash provided by financing activities. Cash provided by operating activities includes gross cash farm income, total cash farm expense, and net cash provided by hedging transactions. Typically, net cash provided by operating activities is positive and can be used to invest in assets or repay debt. Cash provided by investing activities includes purchases of farm and non-farm assets, and sales of farm and non-farm assets. Typically, purchases are larger than sales, so the net cash provided by financing activities is negative. Cash provided by financing activities includes money borrowed, principal payments, personal income, owner withdrawals, capital contributions and distributions, and gifts and inheritances. Net cash provided by financing activities can be negative or positive. Farms that are expanding typically have a positive net cash provided by financing activities because they are using borrowed funds to help pay for asset purchases. This article examines changes in cash flows from 2007 to 2024 for a sample of farms and decomposes these changes into three components: cash provided by operating activities, cash provided by investing activities, and cash provided by financing activities.
FINBIN data from 2007 to 2024 for all crop farms were utilized in this study. Specifically, annual data from the statement of cash flows for all crop farms were summarized. Table 1 contains the average, standard, deviation, and coefficient of variation (standard deviation divided by average) for the three major cash categories over the time period. On average, cash provided by operating activities was $167,147. Net investment averaged -$182,851 and net cash provided by financing activities averaged $21,779. Cash provided by financing activities was considerably more variable that the other two cash categories.
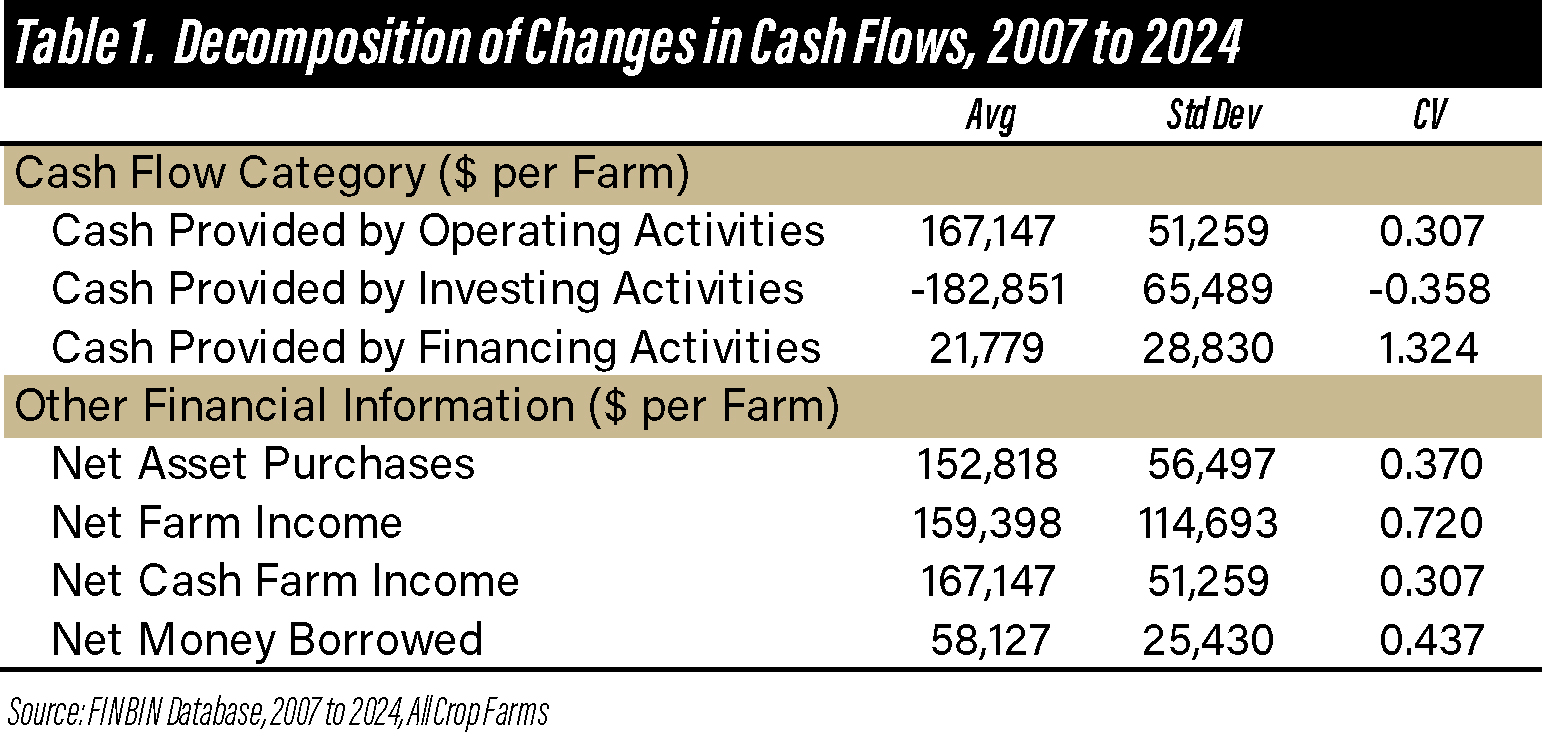
Table 1. Decomposition of Changes in Cash Flows, 2007 to 2024
Table 1 also provides summary statistics for net asset purchases, net farm income, net cash farm income, and net money borrowed. Farm income is used for owner withdrawals, to repay debt, and to provide down payments on asset purchases. The fact that net cash provided by financing activities and net money borrowed are positive suggests that these crop farms were using debt, along with net cash provided by operating activities, to expand. The relative variability of net farm income was much higher than the relative variability of net cash farm income. Using the cash method of accounting to report taxes not only allows farms to mitigate income taxes, it also enables farms to smooth out their net cash income, which is very helpful from a working capital management standpoint.
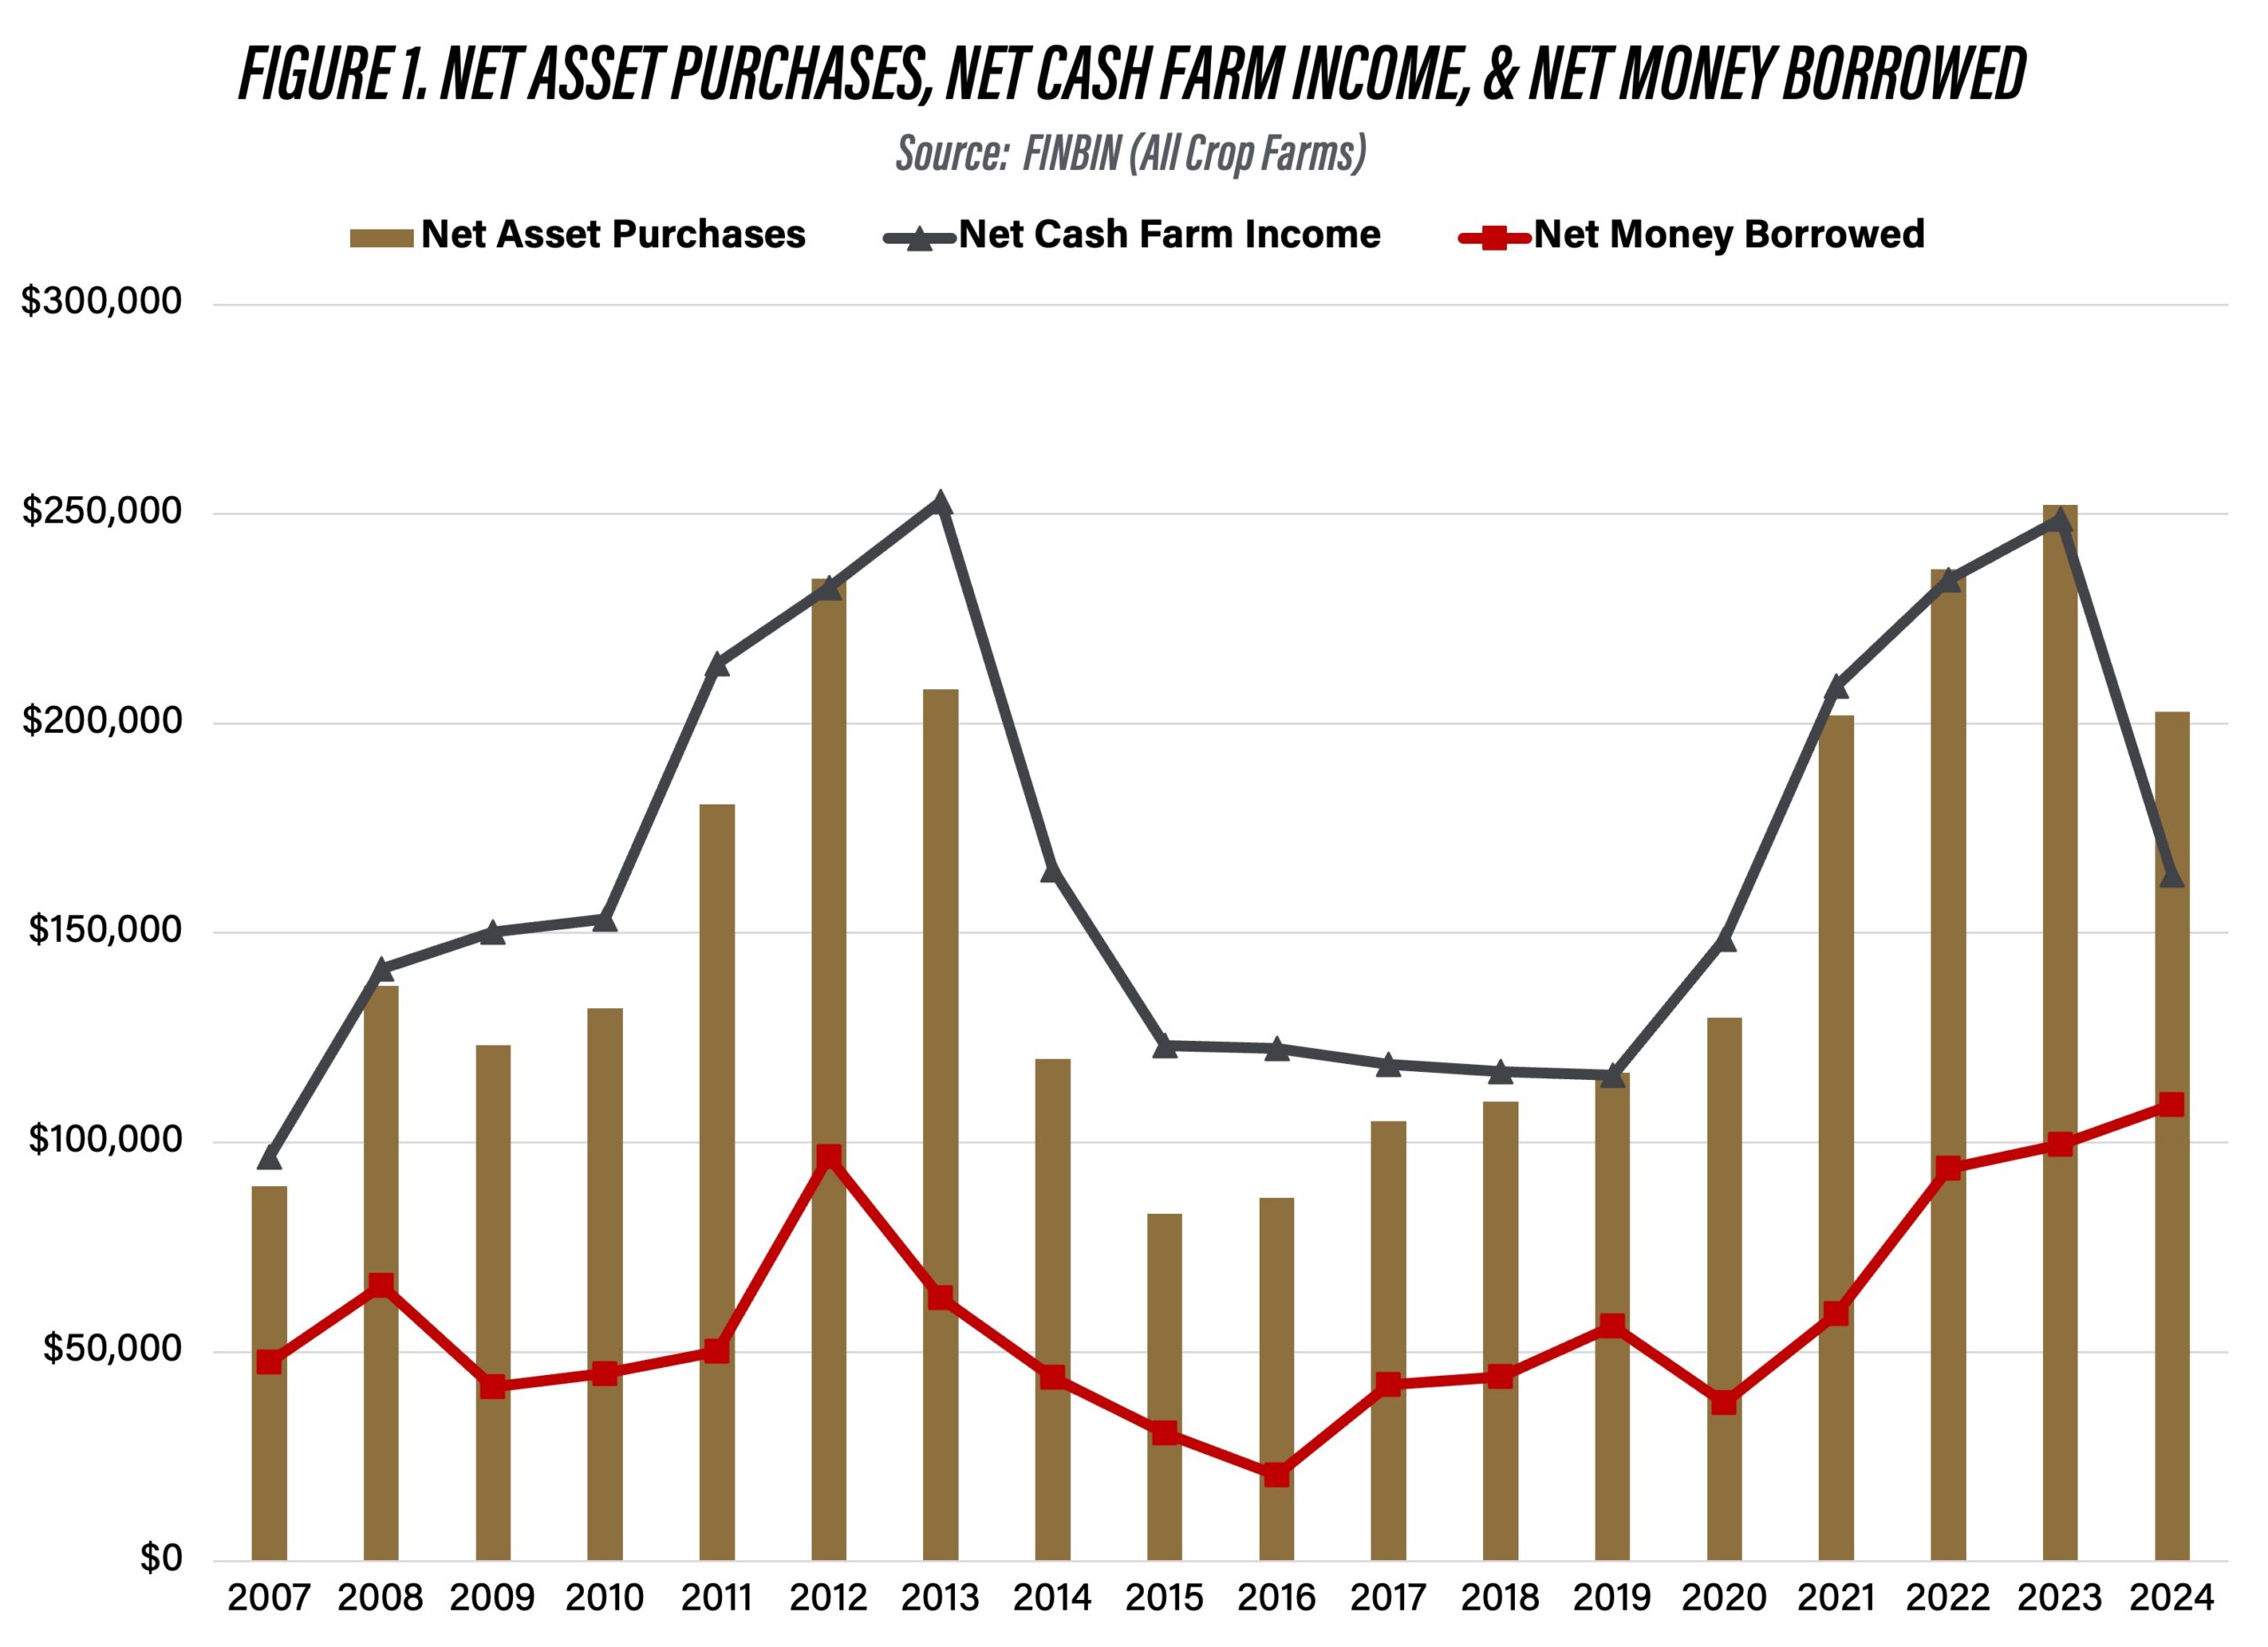
Figure 1. Net Asset Purchases, Net Cash Farm Income, & Net Money Borrowed
Source: FINBIN (All Crop Farms)
Figure 1 illustrates the annual averages for net asset purchases, net cash farm income, and net farm income during the study period. When net cash farm income increases, net asset purchases and net money borrowed also tend to increase. Similarly, when net cash farm income declines, net asset purchases and net money borrowed also seem to decline. These trends are as expected. When farms experience strong net incomes (e.g., 2013 and 2023) they tend to use a major portion of this net income to purchase assets or expand. When income is relatively lower (e.g., 2015 and 2016), farms tend to reduce their asset purchases. The relatively strong link between net asset purchases and money borrowed suggests that the farms were using both net income and borrowed funds to expand.
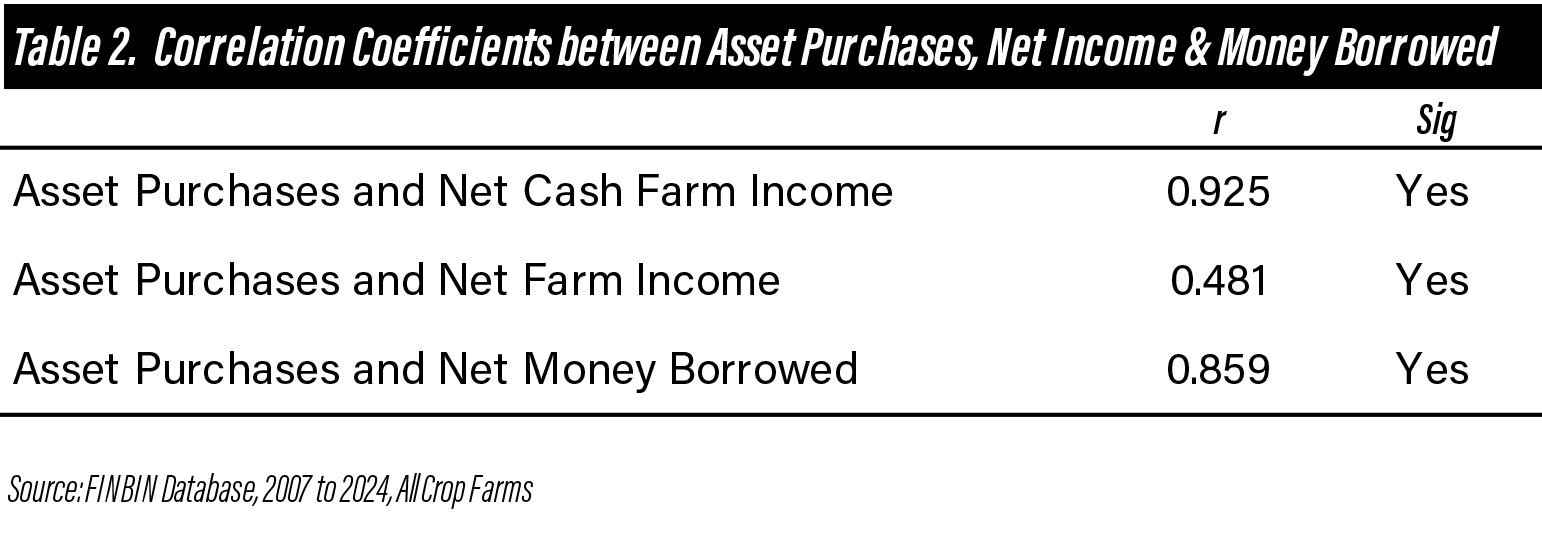
Table 2. Correlation Coefficients between Asset Purchases, Net Income & Money Borrowed
Correlation coefficients between asset purchases, and net income and net money borrowed are reported in table 2. All of the correlation coefficients are significant. However, there are stronger links between asset purchases and net cash farm income, and asset purchases and net money borrowed than there is between asset purchases and net farm income. This supports the old adage that “cash is king”. Strong cash flows enable farms to expand. If cash flow in a particular year is relatively low, farms preserve their cash by not expanding as rapidly.
In summary, during the 2007 to 2024 period, net cash farm income and borrowed funds were used to purchase assets (i.e., farm growth). Average net asset purchases were approximately $153,000 per year. In relatively strong net income years, average net asset purchases exceeded $200,000. In contrast, in relatively weak net incomes years, average net asset purchases dropped below $100,000. Given the relatively weak net income prospects for 2025, we would expect net asset purchases to be below their average since 2007 this year.
Citations
Center for Farm Financial Management, University of Minnesota, FINBIN web site, accessed April 30, 2025.
![]()
![]()
![]()
![]()
![]()
TAGS:
TEAM LINKS:

RELATED RESOURCES
UPCOMING EVENTS
We are taking a short break, but please plan to join us at one of our future programs that is a little farther in the future.