November 14, 2025
U.S.–China Soybean Deal: Comparing Past Export Levels and Global Market Impacts
by Joana Colussi and Michael Langemeier
![]()
![]()
![]()
![]()
![]()
The trade deal between the United States and China, announced in November, ends the suspension of soybean imports. It includes a commitment for China to purchase 12 million metric tons of U.S. soybeans in the last two months of 2025 and at least 25 million metric tons annually through 2028. The agreement follows six months of near-zero U.S. soybean exports to China amid retaliatory trade measures. But how does the current deal compare to previous U.S. export levels to China? And how might this impact the global soybean market in the years to come? This article compares new purchase commitments with historical U.S. export volumes and examines the implications of the trade war for global soybean trade patterns, with a focus on the United States, Brazil, and Argentina – the world’s leading soybean producers and exporters.
Trade Deal Brings Relief but Limited Volume Recovery
Until May of this year, before the trade war escalated, the United States had sold nearly 6 million metric tons of soybeans to China, according to data from the U.S. Department of Agriculture (USDA). If China fulfills the reported 12-million-ton purchase commitment in the last two months of the year, U.S. soybean exports to the Chinese market in 2025 would total around 18 million metric tons – 33% lower than in 2024, when exports to China reached 26.8 million metric tons (see Figure 1).
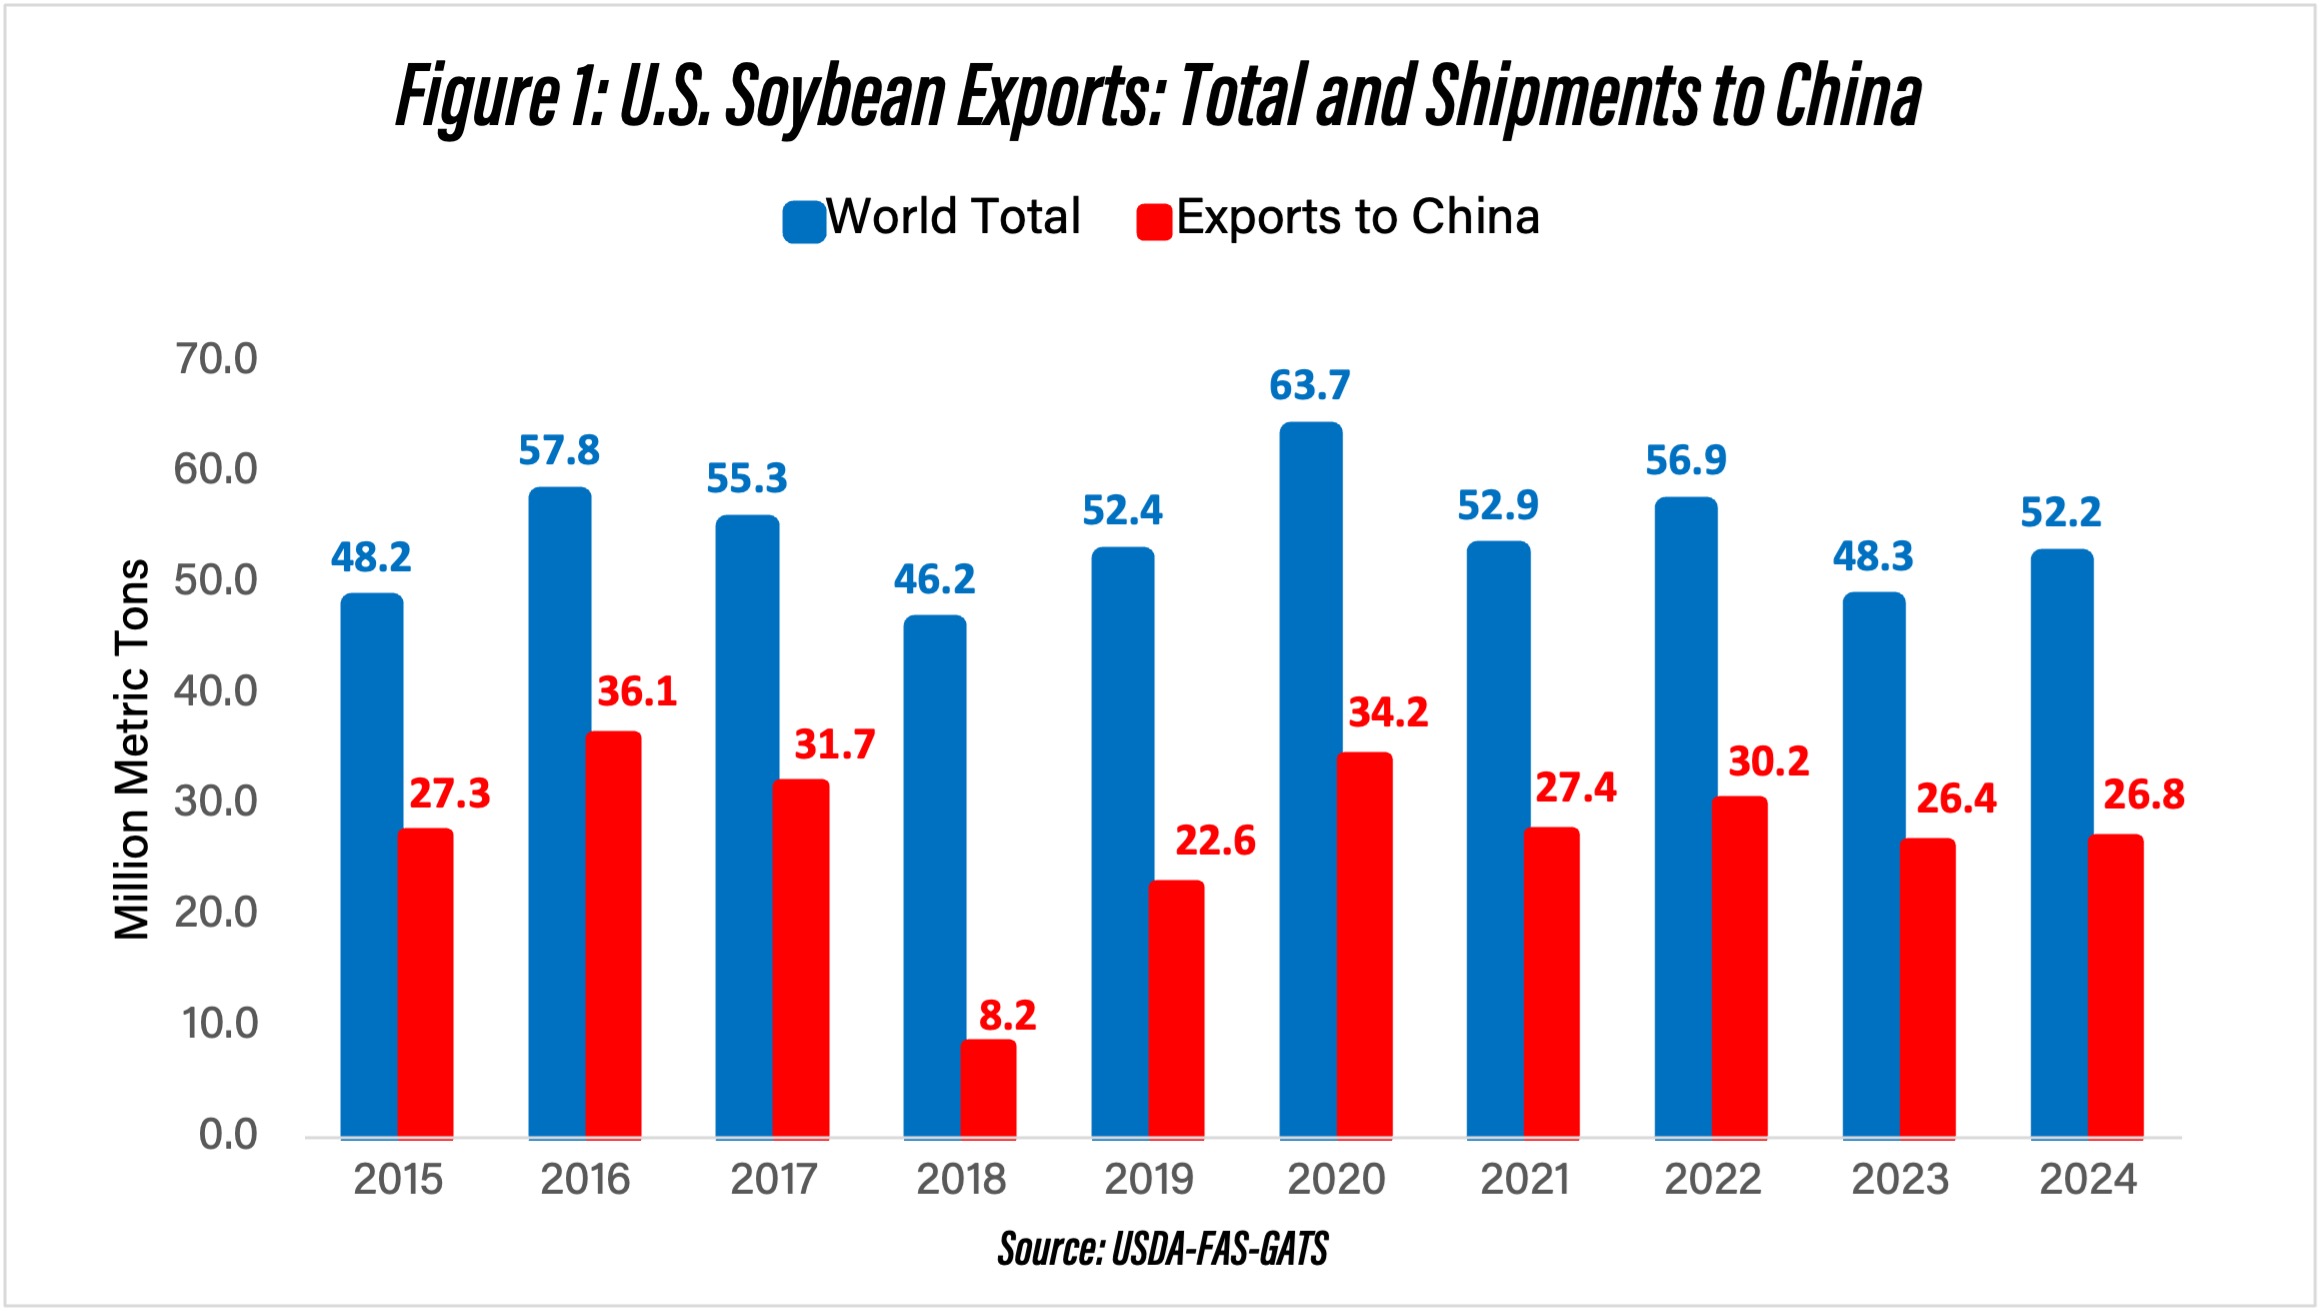
Figure 1: U.S. Soybean Exports: Total and Shipments to China
Although the deal brought relief to U.S. producers at the end of the harvest season, total U.S. soybean exports to China this year are expected to be the lowest since 2018, when the trade war between the two countries began. That year, the United States exported only 8 million metric tons to China. In recent years, after the trade deal in 2020, China has purchased roughly half of all U.S. soybean exports, compared to about 60% before the trade tensions began in 2018 (Colussi & Langemeier, 2025a). If China purchases at least 25 million tons of U.S. soybeans in each of 2026, 2027, and 2028, that volume would still be 14% lower than the five-year average of 29 million tons of soybean shipments to China from 2020 to 2024. The ten-year average was 27 million tons.
The announcement that China would resume purchases from the United States supported soybean futures, which had moved slightly higher in recent days, reaching almost $11 per bushel – the highest level in over a year. Still, after the $11 per bushel futures price is adjusted for basis, the resulting cash price is still below the break-even point for many U.S. soybean producers in 2025.
Brazil’s Strong 2025 Export Performance
The six-month suspension of U.S. soybean imports by China this year led Brazil to increase its exports to China to levels last seen in 2018. Between January and October, Brazil exported a record 79 million metric tons of soybeans to China, accounting for nearly 80% of its total soybean exports during the period – approximately 100 million tons in total, according to Brazil’s Foreign Trade Secretariat (Secex). The volume exported so far has already surpassed the total for 2024, which was just under 99 million metric tons (see Figure 2).
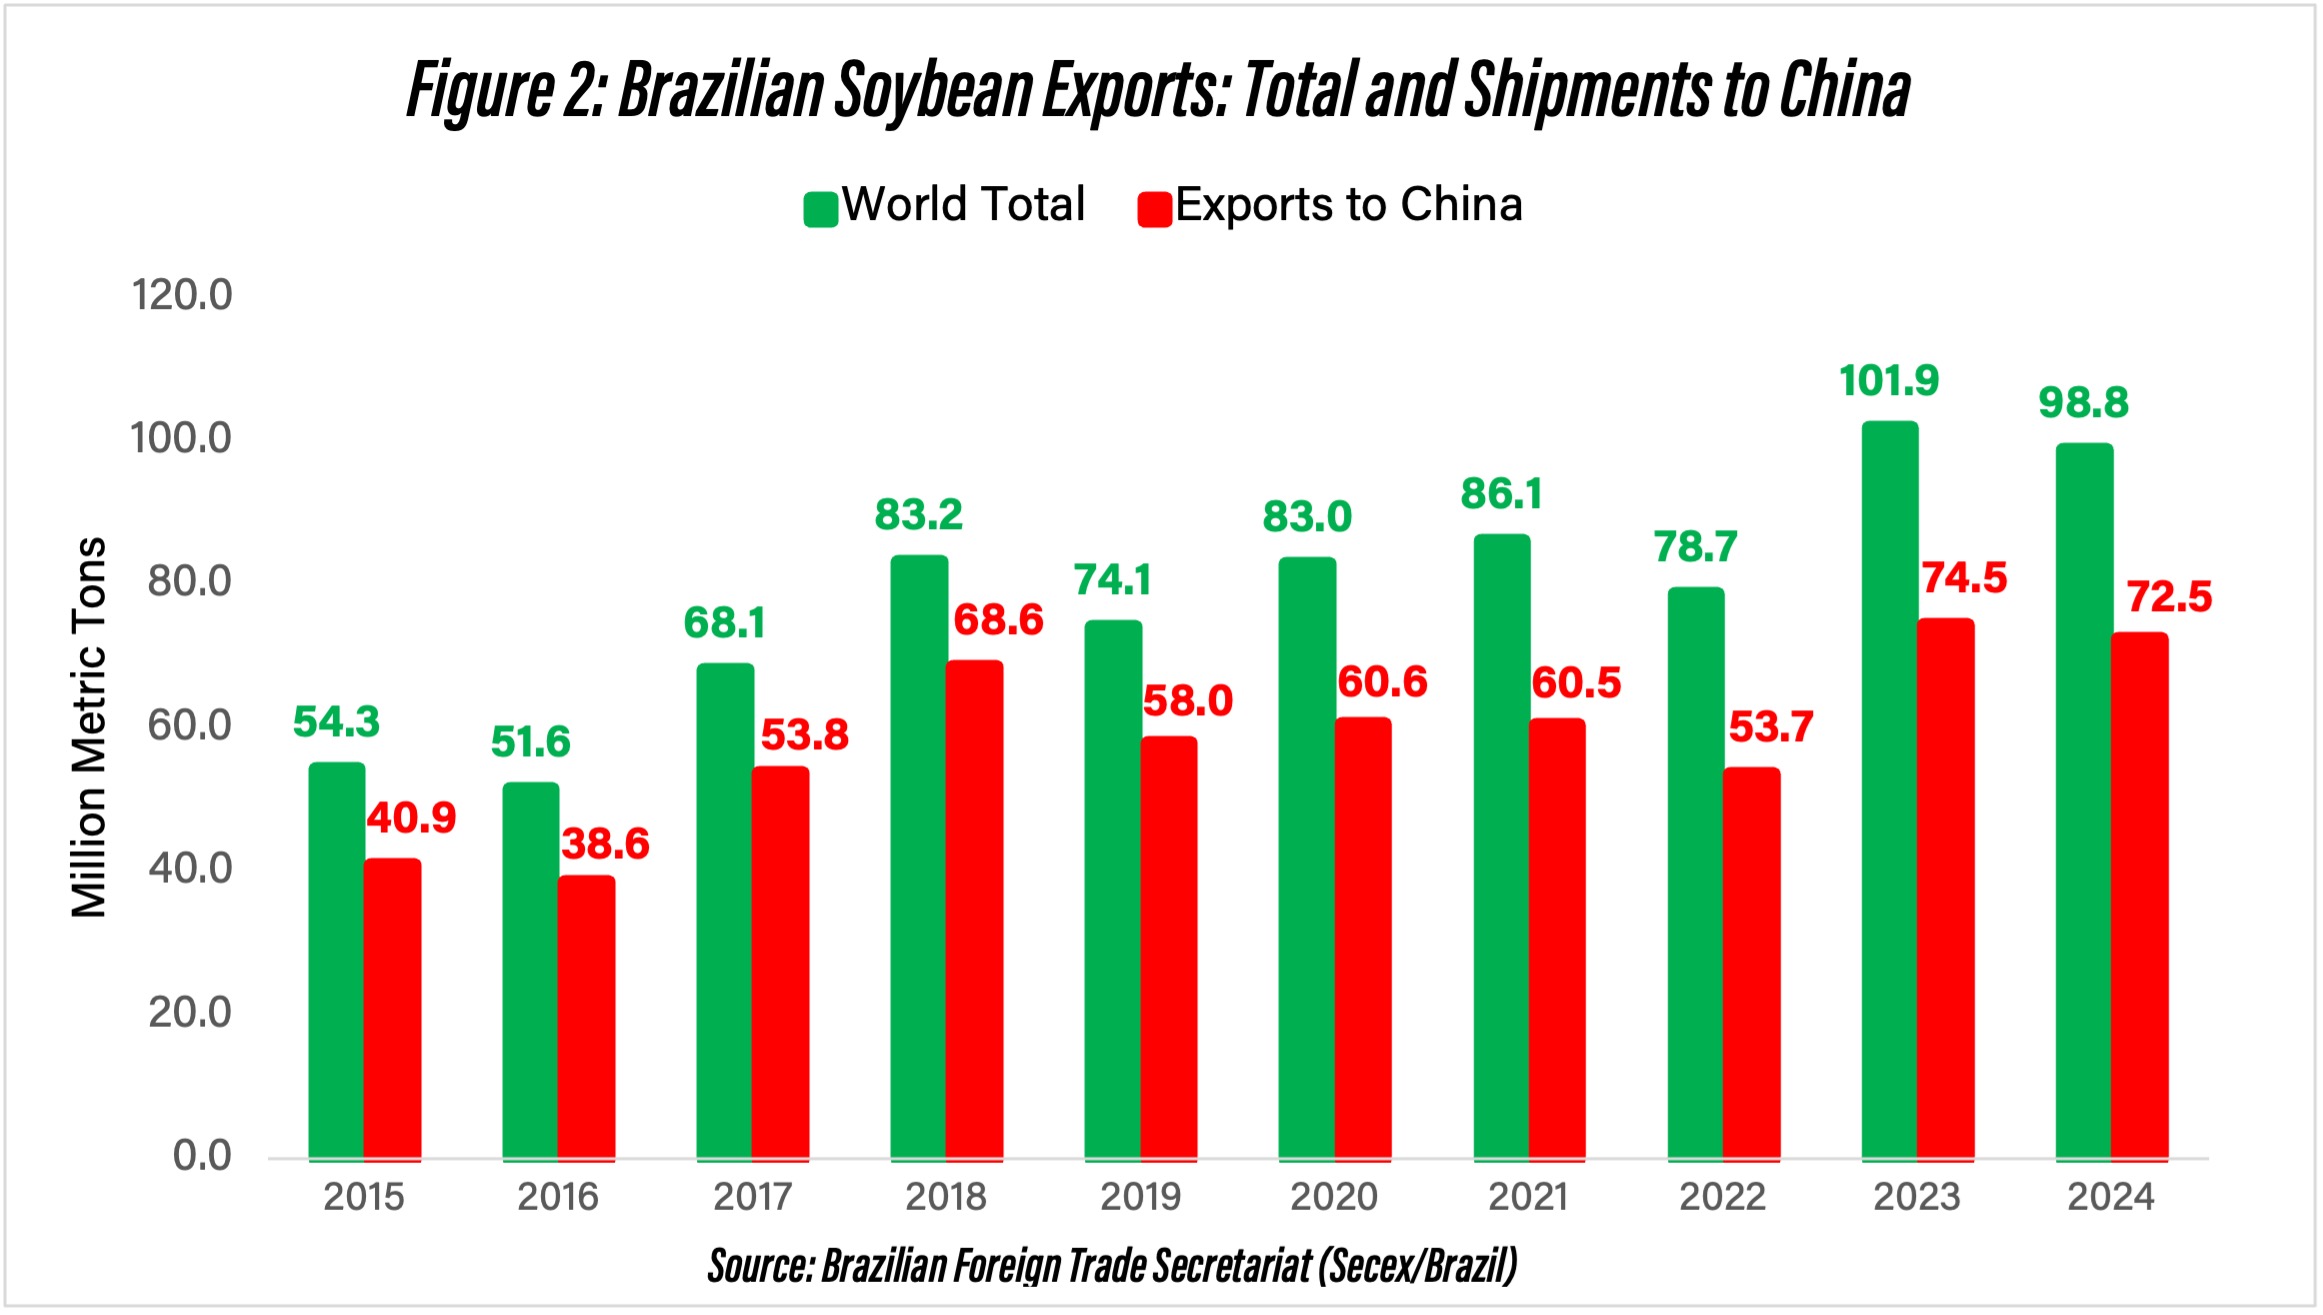
Figure 2: Brazilian Soybean Exports: Total and Shipments to China
Prior to the U.S.–China agreement, the Brazilian Association of Vegetable Oil Industries had projected Brazil’s soybean exports to China at 84 million tons in 2025, up from 72 million tons in 2024. Based on a more conservative scenario, assuming November and December shipments match last year’s pace, the total for 2025 is now expected to reach around 82 million tons, already reflecting the effects of the new agreement. Even so, Brazil is likely to ship about 10 million tons more soybeans than in 2024, despite the return of U.S. soybeans to the Chinese market.
Looking ahead to 2026, if U.S.–China trade flows normalize, Brazil’s soybean exports are projected to decline to between 72 and 75 million metric tons, a drop of 7 to 10 million tons from 2025 levels. Rising competition from Argentina, which has recently increased its soybean exports (see next section), is another factor that could add additional pressure on Brazil’s shipments next year. Even so, farmers across Brazil have begun planting the 2025/26 crop in October with record acreage expected to reach 121 million acres, up 3.5% from last year, according to projections from the National Supply Company (Colussi & Langemeier, 2025b).
Argentina Benefits from China’s Buying Shift
Argentina, the world’s third-largest soybean producer – behind Brazil and the United States – has also benefited this year from China’s temporary suspension of U.S. soybean imports. Between January and September, Argentina exported 7.6 million metric tons of soybeans, with 90% of that volume destined for China, according to the National Institute of Statistics and Censuses (INDEC). The volume shipped in just the first nine months of the year is about 65% higher than the total exported in 2024, which was 4.6 million metric tons (see Figure 3).
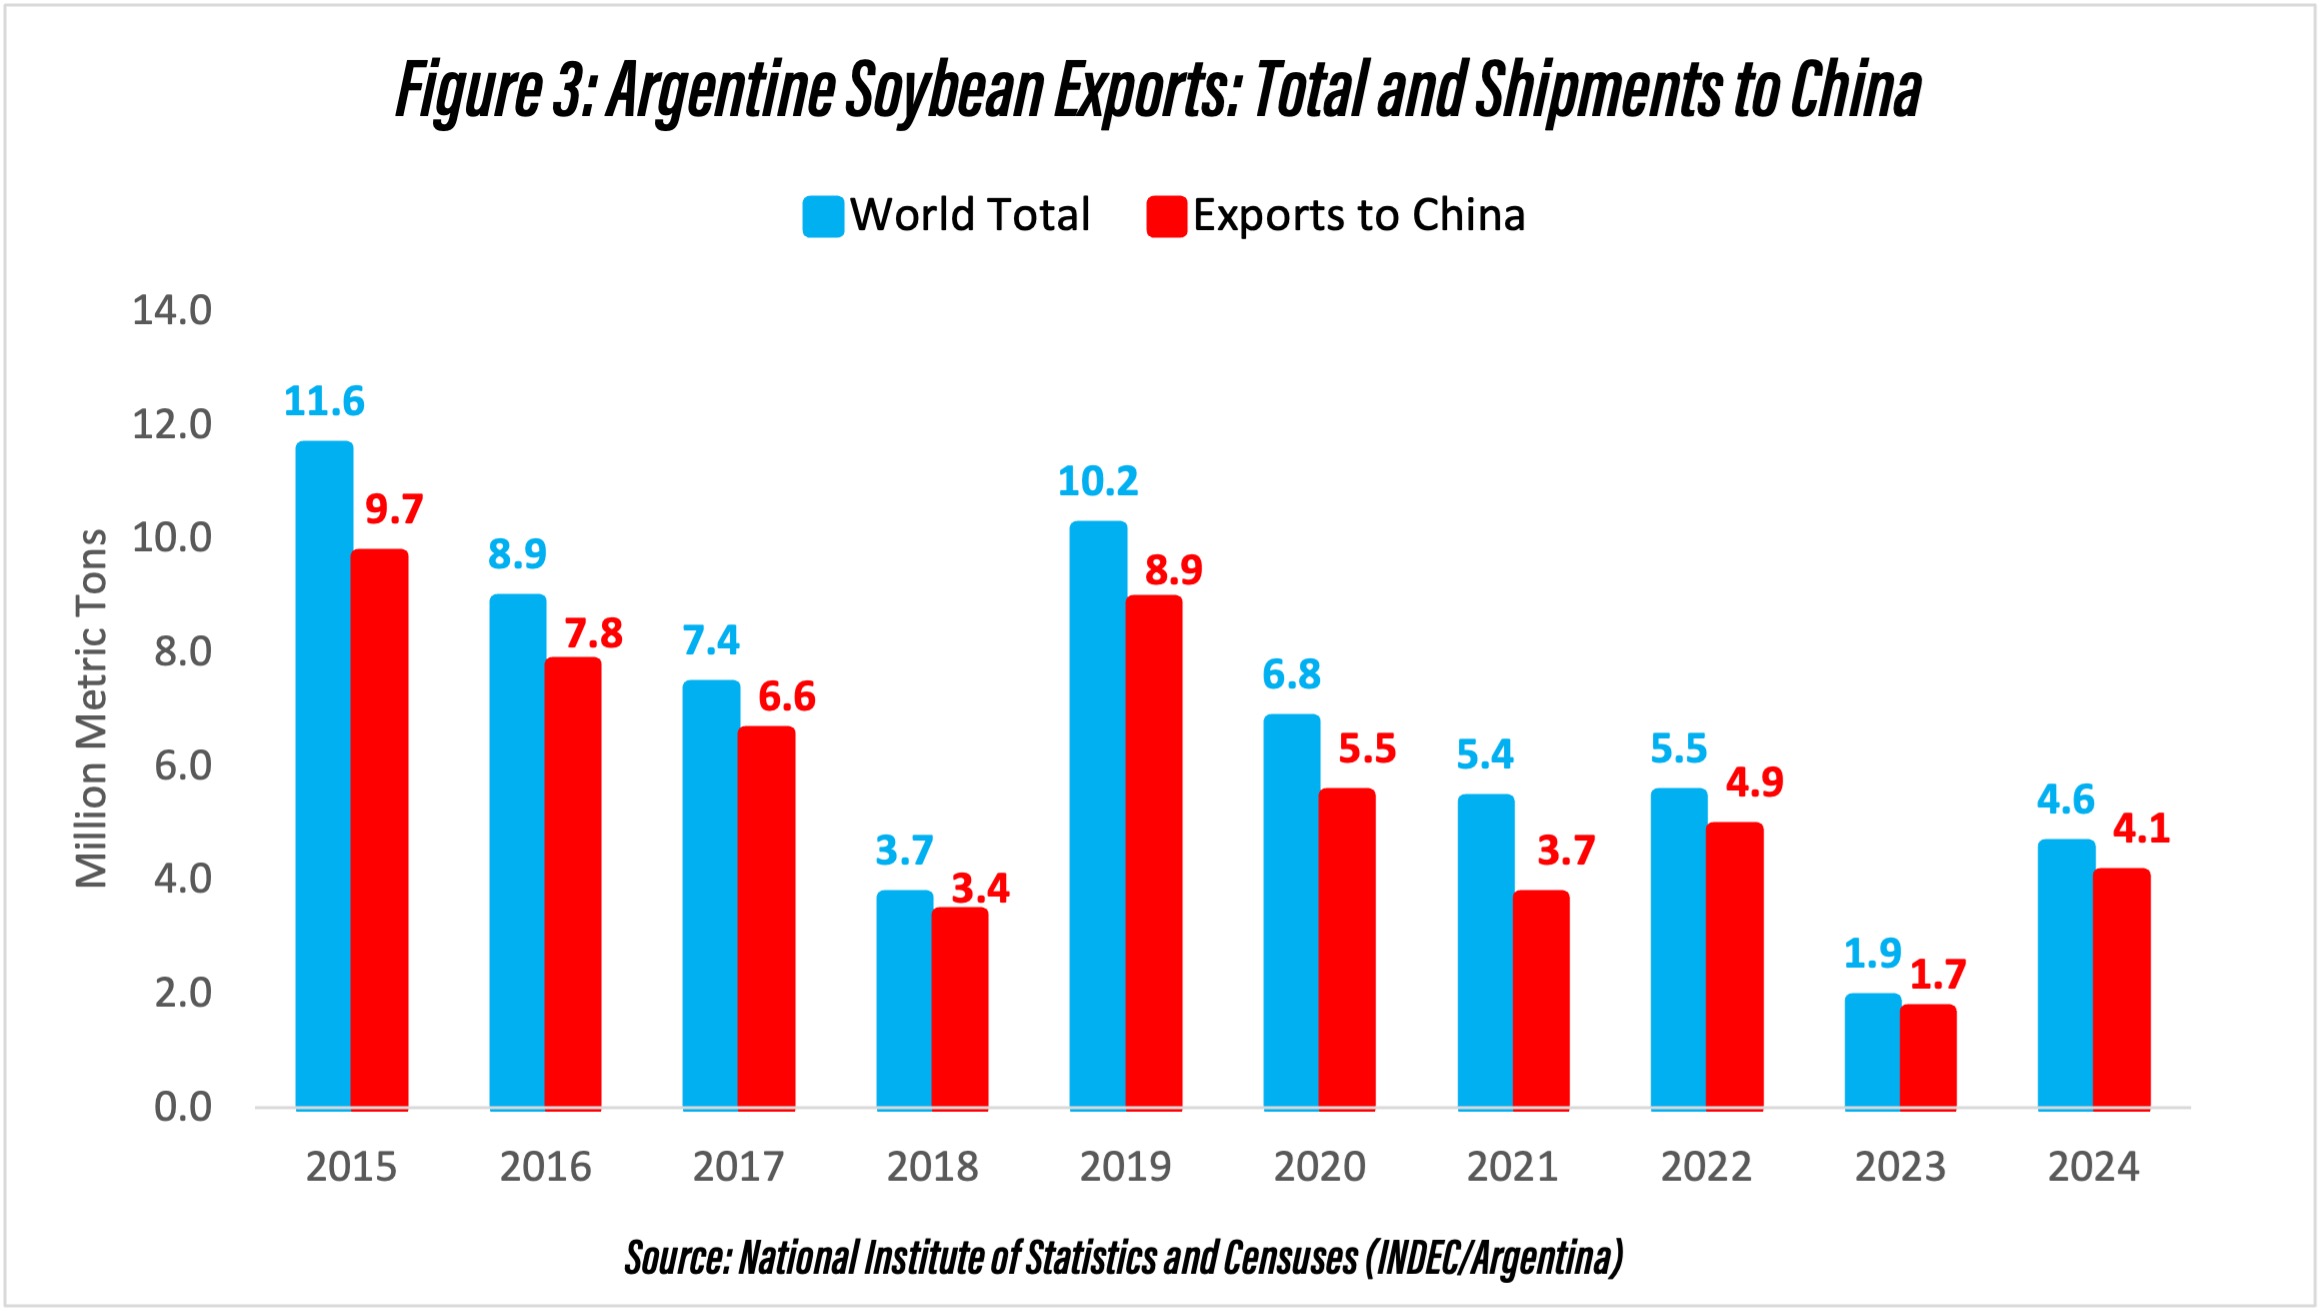
Figure 3: Argentine Soybean Exports: Total and Shipments to China
At the end of September, Argentina briefly suspended its 26% soybean export tax, allowing China to purchase large quantities of soybeans from Argentina at lower prices. The suspension was an effort to boost Argentina’s dollar reserves. The $7 billion sales cap was reached in just three days, which automatically reinstated the export taxes on grains, including soybeans. The last time Argentina exported a similar volume of soybeans to China was in 2019 – the year following the start of the U.S.–China trade war.
Argentine farmers began planting soybeans for the 2025/26 season in November, with most fields benefiting from optimal soil moisture conditions, according to the latest report from the Buenos Aires Grain Exchange. The soybean area in Argentina for the 2025/26 crop season is expected to total 7.4 million acres, a 4.3% decrease from the previous season, yet still the second largest of the past five years. The decline in soybean planting reflects a shift in production toward corn and sunflowers, driven by lower corn borer pressure and strong yield performance for these crops.
Final Considerations
The agreement between the United States and China, which includes a commitment to purchase 12 million metric tons of U.S. soybeans in 2025 and 25 million tons annually over the following three years, has temporarily calmed U.S. markets, supporting soybean prices at the close of the harvest season. However, the volumes currently projected for shipment to China remain below the average observed over the past decade, as shown in our analysis.
Even with the suspension of some retaliatory tariffs on U.S. imports, shipments of U.S. soybeans still face a 13% tariff, maintaining the competitiveness of South American soybeans in the global market. In recent months, Brazil and Argentina have reached record export volumes to China. Despite the recent reduction in Chinese tariffs on U.S agricultural products, South America is expected to maintain a strong position in the global soybean trade. Brazil’s expanded planted area projected for the 2025/26 crop season and the prospect of a trend-yield crop in Argentina further reinforce this competitive outlook.
Given the ongoing uncertainty surrounding Chinese demand in the coming years, U.S. soybean exporters are trying to diversify their sales across markets in East Asia, the Middle East, North Africa, and South Asia. Some progress has already been made in countries such as Thailand, Bangladesh, and Morocco. Still, it remains unclear whether these emerging markets can offset weaker demand from China and stabilize U.S. soybean acreage in 2026, preventing corn acreage from exceeding 95 million acres again which would add further pressure to corn prices that are already below break-even prices for many producers in the U.S. Midwest. A scenario in which corn acreage is as large as what it was in 2025 would also add to the financial stress corn and soybean producers are currently experiencing (Langemeier, Boehlje, and Collusi, 2024).
References
Colussi, J., M. Langemeier. “U.S. Soybean Harvest Starts with No Sign of Chinese Buying as Brazil Sets Export Record.” Center for Commercial Agriculture, Purdue University, September 22, 2025a.
Colussi, J., M. Langemeier. “Brazil Begins Planting with Expected Record Acreage Driven by High Demand but Low Margins.” Center for Commercial Agriculture, Purdue University, October 20, 2025b.
Langemeier, M., M. Boehlje, and J. Colussi. “Financial Stress on Crop Farms: Who Is Most at Risk in the 2024–26 Downturn?” Center for Commercial Agriculture, Purdue University, September 3, 2024.
Purdue University Center for Commercial Agriculture, 2026 Crop Cost & Return Guide (September 16, 2025).
![]()
![]()
![]()
![]()
![]()
TAGS:
TEAM LINKS:


RELATED RESOURCES
UPCOMING EVENTS
We are taking a short break, but please plan to join us at one of our future programs that is a little farther in the future.