February 4, 2026
Rising Farm Debt and Financial Stress: Evidence from the Ag Economy Barometer
by Michael Langemeier and Joana Colussi
![]()
![]()
![]()
![]()
![]()
After increasing by 9.1% in 2024, current U.S. farm debt is expected to increase 3.8% in 2025 (USDA-ERS, 2026). Current debt includes operating loans and principal payments related to machinery, buildings, and farmland that are due within one year. This article examines trends in the size of a farm’s operating loans, reasons why operating loans may be larger, financial stress, and balance sheet strength using data from the Purdue University-CME Group Ag Economy Barometer (AEB) surveys over the last seven years.
The AEB survey is conducted each month to gauge producer sentiment among a group of approximately 400 U.S. agricultural producers (Langemeier and Colussi, 2026). In addition to questions pertaining to sentiment, monthly AEB surveys periodically include questions pertaining to operating loans and balance sheet strength.
Projected Changes to Operating Loans
In January of the last seven years, the AEB surveys have included operating loan questions. The first operating loan question was as follows: Compared to last year, do you expect the size of your farm’s operating loan to be larger, smaller, or about the same? Over the last seven years, the percentage of respondents who indicated that they expected to have larger operating loans ranged from 15% in 2020 and 2024 to 27% in 2022. The survey respondents that answered “larger” increased from 18% in 2025 to 21% in 2026 (see Figure 1).
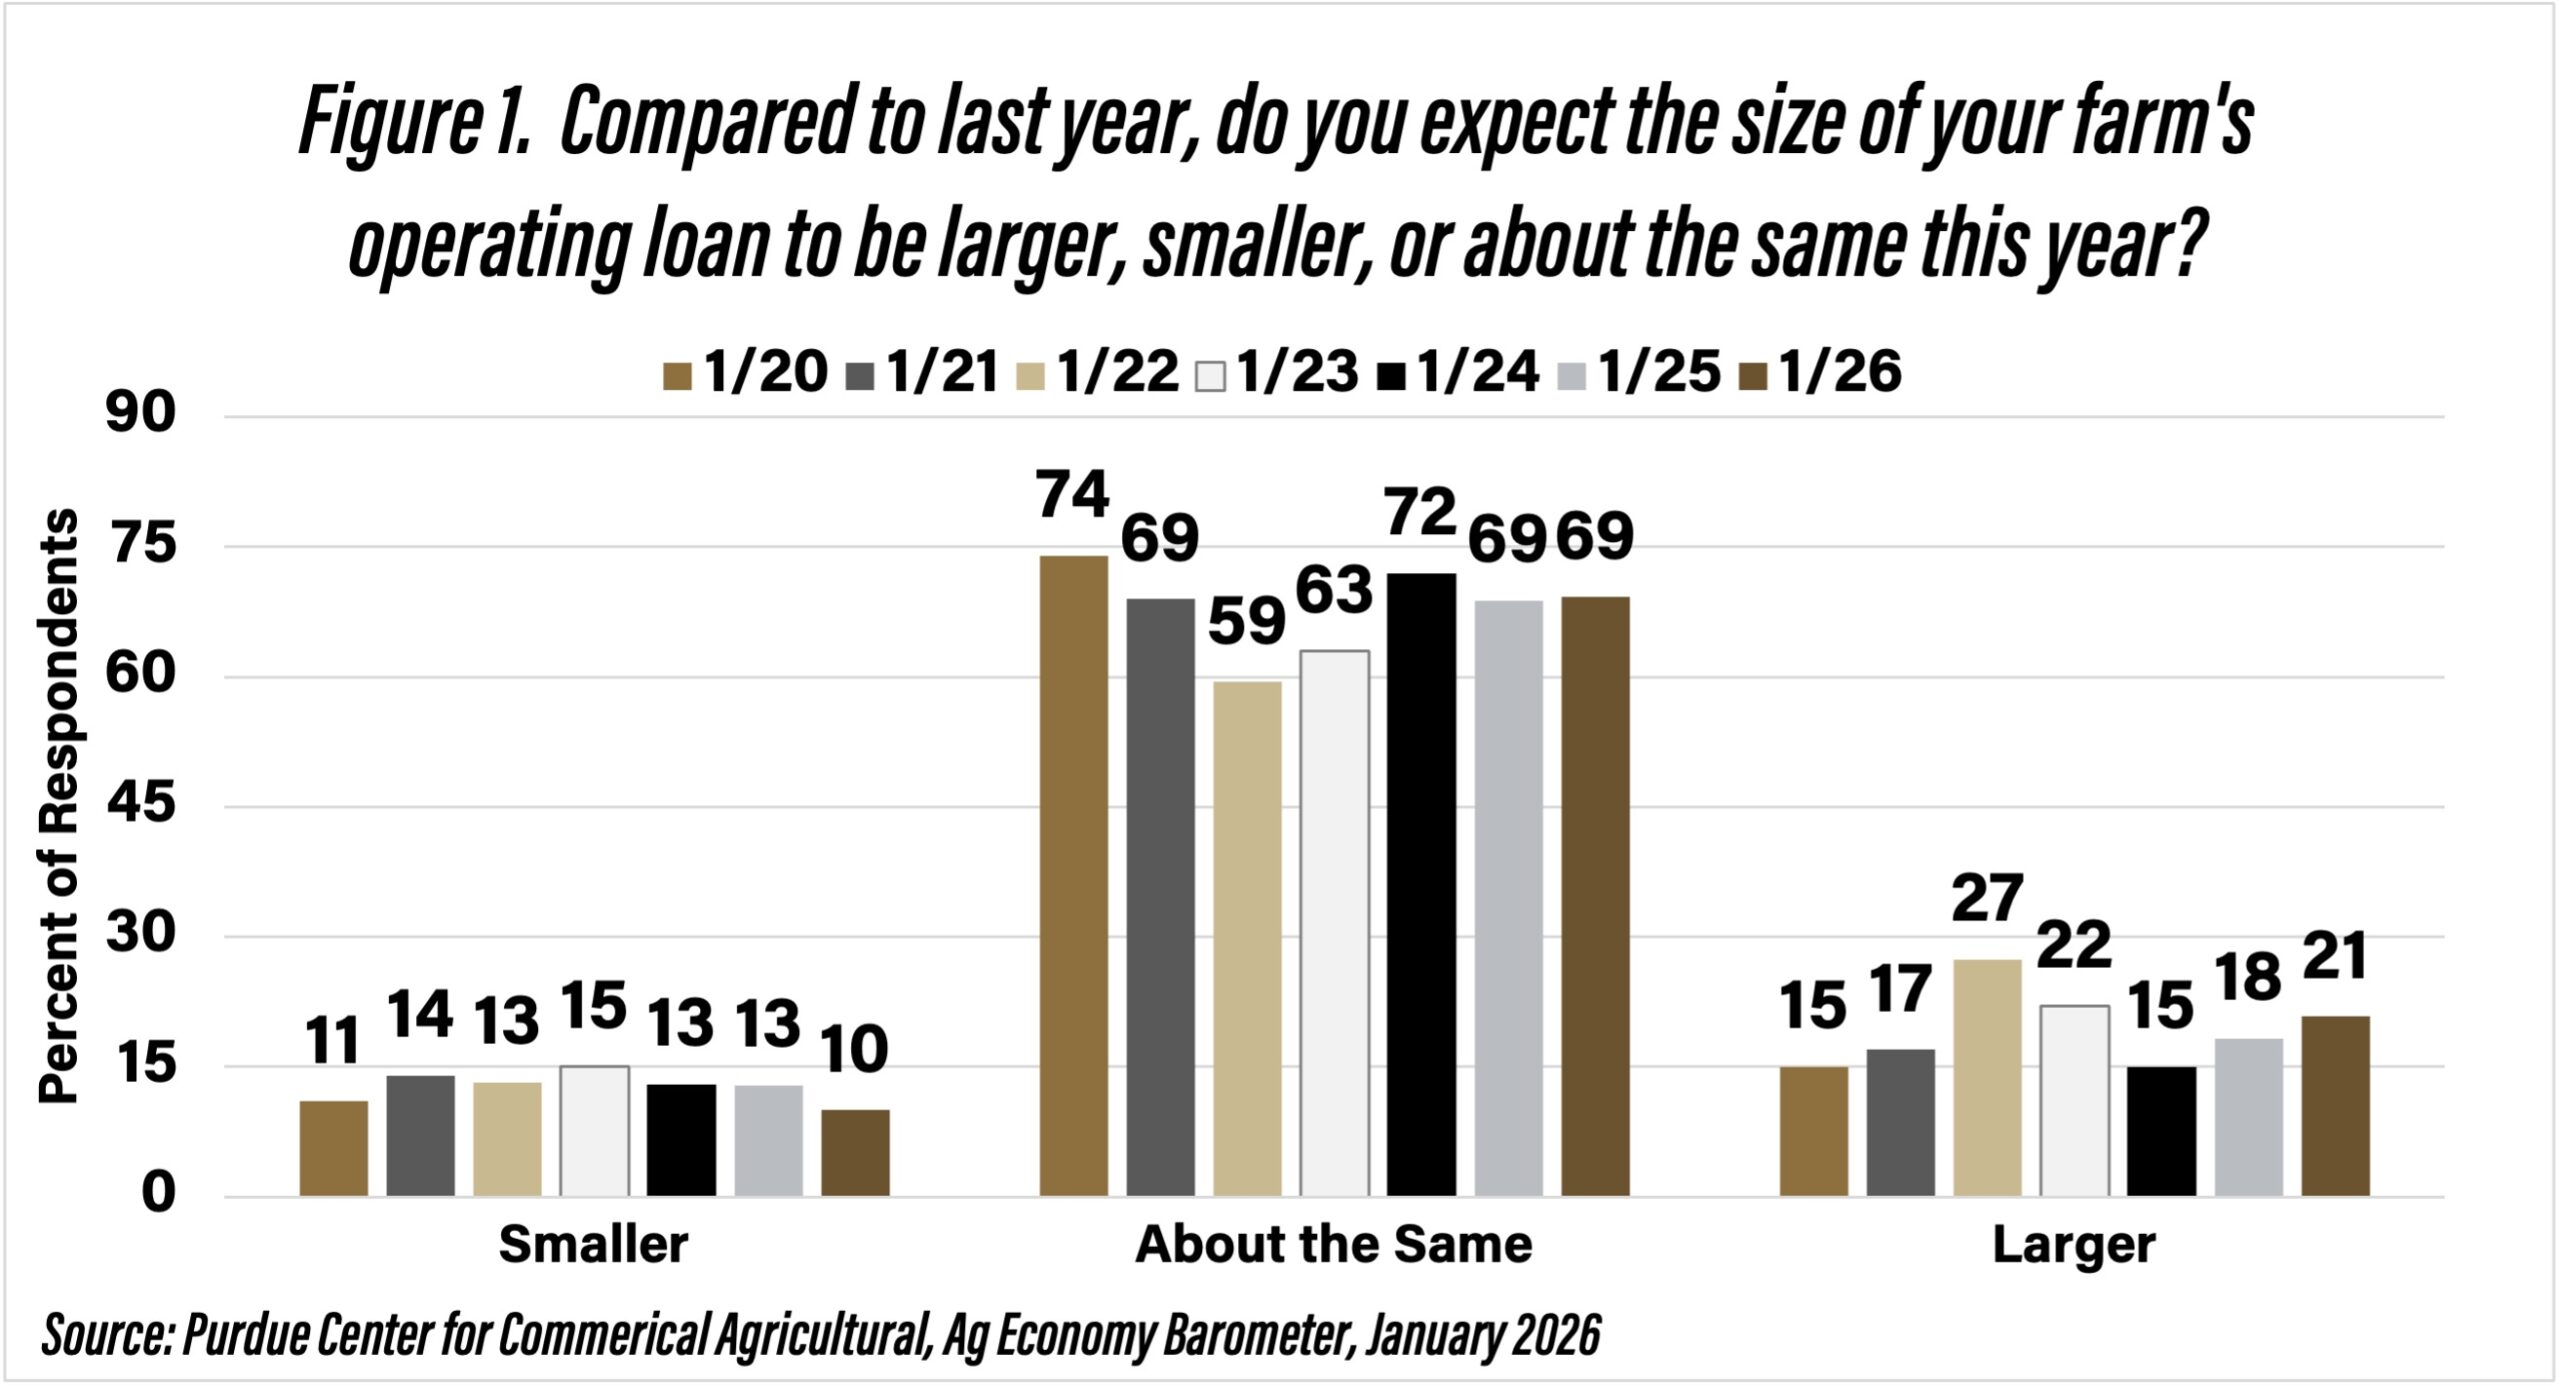
Figure 1. Compared to last year, do you expect the size of your farm’s operating loan to be larger, smaller, or about the same this year?
A follow-up question asked about the reason for their farm’s larger operating loan. Response choices included: increase in input costs, increase in operating size, and unpaid operating debt from prior years. Figure 2 summarizes the results from 2020 to 2026. An increase in input costs was the most common response in each of the years. However, there was a large range in the percentage of respondents who chose this response over time. From 2021 to 2024, over 60% of the respondents chose “increase in input costs” as the reason for higher operating loans. In 2020, 2025, and 2026, from 45 to 56% of the respondents chose this response. On average, approximately 18% of the respondents indicated that an “increase in operation size” was the reason for their larger operating loan. Respondents choosing the “unpaid operating debt from prior years” response averaged 21% and ranged from a low of 5% in 2023 to a high of 35% in 2020. In 2026, 31% of the respondents indicated that this was the reason for their higher operating loan, up sharply from the previous year.
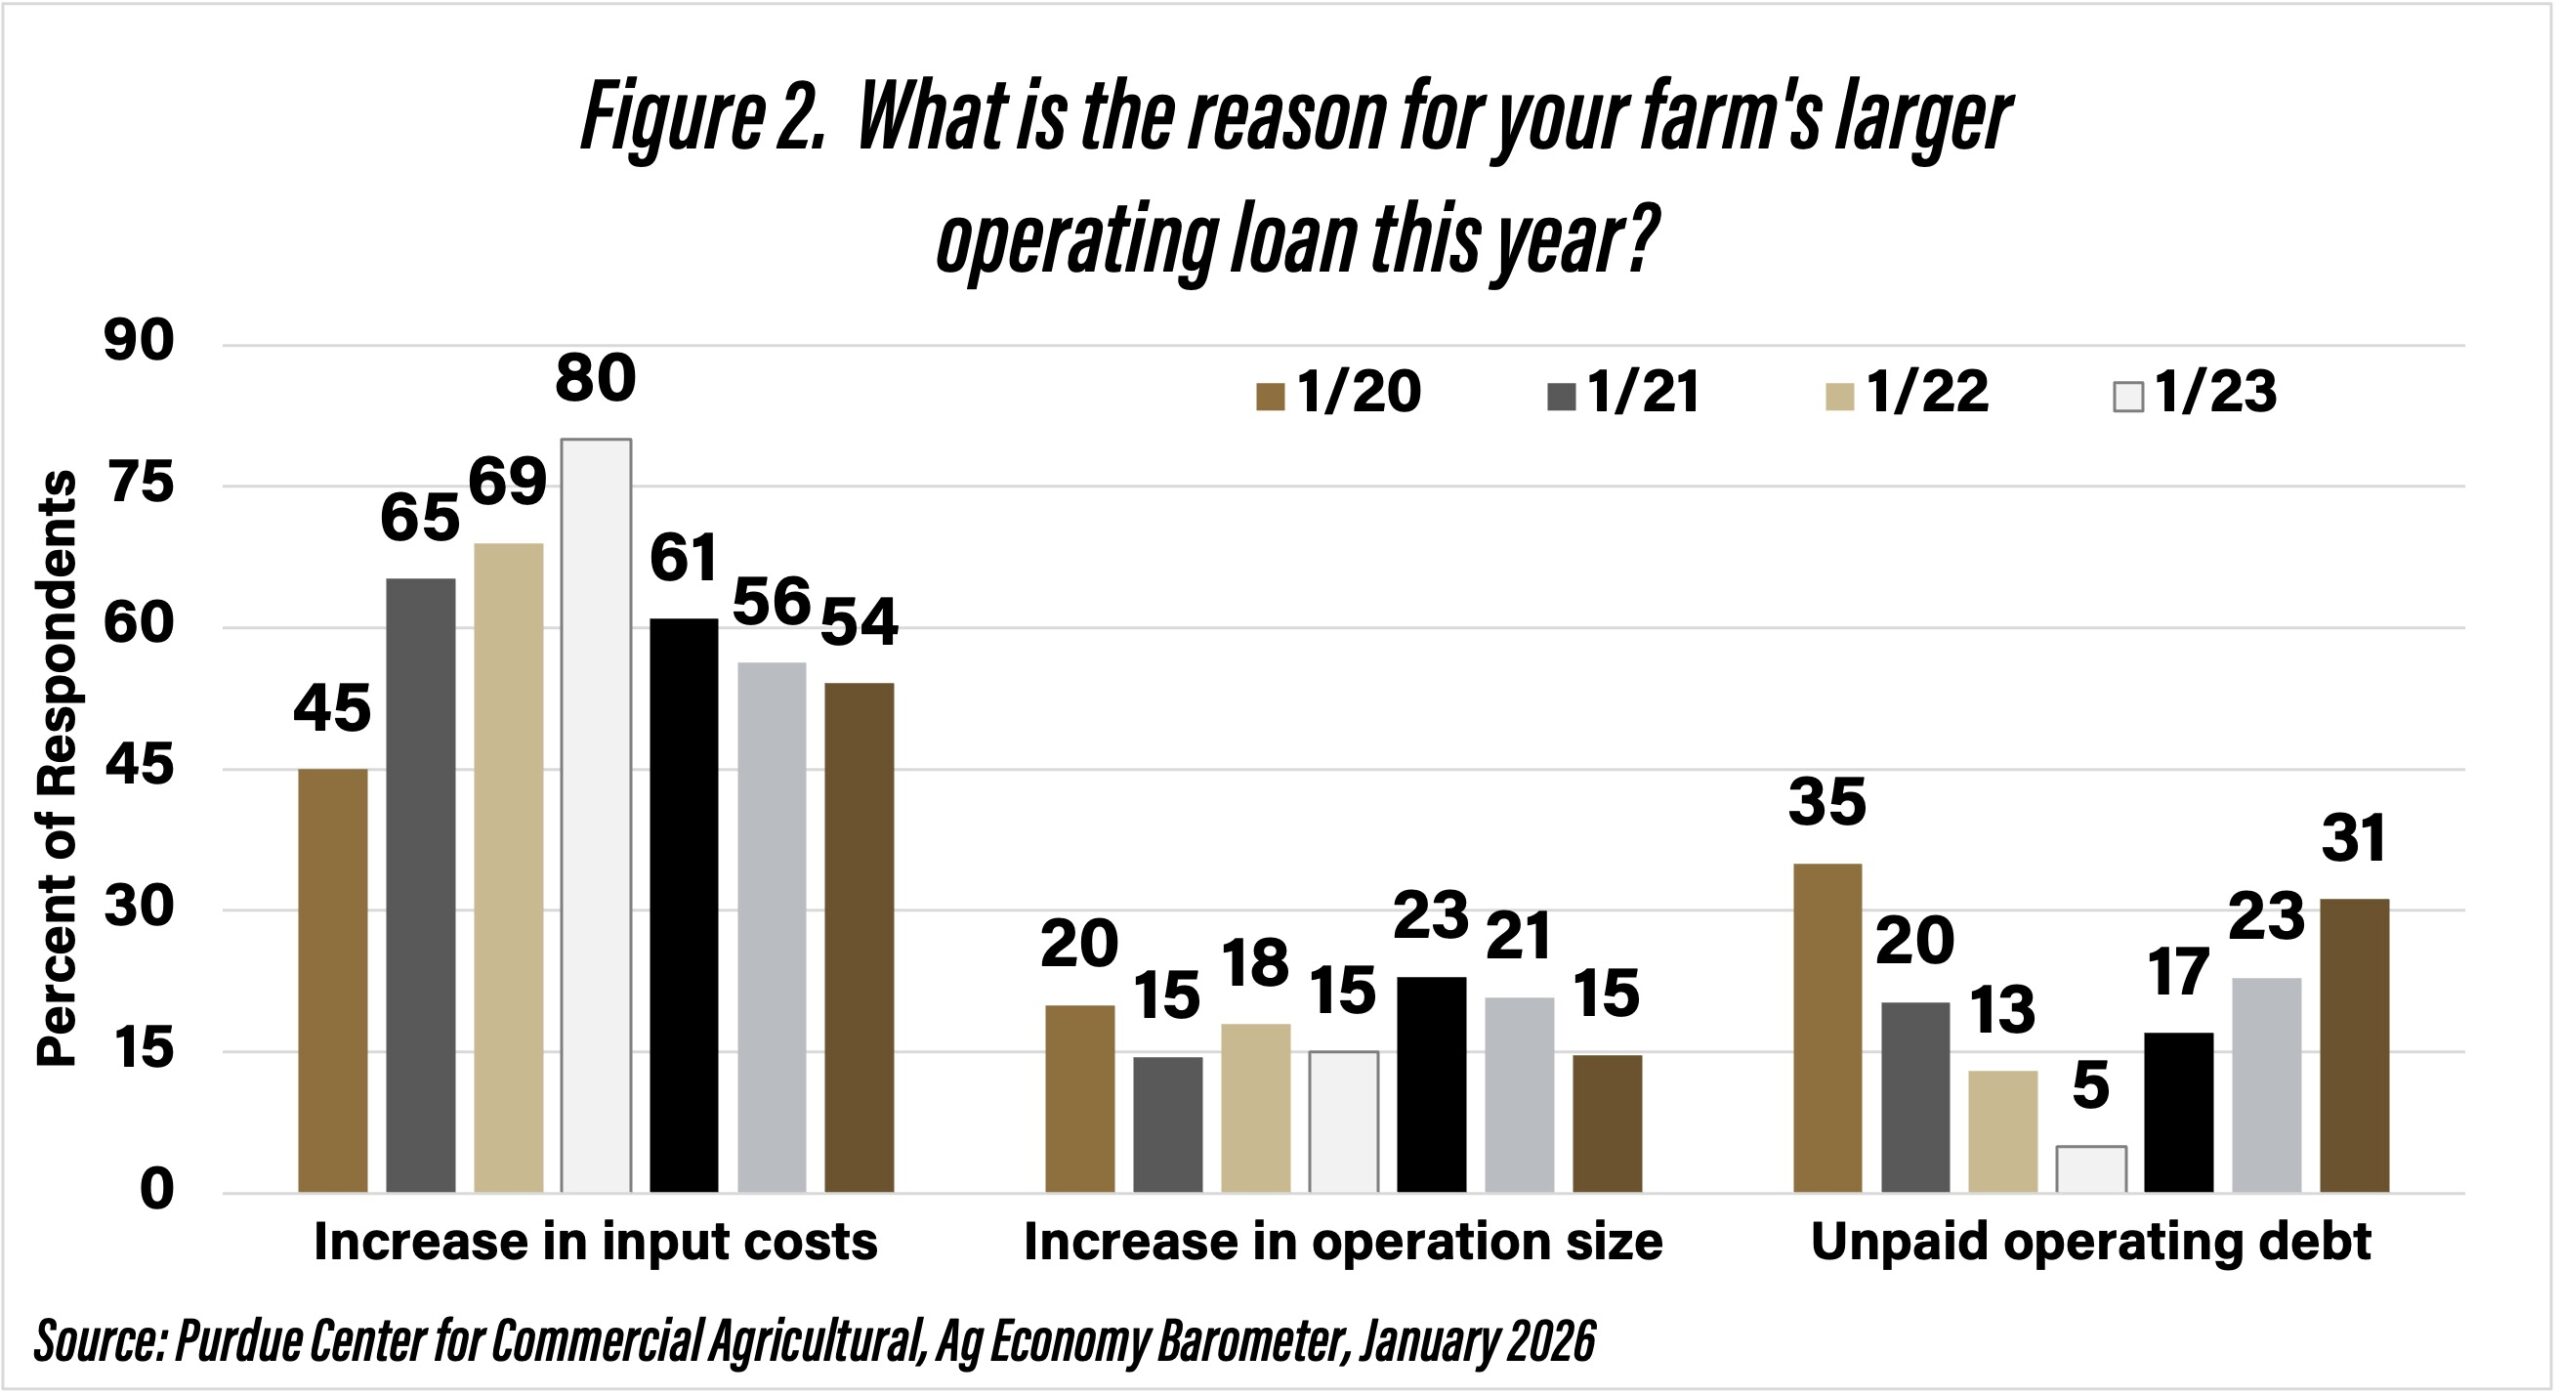
Figure 2. What is the reason for your farm’s larger operating loan this year?
We can derive an implicit index of financial stress by multiplying the percentage of respondents with larger operating loans by the percentage of respondents that chose “unpaid operating debt from prior years” as their primary reason for having a larger operating loan. The resulting index is illustrated in Figure 3. This index ranged from a low of 1.1 in 2023 to 6.5 in 2026. Thus, the index in 2026 was higher than it was in 2020, which followed the 2014 to 2019 period of relatively low net returns.
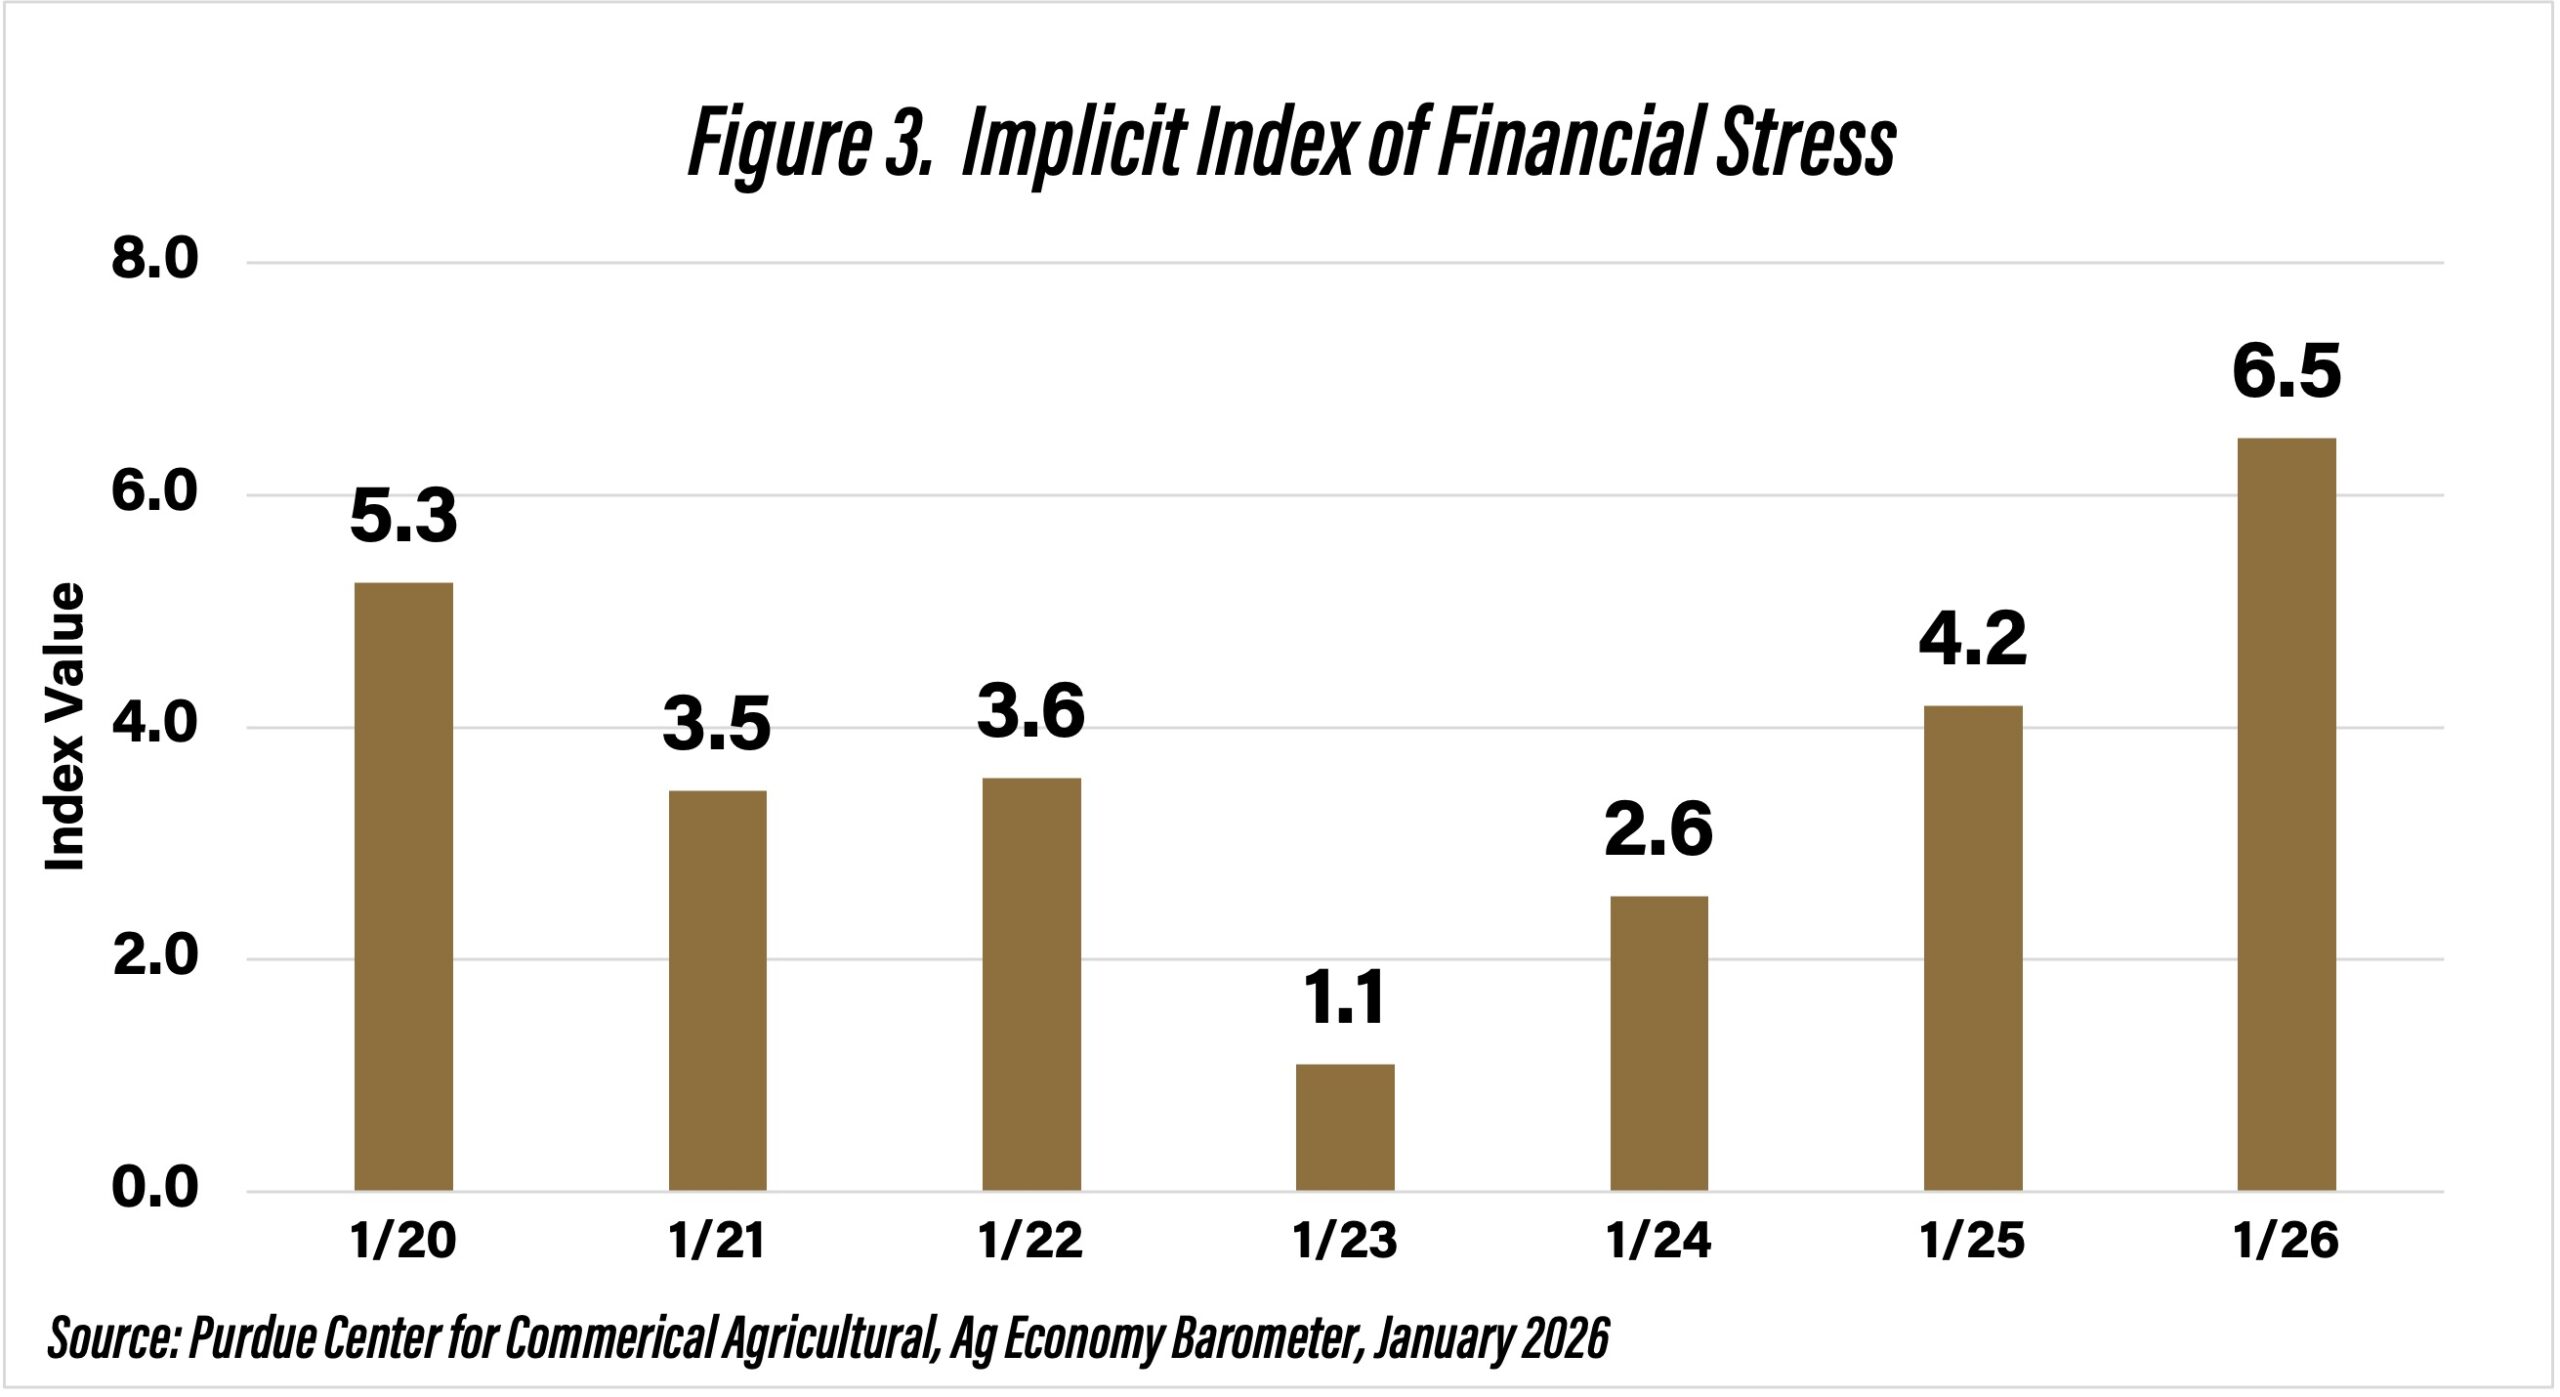
Figure 3. Implicit Index of Financial Stress
Balance Sheet Strength
Agility and absorption capacity are often thought of as two distinct strategies that farms can use to build resilience (Lippsmeyer and Langemeier, 2023). Agility is used to spot and exploit changes in the market in a timely manner. Absorption capacity is the ability to withstand shocks to markets and can be measured using assessments of per-unit costs, diversification, and balance sheet strength. In January 2026 and periodically before that, the AEB survey included a balance sheet strength question worded as follows: How strongly do you agree with the following statement? We have a strong balance sheet. In April 2023, 90% of the respondents agreed or strongly agreed with this statement (see Figure 4). This percentage dropped to 67% in August 2025 and then increased to 76% in January 2026.
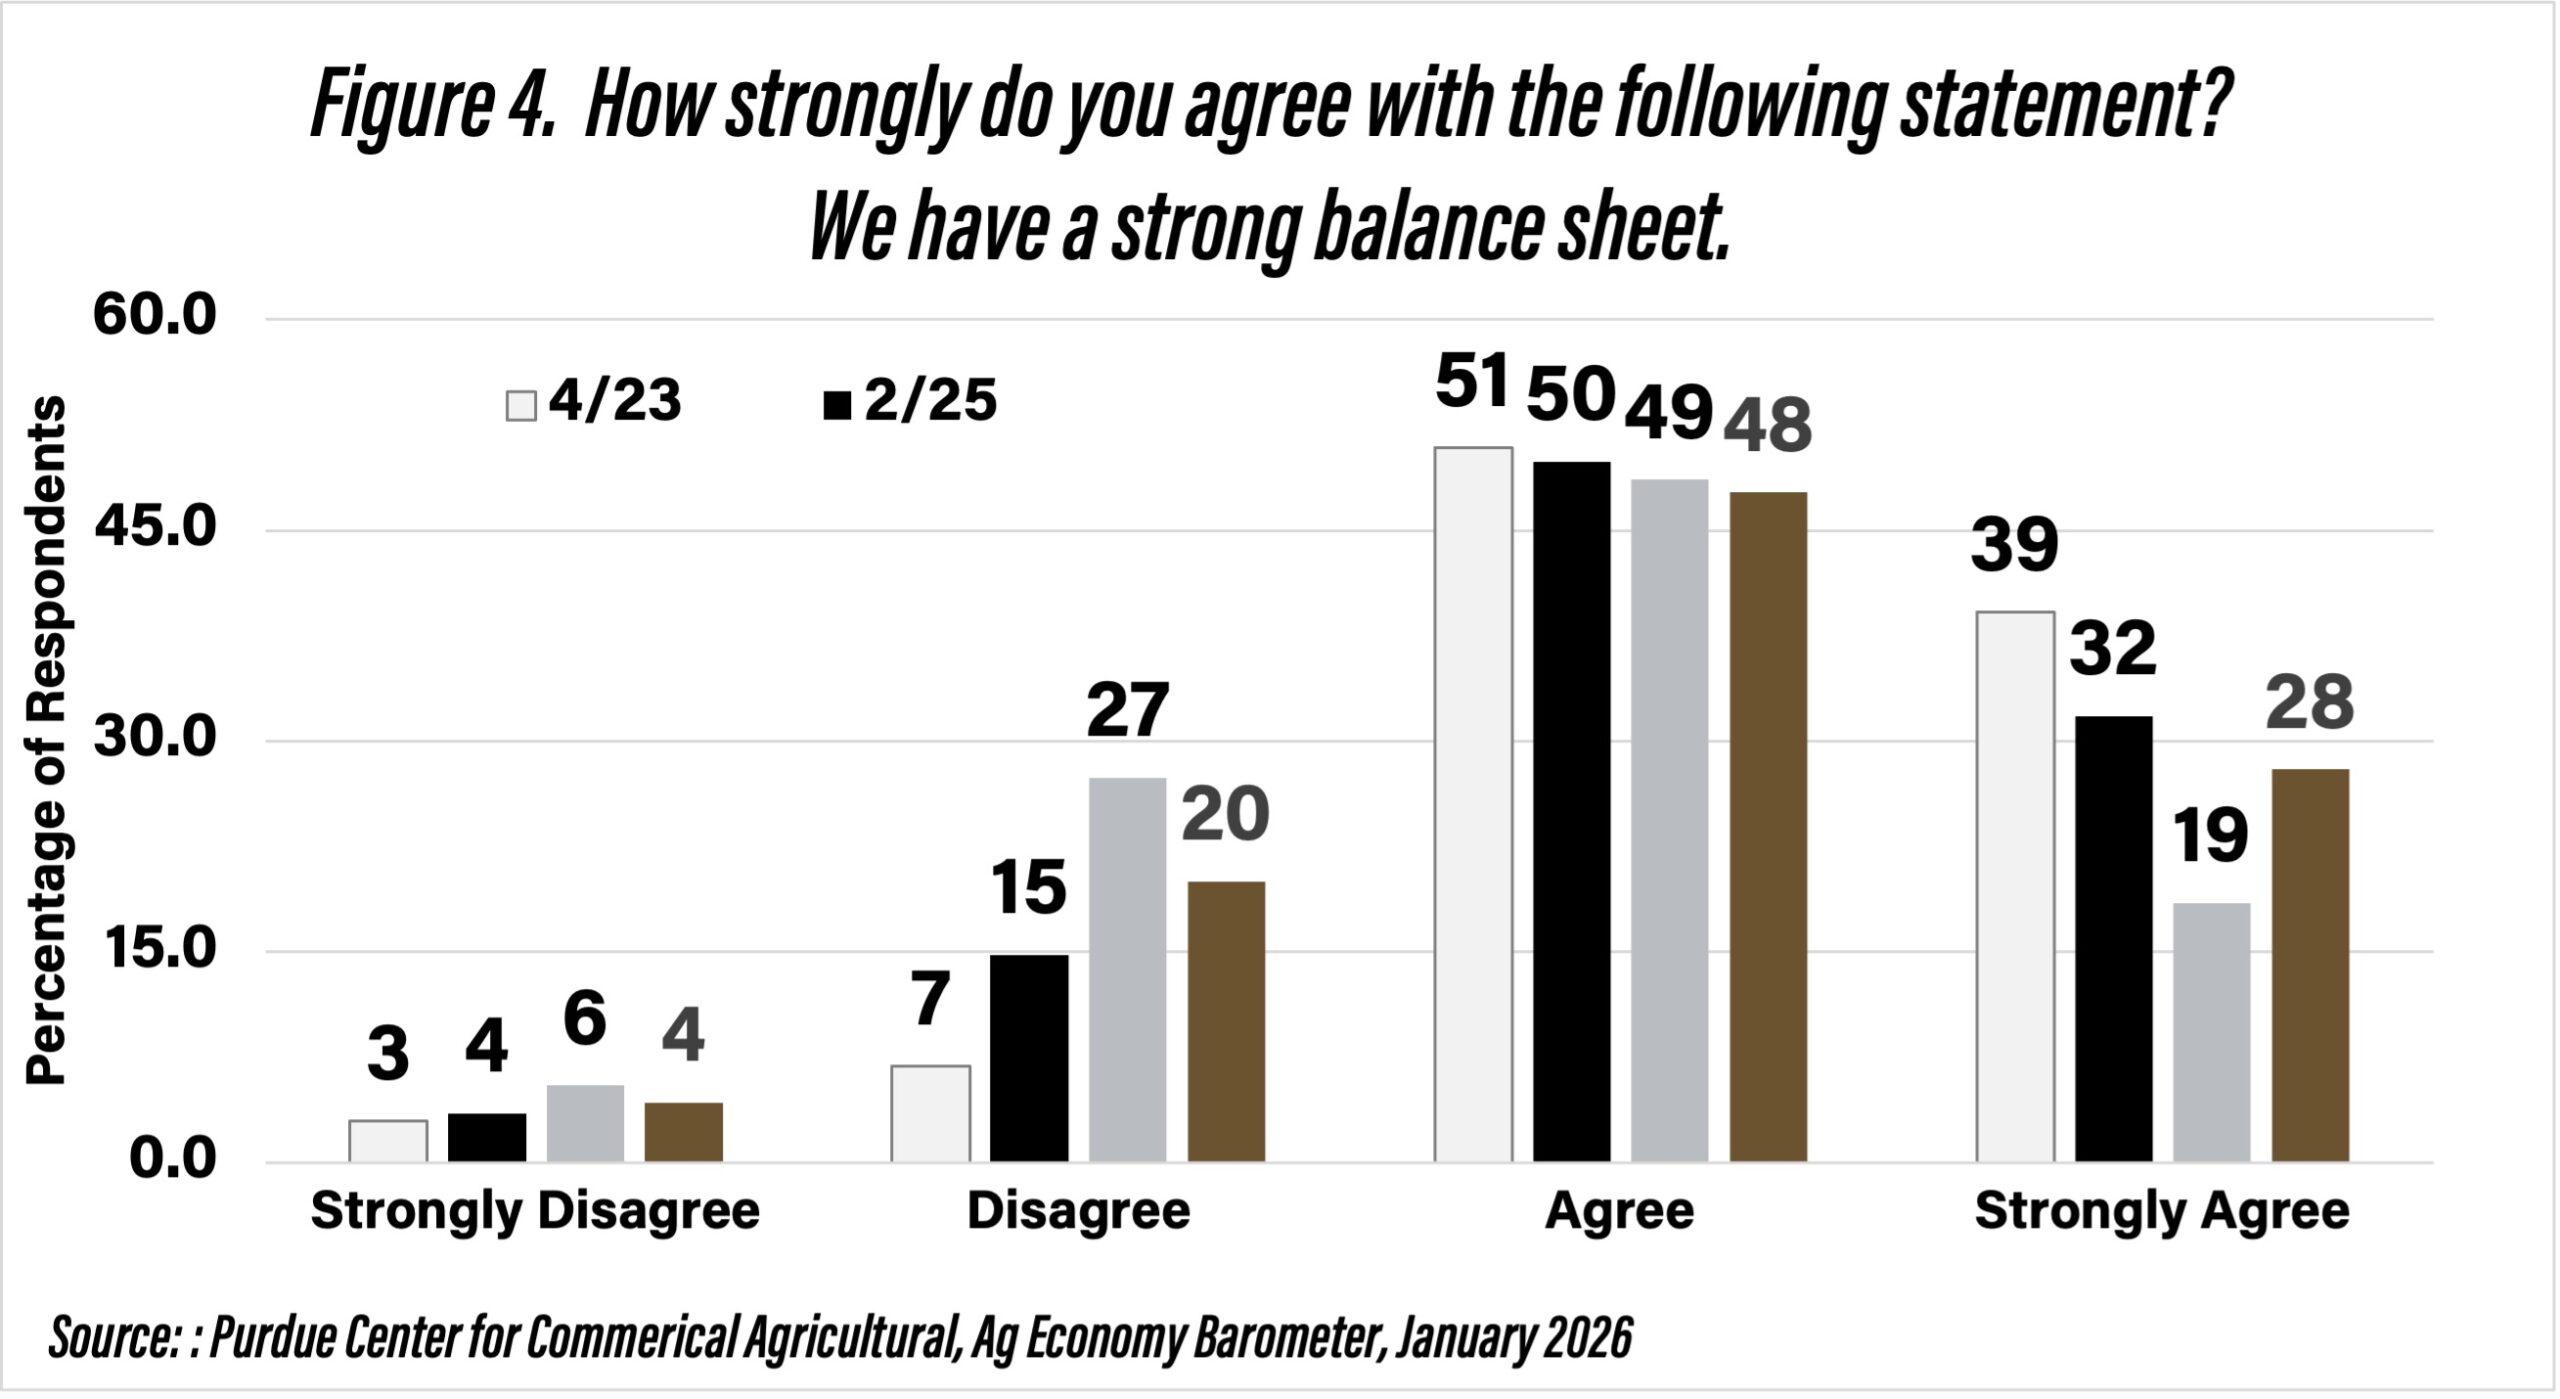
Figure 4. How strongly do you agree with the following statement? We have a strong balance sheet.
One of the keys to having a solid balance sheet is the relative strength or weakness of farmland values. In January 2026, 30% of respondents expected farmland values to increase in the next 12 months, and 61% of the respondents expected an increase over the next five years. The percentage of respondents expecting a decrease in short-term and long-term farmland values was 13% and 9%, respectively. A year ago, 30% of respondents expected farmland values to increase in the next 12 months, and 60% expected an increase over the next five years.
Conclusions
The January AEB surveys have included questions pertaining to operating loans since 2020. Since 2020, on average, 19% of survey respondents indicated that they expected in January that they were going to increase in size of their operating loans in the upcoming year. The primary reason for the increase was an increase in expected input costs. However, on average, 18% and 21% indicated that the expected increase was due to an increase in operating size and unpaid operating debt from prior years, respectively.
An implicit index of financial stress was created by multiplying the percentage of respondents who expected to increase the size of their operating loan by the percentage of respondents who indicated that the expected increase was due to unpaid operating debt from prior years. The lowest index was in 2023 (1.1) while the highest index was in 2026 (6.5). The index value in 2026 was higher than it was in 2020. The increase in this implicit index suggests that financial stress increased in 2025, reflecting higher input costs, tighter margins, and greater reliance on operating debt carried over from prior years.
Periodically, AEB surveys gauge the strength of individual respondent’s balance sheet. In January 2026, 76% of the respondents agreed and strongly agreed that they had a strong balance sheet. As a reference point, this percentage was 90% in April 2023, suggesting some weakening in financial positions more recently, despite federal assistance payments that have supported farm income.
References
Langemeier, M. and J. Colussi. “Farmer Sentiment Dropped Sharply as Concerns About the Agricultural Economy Increased.” Ag Economy Barometer, February 3, 2026. (https://ag.purdue.edu/commercialag/ageconomybarometer/).
Lippsmeyer, M. and M. Langemeier. “Agility and Absorption Capacity.” Center for Commercial Agriculture, Purdue University, April 24, 2023.
USDA-ERS. “Farm Income and Wealth Statistics – Data Files.” Accessed January 15, 2026. (https://ers.usda.gov/data-products/farm-income-and-wealth-statistics/data-files-us-and-state-level-farm-income-and-wealth-statistics).
![]()
![]()
![]()
![]()
![]()
TAGS:
TEAM LINKS:


RELATED RESOURCES
UPCOMING EVENTS
We are taking a short break, but please plan to join us at one of our future programs that is a little farther in the future.