Trinidad and Tobago Chocolate Consumer Market Study
May 13, 2026
PAER-2026-16
Marley Heritier, Master’s Student; Kenneth Foster, Professor of Agricultural Economics; Nicole Olynk Widmar, Department Head and Professor of Agricultural Economics; Amanda Dickson
![]()
![]()
![]()
![]()
![]()
Introduction
Trinidad and Tobago’s production and export of Trinitario cocoa have fallen sharply over the past several decades. At its peak in the 1920s, Trinidad and Tobago’s cocoa industry was a crucial contributor to the country’s socio-economic status. However, the current export level stands at a mere 80 tonnes annually (Figure 1). Starting in 1830, Trinidad and Tobago was the third largest cocoa exporter globally, supplying 20 percent of the world’s cocoa. The peak of the nation’s cocoa production occurred in 1921, with local production reaching 34,000 metric tonnes (Bekele, 2004).
Figure 1
Trinidad & Tobago Cocoa Bean Export Quantity (1961-2022) FAOSTAT Official Figures
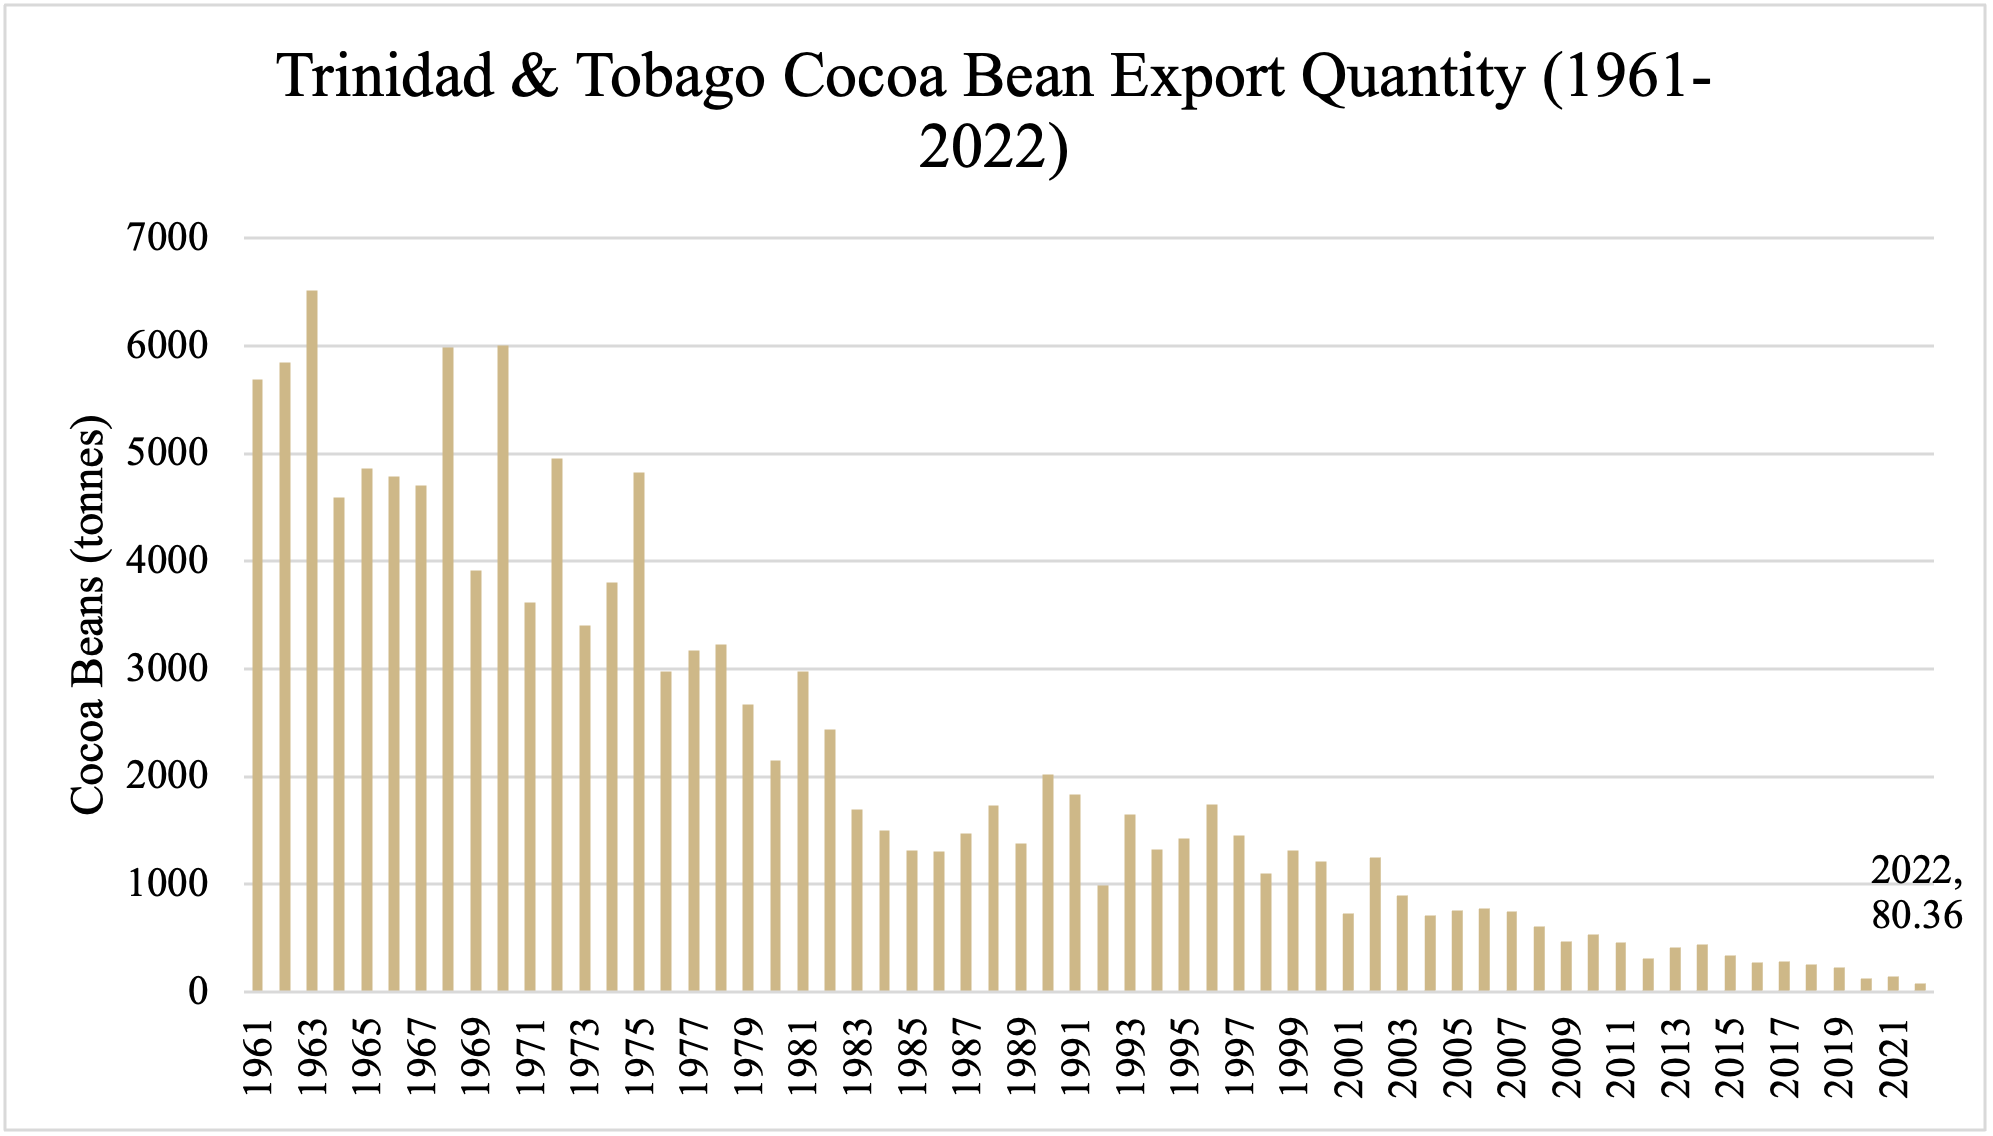
Several forces contributed to the decline: low global prices, labor shortages, the spread of Witches’ Broom and new competition from West Africa (Briton-Jones & Cheeseman, 2021). Concurrently, the discovery of rich oil deposits led to a shift in focus and workforce towards the oil industry, driving many plantation owners into bankruptcy and bringing the Trinidadian cocoa industry to the brink of extinction (Bharath, 2021).
Trinidad and Tobago possesses a vast array of Trinitario strains across its islands. Historically celebrated for its unique flavor profile and high quality, the decrease in production has resulted in the abandonment of valuable cocoa fields, casting uncertainty over the future of the nation’s cocoa industry. In recent years, growing interest from artisan and craft chocolate makers has created new opportunities for local cocoa and chocolate producers (Jewell, 2017).
The global chocolate confectionery market is forecast to reach approximately USD 139.9 billion by 2024 (Research and Markets, 2019). At the same time, demand for premium and artisanal chocolate products has increased, particularly among younger consumers, reflecting broader shifts in preferences toward quality and sustainability (IMARC Group, 2025). Efforts to revitalize the cocoa sector in Trinidad and Tobago are multifaceted. National institutions and initiatives, such as the Cocoa Research Centre’s IMPACTT project and the World Cocoa and Chocolate Day Expo, play important roles in these rehabilitation efforts. These initiatives aim to rehabilitate cocoa plantations, aligning with the government’s broader vision of economic diversification and sustainability (Cocoa Research Centre, 2019; Inter-American Development Bank, 2026b).
The World Cocoa and Chocolate Day Expo helps local producers develop high-quality products and reach buyers at home and abroad. According to Professor Umaharan, Director of the Cocoa Research Centre, the primary goal is to attract substantial investment to modernize farms and grow the sector. Dr. Umaharan asserts that while Trinidad and Tobago has a reputation for cocoa, the available opportunities have not been fully realized (Foreign Direct Investment, 2023).
History shows both the industry’s resilience and its potential. The initial collapse of Criollo cacao in the early 1720s, likely due to a natural disaster, led to hybridization with Forastero varieties, resulting in the world-renowned Trinitario cocoa. This variety is celebrated for its delicate flavor notes, strong productivity and pest tolerance, characteristics that have positioned it as a premium product in the global market.
Current government initiatives focus on better processing and a stronger chocolate sector (Moruga Agro-processing and Light Industrial Park). Additionally, projects like “Chocolate Island,” supported by organizations such as the Cropper Foundation and the Inter-American Development Bank Lab, aim to create a sustainable and environmentally compliant cocoa supply chain, benefiting local communities and positioning Trinidad and Tobago as a leader in the fine chocolate market (Inter-American Development Bank, 2026a).
A relevant study conducted in India provides additional context and underscores the importance of understanding consumer preferences in the chocolate market. Sondhi and Chawla (2021) identify key chocolate attributes influencing consumer choice in India. This study found that Indian consumers increasingly prefer chocolates over traditional sweets, consuming them both as snacks and desserts. The results indicate that successful chocolate producers align product attributes closely with consumer preferences.
The study’s findings indicated a growing trend of chocolate consumption, driven by factors such as gifting, snacking and desserts. The research emphasized the need for extensive distribution and strategic positioning of chocolate brands to appeal to value-conscious yet indulgent consumers.
The study from Sondhi and Chawla (2021) underscores the importance of understanding consumer preferences for industry growth. This relevance extends to Trinidad and Tobago, where identifying the chocolate attribute preferences of local consumers can stimulate demand and further grow the sector. Understanding these preferences is crucial for local producers to align their products with consumer expectations, ensuring the industry’s sustainability and potential expansion into other markets.
The problem is that Trinidadian chocolatiers lack knowledge about the specific attributes desired by their customers and potential customers. Hence, the research question the current study addresses is: What attributes do chocolate consumers consider when making a chocolate purchase in Trinidad and Tobago?
The next section of the paper describes the data collection process and methods of analysis utilized. This is followed by a section that presents the key results of the analysis, and the paper concludes with a section focused on the implications for Trinidad and Tobago’s chocolate industry and its participants, as well as opportunities for future research.
Methodology
Survey and Data Collection
An online survey instrument, approved by the university’s Institutional Review Board (IRB), was designed to gather information based on consumers’ opinions and preferences of chocolate in Trinidad & Tobago. The survey was administered from June 8 to June 30 of 2024, using Qualtrics, an online survey software, to accumulate demographic information, preferences when purchasing chocolate, and supporting details about such purchase-attribute preferences. Respondents for this survey were recruited via flyers and/or a verbal script. Participants were 18 or older.
All respondents were asked questions regarding their preferences when making chocolate purchasing decisions. The chocolate attributes that this study focuses on are price, cocoa percentage, filling, inclusions, assortment, production origin and sustainably produced. We selected the attributes with Café Mariposa, a local producer. Each attribute is defined in the survey before respondents were asked questions about them. They were defined as:
– Production Origin: Where was the cocoa produced? Where was the chocolate(s) crafted?
– Cocoa %: What percentage of cocoa is in the chocolates?
– Price: How much money you will purchase the chocolate for?
– Sustainably Produced: Is the cocoa produced using sustainable practices?
– Filling: What is the truffle or bar filled with, or not filled?
– Assortment: Imagine you are buying a box of chocolates. Do you prefer to select different flavors, cocoa percentages, fillings, and inclusions, or have all of the same chocolate?
– Inclusions: Are there inclusions in the chocolate, such as nuts or fruit (or your favorite inclusion)?
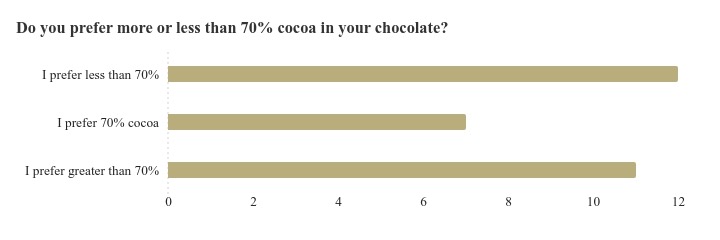
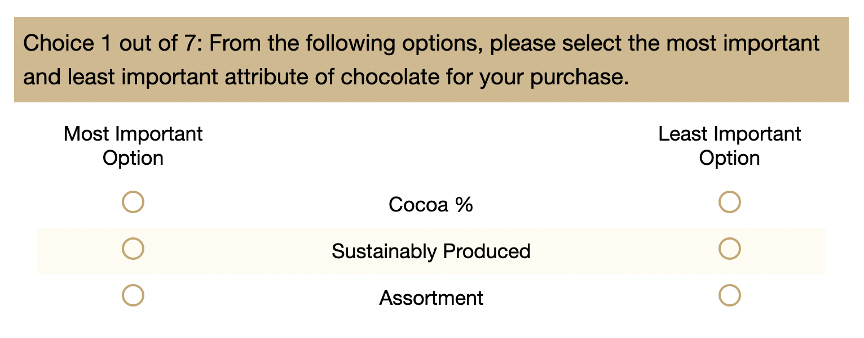
Survey respondents were given seven choices with three attributes each. With this design, the respondent is asked to imagine they are purchasing chocolate and to choose the “Most Important Option” and the “Least Important Option” of the three attributes listed for each choice, leaving one option (of the three) unselected, effectively ranking the options first, second and third. The survey also included initial and follow-up questions regarding the attributes. These questions include “why do you buy chocolate?” and “do you prefer more or less than 70% cocoa in your chocolate?” as seen in Figure 2.
Figure 2
Do you prefer more or less than 70% cocoa?
Several handwritten survey responses were excluded because key Best–Worst choice tasks were incomplete or missing, resulting in a final analytic sample of 35 respondents. The survey instrument, as well as other survey and recruitment materials used in this research, are available from the lead author on request.
Best-Worst Scaling (BWS)
Best‑Worst Scaling (Finn & Louviere, 1992) extends paired comparison methods to multiple attribute (Erdem et al., 2012). While the method of paired comparison investigates trade-offs between pairings of items, BWS extends this to multiple product attributes, enabling respondents to select the “best” and “worst” attributes of the given choices (de-Magistris et al., 2014; Erdem et al., 2012). With BWS, respondents compare attributes directly instead of using rating scales (Auger & Devinney, 2007; Flynn et al., 2007). This approach reduces bias and offers a clearer representation of consumer preferences (Baumgartner & Steenkamp, 2001; Lusk & Briggeman, 2009).
Best-Worst Analysis and Preference Heterogeneity
To conduct the Best–Worst Scaling (BWS) analysis, respondents were presented with seven choice sets, each containing three chocolate attributes. In each set, respondents identified the most important (“best”) and least important (“worst”) attribute, implicitly ranking all three attributes (see Figure 3).
Following standard BWS methodology, the frequency with which each attribute was selected as “most important” and “least important” was computed across respondents. A Best–Worst (BW) score was then calculated as:
BWj=Best Countj-Worst Countj
where higher values indicate greater relative importance.
To formally model attribute preferences, a multinomial logit (MNL) framework was first considered, where the probability of selecting attribute j as most important and attribute k as least important is expressed as a function of the difference in their latent utility. However, because the MNL model assumes homogeneous preferences across individuals, a random parameters logit (RPL) model was employed to allow preferences to vary across respondents.
Under the RPL specification, attribute coefficients are treated as random variables, capturing unobserved heterogeneity in consumer preferences. The statistical significance of the estimated standard deviations provides evidence of variation in preferences across individuals.
To make preference differences easier to interpret, individual-level BW scores were constructed for each respondent by assigning +1 when an attribute was selected as “most important” and −1 when selected as “least important.” These scores were then aggregated by demographic characteristics (e.g., gender and age) and behavioral variables (e.g., purchasing frequency). This approach allows for the identification of systematic differences in attribute preferences across consumer groups.
We compute attribute shares following Lusk and Briggeman (2009):
Sj=eλj∑k=1Jeλk
where Sj represents the relative importance of attribute j.
Figure 3
Exemplary Choice Set used in the study from Qualtrics Survey
Results
Demographics and Chocolate Purchasing Habits
The study sample (n = 35) was designed to approximate the general population of Trinidad and Tobago. Although the sample size is modest (n = 35), the study is intended as an exploratory analysis of chocolate attribute preferences, providing initial evidence on consumer decision‑making in Trinidad and Tobago. The sample consisted of 40 percent male and 60 percent female respondents. The largest age group was individuals aged 25–34, representing 27 percent of participants. Additionally, 85 percent of respondents reported at least one household member.
Chocolate purchasing behavior was common among respondents. Approximately 42 percent reported frequently purchasing chocolate for themselves, while 55 percent did so occasionally and only 3 percent reported never purchasing chocolate. Similarly, 63 percent indicated that they occasionally purchased chocolate for others.
Preferences for Chocolate Attributes
Cocoa percentage ranks first in importance; price ranks second. Both attributes are positive and statistically significant at conventional levels (p < 0.01), indicating strong and consistent preferences across respondents.
Figure 4
Random Parameters Logit Preference Shares
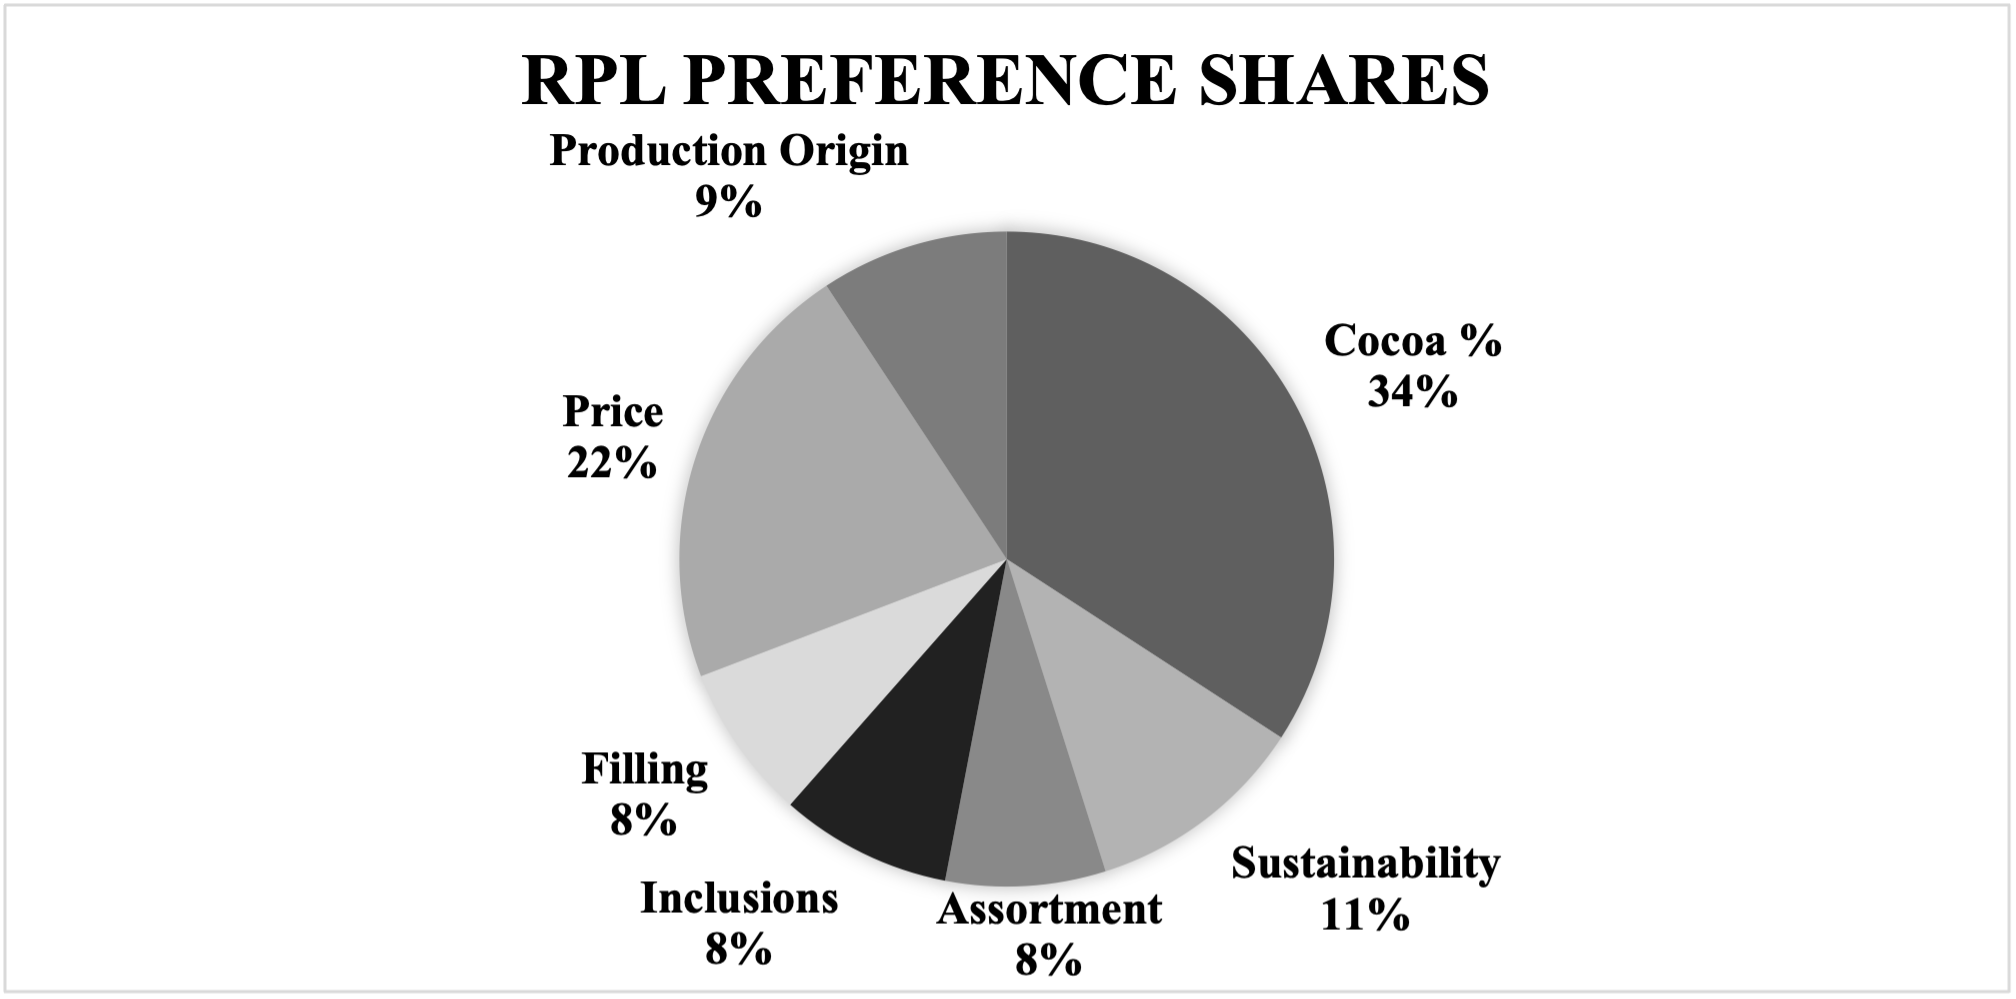
Cocoa percentage accounts for approximately 34 percent of total preference share, while price accounts for 22 percent. All other attributes—sustainability, production origin, assortment, inclusions and filling—are substantially less influential, each contributing less than 11 percent.
Assortment, inclusions and filling have negative, statistically insignificant coefficients, suggesting these features do not systematically increase utility. Instead, their relative importance varies across individuals. Similarly, sustainability and production origin are not statistically significant drivers of choice, indicating that these attributes do not strongly influence purchasing decisions in the aggregate.
Cocoa Preference and Purchasing Behavior
Further descriptive analysis suggests that preferences for cocoa percentage are somewhat divided. While 40 percent of respondents prefer chocolate with less than 70 percent cocoa, 37 percent prefer chocolate with more than 70 percent cocoa and 23 percent prefer exactly 70 percent cocoa. Preferences for cocoa levels vary widely, even though cocoa percentage is the top attribute overall.
Sustainability and Origin
Although sustainability ranks third in relative importance (11 percent), its coefficient is not statistically significant, and survey responses indicate mixed attitudes. Only 29 percent of respondents can be classified as “promoters” of sustainability claims, while 39 percent are “detractors.” This suggests that sustainability does not consistently translate into purchasing behavior, despite being conceptually important to some consumers. Notably, data collection occurred shortly after an environmental oil spill in Trinidad and Tobago; however, sustainability did not emerge as a statistically significant determinant of purchasing behavior, suggesting limited spillover from environmental events into consumer chocolate preferences.
Origin ranks fourth (9 percent share) and is not statistically significant. While 70 percent of respondents expressed a preference for locally produced chocolate, this preference appears conditional. Specifically, respondents value ‘local’ only when cocoa percentage and price already meet expectations.
Consumer Heterogeneity by Demographics and Purchasing Behavior
The random-parameters estimates show substantial preference heterogeneity, as shown in Table 1. The standard deviations of several attributes—including cocoa percentage, sustainability, inclusions, filling and price—are statistically significant, indicating substantial variation in how individuals value these characteristics.
Table 1
Random Parameters Logit Estimates
|
Variable |
Coefficient |
Std. |
z-value |
p-value |
95% |
95% |
|
Random |
||||||
|
Cocoa |
1.303*** |
0.327 |
3.98 |
0.0001 |
0.661 |
1.945 |
|
Sustainability |
0.164 |
0.204 |
0.80 |
0.4221 |
-0.237 |
0.565 |
|
Assortment |
-0.161 |
0.195 |
-0.83 |
0.4083 |
-0.543 |
0.221 |
|
Inclusions |
-0.090 |
0.208 |
-0.43 |
0.6668 |
-0.498 |
0.319 |
|
Filling |
-0.191 |
0.225 |
-0.85 |
0.3971 |
-0.632 |
0.251 |
|
Price |
0.841*** |
0.309 |
2.72 |
0.0066 |
0.235 |
1.447 |
|
Random |
||||||
|
Cocoa |
1.285*** |
0.344 |
3.73 |
0.0002 |
0.610 |
1.960 |
|
Sustainability |
0.413** |
0.199 |
2.07 |
0.0383 |
0.022 |
0.804 |
|
Assortment |
0.299 |
0.243 |
1.23 |
0.2177 |
-0.177 |
0.775 |
|
Inclusions |
0.461* |
0.240 |
1.92 |
0.0551 |
-0.010 |
0.931 |
|
Filling |
0.772** |
0.323 |
2.39 |
0.0168 |
0.139 |
1.405 |
|
Price |
1.238*** |
0.310 |
3.99 |
0.0001 |
0.629 |
1.846 |
This heterogeneity is particularly evident for product features such as inclusions, fillings, and assortment, where respondents exhibit polarized preferences. Some consumers strongly prefer plain chocolate, while others favor more complex products with additional flavors and textures. This helps explain why these attributes are not significant in the aggregate model despite being important for specific segments.
To further explore heterogeneity in preferences, in Table 2, Best–Worst scores were calculated at the individual level and compared across demographic groups and purchasing frequency.
Differences by gender were limited and not statistically significant, suggesting that male and female respondents exhibit broadly similar preferences across chocolate attributes.
In contrast, variation across age groups and purchasing frequency reveals more meaningful patterns. Younger consumers (18–24) weigh inclusions and price more and origin less. This suggests a preference for more differentiated or experiential chocolate products among younger respondents.
Differences are most pronounced when comparing purchasing frequency. Occasional chocolate buyers place greater importance on cocoa percentage and price, while sustainability is consistently ranked as less important across groups. Frequent purchasers exhibit slightly lower emphasis on cocoa percentage, suggesting that habitual buyers may be less sensitive to specific product attributes and more influenced by routine or brand familiarity.
Overall, these results reinforce the presence of heterogeneous preferences across consumers, particularly along behavioral dimensions such as purchasing frequency, rather than purely demographic characteristics.
Table 2
Preference Score by Consumer Group
|
Variable |
Cocoa |
Price |
Sustainability |
Origin |
Assortment |
Inclusions |
Filling |
|
Gender |
|||||||
|
Female |
0.50 |
0.00 |
-1.00 |
0.00 |
0.00 |
0.00 |
0.25 |
|
Male |
1.00 |
0.00 |
— |
0.00 |
0.00 |
0.00 |
— |
|
Age |
|||||||
|
18–24 |
— |
1.00 |
— |
-1.00 |
0.00 |
1.00 |
— |
|
25–34 |
1.00 |
0.00 |
— |
— |
— |
— |
0.25 |
|
35–44 |
— |
— |
-1.00 |
— |
0.00 |
— |
— |
|
Purchase |
|||||||
|
Occasionally |
1.00 |
0.50 |
-1.00 |
0.00 |
0.00 |
0.00 |
0.00 |
|
Often |
0.50 |
— |
— |
— |
0.00 |
— |
— |
Note: Values represent average individual Best–Worst (BW) scores, where higher values indicate greater relative importance of an attribute. A dash (—) indicates insufficient observations or no variation within the subgroup.
Overall, the results suggest that chocolate purchasing decisions in Trinidad and Tobago are driven primarily by core product characteristics, specifically cocoa percentage and price. Attributes related to product differentiation (e.g., fillings, inclusions, assortment) and credence characteristics (e.g., sustainability and origin) play a secondary and more heterogeneous role.
Discussion
This study provides insight into how consumers in Trinidad and Tobago evaluate chocolate products, highlighting a clear hierarchy in attribute importance. The results demonstrate that core product characteristics—particularly cocoa percentage and price—dominate purchasing decisions, while other attributes such as sustainability, origin and product variety play a more limited or heterogeneous role.
The prominence of cocoa percentage suggests that consumers prioritize intrinsic product quality when making decisions. This aligns with the role of cocoa content as a signal of both taste and perceived quality in chocolate products. Price, as the second most important attribute, further reinforces the importance of traditional economic factors in shaping consumer behavior. Overall, consumers rely on tangible, immediately observable attributes rather than credence characteristics.
One notable finding is the lack of statistical significance for sustainability, despite growing global interest in environmentally and socially responsible food systems. Even more striking is that this study was conducted shortly after a domestic oil spill, an event that might be expected to heighten environmental awareness. Environmental shocks did not change chocolate purchases in our sample. Consumers may not associate cocoa production with environmental harm, limiting the salience of sustainability in this context.
Similarly, production origin was not a significant determinant of choice, despite a stated preference for locally produced chocolate among respondents. This pattern reflects the gap between stated and revealed preferences: respondents express support for local products but ultimately prioritize price and core product characteristics. Local origin appears to function as a secondary attribute—valued only when primary criteria are satisfied.
The results also reveal substantial heterogeneity in preferences, particularly for attributes such as inclusions, fillings and assortment. While these attributes were not significant on average, the variation in responses suggests the presence of distinct consumer segments with differing tastes. Some consumers strongly prefer plain chocolate, while others value more complex flavor profiles. This polarization highlights the importance of product differentiation strategies for firms targeting niche markets, even if these attributes do not drive demand at the aggregate level.
From a managerial perspective, these findings suggest that chocolate producers and retailers in Trinidad and Tobago should prioritize product quality and competitive pricing over sustainability labels or variety alone. While sustainability and origin may enhance brand image for certain consumers, they are unlikely to drive widespread purchasing behavior without alignment with core product attributes.
Finally, these findings raise broader questions about the conditions under which external events—such as environmental disasters or food safety recalls—affect consumer demand. Future work could test whether product-specific shocks (e.g., recalls or label changes) matter more than indirect environmental events. Additionally, further work could investigate interaction effects between attributes (e.g., cocoa percentage combined with inclusions) to better understand how consumers evaluate multi-attribute chocolate products in practice.
Conclusions
This study examined the chocolate attribute preferences of consumers in Trinidad and Tobago using a Best–Worst Scaling approach. The objective was to identify which product characteristics most strongly influence purchasing decisions and to assess the extent of preference heterogeneity across consumers.
The results indicate a clear hierarchy of attributes. Cocoa percentage and price dominate chocolate choice. Other attributes—including sustainability, production origin, assortment, inclusions and filling—play a secondary role and exhibit substantial variation across individuals. While many respondents express support for locally produced or sustainably made chocolate, these attributes do not consistently translate into purchasing decisions when core product characteristics are not satisfied.
The study contributes to the limited empirical literature on consumer food preferences in small island economies and provides the first evidence, to our knowledge, on chocolate attribute valuation in Trinidad and Tobago using experimental choice methods. By distinguishing between aggregate preferences and individual-level heterogeneity, the findings highlight the importance of recognizing consumer segments rather than relying on average effects alone.
Several limitations should be noted. The sample size is modest, and the analysis is exploratory in nature. While the results offer valuable initial insights, they should not be interpreted as nationally representative. Additionally, the study focuses on a limited set of attributes and does not explicitly model brand effects, which may also influence consumer decisions.
Future research could build on these findings by expanding the sample size, incorporating price variation explicitly and examining interactions between attributes such as cocoa percentage and product differentiation. Further work could also explore whether targeted sustainability or origin messaging affects specific consumer segments rather than the market as a whole.
Overall, the findings suggest that efforts to strengthen the chocolate sector in Trinidad and Tobago are most likely to succeed when they prioritize core product quality and competitive pricing, while using differentiation and credence attributes strategically to appeal to niche consumer groups.
References
Auger, P., & Devinney, T. M. (2007). Do what consumers say matter? The misalignment of preferences with unconstrained ethical intentions. Journal of Business Ethics, 76(4), 361–383. https://doi.org/10.1007/s10551-006-9287-y
Baumgartner, H., & Steenkamp, J.-B. E. M. (2001). Response styles in marketing research: A cross-national investigation. Journal of Marketing Research, 38(2), 143–156. https://doi.org/10.1509/jmkr.38.2.143.18840
Bekele, F. L. (2004). The history of cocoa production in Trinidad and Tobago. In Proceedings of the APASTT seminar – exhibition entitled re-vitalisation of the Trinidad & Tobago cocoa industry (pp. 4–12).
Bharath, S. (2021, June 24). History of cocoa in Trinidad. Meridian Cacao Co. https://meridiancacao.com/blogs/news/history-of-cocoa-in-trinidad
Briton-Jones, H. R., & Cheeseman, E. E. (2021). A new aspect of witch broom control in Trinidad. Tropical Agriculture. https://journals.sta.uwi.edu/ojs/index.php/ta/article/view/8235
Cocoa Research Centre. (2019). IMPACTT: Improvement of cocoa production and technology in Trinidad and Tobago. https://sta.uwi.edu/cru/
de-Magistris, T., Gracia, A., & Albisu, L.-M. (2014). Wine consumers’ preferences in Spain: An analysis using the best–worst scaling approach. Spanish Journal of Agricultural Research, 12(3), 529–541. https://doi.org/10.5424/sjar/2014123-4499
Erdem, S., Rigby, D., & Wossink, A. (2012). Using best–worst scaling to explore perceptions of relative responsibility for ensuring food safety. Food Policy, 37(6), 661–670. https://doi.org/10.1016/j.foodpol.2012.07.010
Finn, A., & Louviere, J. J. (1992). Determining the appropriate response to evidence of public concern: The case of food safety. Journal of Public Policy & Marketing, 11(2), 12–25. https://doi.org/10.1177/074391569201100202
Flynn, T. N., Louviere, J. J., Peters, T. J., & Coast, J. (2007). Best–worst scaling: What it can do for health care research and how to do it. Journal of Health Economics, 26(1), 171–189. https://doi.org/10.1016/j.jhealeco.2006.04.002
IMARC Group. (2025). Premium chocolate market report: Trends and forecast 2025–2033. https://www.researchandmarkets.com/report/gourmet-chocolate
Inter-American Development Bank. (2026a, March 18). Chocolate Island: Cocoa, carbon and community. https://www.iadb.org/en/project/TT-T1132
Inter-American Development Bank. (2026b, March 31). Improving marketing and production of artisanal cocoa from Trinidad and Tobago. https://www.iadb.org/en/project/TT-M1031
Jewell, C. (2017, October). Breathing new life into Trinidad and Tobago’s cocoa sector. WIPO. https://www.wipo.int/wipo_magazine/en/2017/05/article_0005.html
Lusk, J. L., & Briggeman, B. C. (2009). Food values. American Journal of Agricultural Economics, 91(1), 184–196. https://doi.org/10.1111/j.1467-8276.2008.01175.x
Research and Markets. (2019, June 28). Chocolate market – growth, trends, and forecast (2019–2024). PR Newswire. https://www.prnewswire.com/news-releases/139-94-billion-chocolate-market—global-growth-trends-and-forecast-2019-2024–300876212.html
Sondhi, N., & Chawla, D. (2021). Positioning implications for chocolate brands: An attribute-based approach. Global Business Review, 22(1), 184–196. https://doi.org/10.1177/0972150918795360
University of the West Indies. (2023, October 26). Foreign direct investment—The goal for World Cocoa and Chocolate Day Expo. UWI Campus News. https://sta.uwi.edu/news/releases/release.asp?id=22719
![]()
![]()
![]()
![]()
![]()
