The June 2026 CPI and PPI Reports: The Pipeline Cools Across Every Stage
July 17, 2026
PAERPB-2026-12
Ken Foster, Professor of Agricultural Economics and Director, Purdue Farm Policy Study Group; Bernhard Dalheimer, Assistant Professor of Macroeconomics and Trade


Two Reports, One Cooling Signal
The June 2026 CPI and PPI releases, published a day apart, both show a deceleration after five months of steady acceleration. The Consumer Price Index is up 3.5% over the year but fell by 0.4 percent relative to May. The Producer Price Index for final demand fell 0.3 percent, after rising 0.6 percent in May and 1.1 percent in April. In both reports, the reversal reflects lower energy prices during June compared with April and May. CPI energy fell 5.7 percent, and PPI final demand energy fell 6.4 percent in June. The “core” measures that exclude food, energy, and (for PPI) trade margins also converged sharply — CPI core was steady (0.0 percent), and PPI core is up by 0.1 percent, which closes the 0.6-point gap between them that we flagged as a risk factor in Brief #2026-8.
Food, notably, did not follow the spring’s upstream buildup. CPI food-at-home rose just 0.2 percentage points in June — below the 0.5 percent monthly threshold set in Brief #2026-8 as the test for the central pass-through scenario and essentially unchanged from May’s 0.1 percent. However, consumer food prices are up 3% over the year. At the producer level, processed foods and feeds edged up only 0.1 percent, and food inputs to Stage 3 and Stage 4 intermediate demand were flat to negative for the month, a reversal of the positive monthly gains recorded from March through May.
Figure 1
Producer Price Index
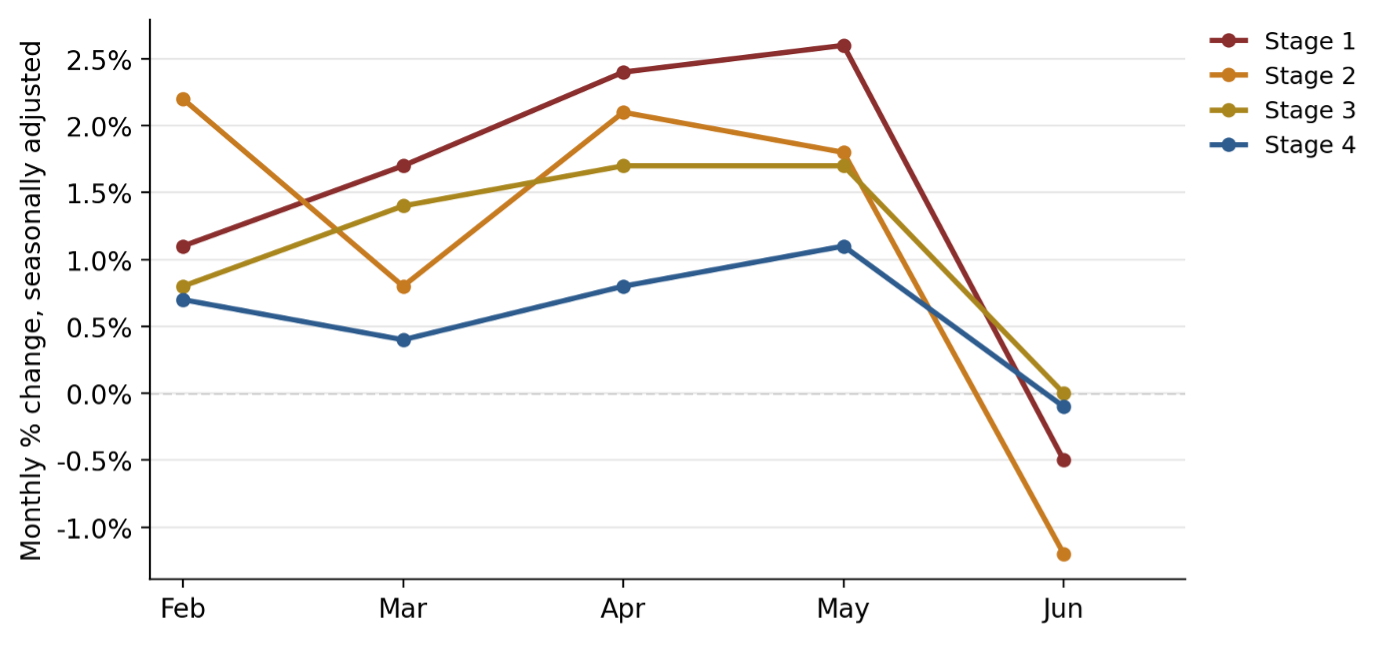
Stage 1–4 intermediate demand, monthly percent change, seasonally adjusted, February–June 2026.
Source: U.S. Bureau of Labor Statistics, PPI Detailed Report, Data for June 2026.
The Pipeline Cools at Every Stage
The deceleration reached every stage of the PPI production chain, not just the headline (Figure 1). Stage 1 intermediate demand — prices for the earliest, most commodity-like inputs — fell 0.5 percent in June, BLS’s largest one-month decline for that series since September 2024, after averaging roughly +2 percent a month from March through May. Stages 2 through 4 eased in step. Thermoplastic resins and materials — one of the sharpest movers in the spring buildup — reversed from +15.5 percent in May to −3.4 percent in June. Because the slowdown is largest and appears earliest at Stage 1 — the stage closest to crude energy and raw commodity prices — this looks like a genuine easing of the underlying shock rather than simply a pause in downstream pass-through.
Figure 2
CPI Energy and Food-at-Home Indexes
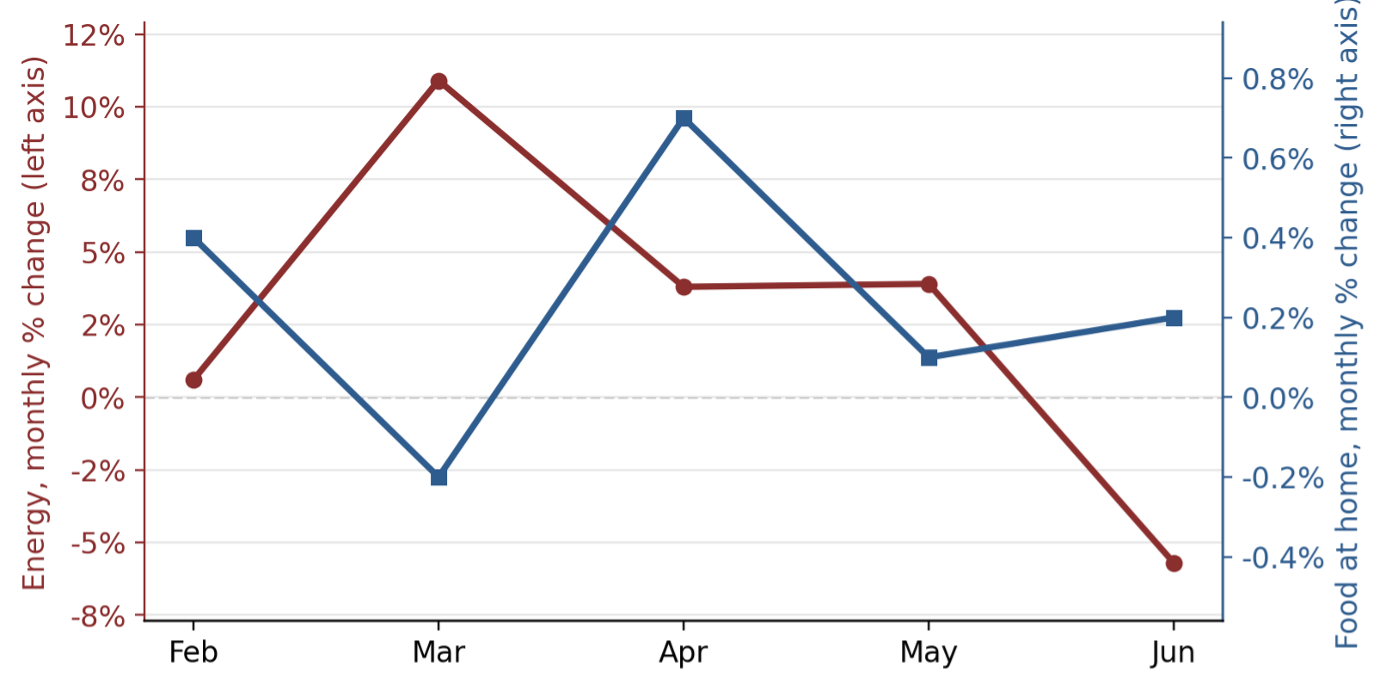
Monthly percent change, seasonally adjusted, February–June 2026 (dual axis; note the two series are plotted on different vertical scales).
Source: U.S. Bureau of Labor Statistics, Consumer Price Index News Release, June 2026 (USDL-26-1191).
Figure 2 makes the same point at the retail level. Over the past five months, CPI energy swung between −9.7 percent (gasoline, June) and +21.2 percent (gasoline, March), while food-at-home stayed within a narrow 0.9-point band throughout. That pattern is consistent with our earlier finding that energy shocks do not transmit strongly or quickly into retail food prices. It is also consistent with a second, related possibility: that processors, wholesalers, and retailers absorbed the spring’s cost increases into margins rather than passing them through, on the expectation that costs would soon ease. One month of data cannot separate these two explanations; retail and wholesale trade-margin detail in the next release would help.
Food CPI by Category: What’s Driving the Details
Drilling into the categories behind the June food and energy numbers turns up the same two-force pattern we have tracked all year: most of what moved this month reflects category-specific supply and policy stories that have little to do with the conflict, layered beneath an energy shock that is itself now reversing.
– Energy (+15.7% 12-month, −5.7% monthly). The June 17 Islamabad MOU reopened the Strait of Hormuz with a 60-day toll-free transit window, and crude fell into the high-$50s/low-$60s through most of the month — the mechanism behind June’s −9.7 percent gasoline reading, the largest since April 2020. PPI’s single pricing date (June 9) actually predates the formal signing, so markets were pricing in de-escalation before the agreement itself. The ceasefire has since fractured. Renewed military strikes in early-to-mid July pushed crude back toward $71–$78 a barrel, a reversal not captured in either report. However, crude prices have been consistently below $90 since June, whereas they were regularly above $90 from March to May.
– Dairy (+0.4% 12-month, +1.2% monthly). A sharp reversal from May’s −1.0 percent / −0.6 percent. Dairy, like other feed-intensive categories, had been benefiting from cheap soybean meal — a co-product of expanded biodiesel crush capacity — and that offset appears to be fading, with cheese up 2.8 percent and milk up 2.0 percent for the month. Summer heat’s well-documented drag on milk yield is a plausible secondary contributor; raw milk prices also rose again in the June PPI. This also suggests that upstream energy impacts of the conflict may have reached the retail dairy aisle in June.
– Fruits and vegetables (+5.3% 12-month, −0.2% monthly). Three distinct, non-conflict stories sit inside this aggregate. Citrus (+6.3% 12-month, +3.4% monthly) reflects Florida’s structural citrus collapse — disease, freeze, and hurricanes have cut the state’s crop by more than 90 percent since the late 1990s — compounded by California heat damage to this year’s Navel crop. Lettuce (+32.1% 12-month, +6.5% monthly, reversing May’s −4.8 percent) reflects Salinas Valley heat-wave losses. Tomatoes (+19.5% 12-month, but −10.0% monthly — the largest monthly decline since January 2015) reflect the 17 percent antidumping duty on Mexican tomatoes the USITC upheld on June 30 and heat-wave impacts on supply from Mexico, Arizona, and California; June’s sharp monthly drop is simply the normal seasonal recovery in domestic supply layered on top of that now-durable, higher baseline.
– Coffee (+12.9% 12-month, −2.0% monthly). The monthly easing tracks Brazil’s projected record 2026/27 harvest, forecast to be up roughly 25 percent at a favorable point in the biennial arabica cycle. The relief looks incomplete: persistent rain has slowed the actual harvest pace (52 percent complete as of July 1, behind the five-year average), which pushed futures to five-month highs earlier this month, and a forecast “Super El Niño” threatens the crop that begins flowering in September. Tariffs on Brazilian and Colombian coffee remain layered on top of both.
– Beef (+11.8% 12-month, +1.2% monthly). The Southern Plains drought that drove the herd contraction has eased substantially since June 2025, but a La Niña-driven relapse risk resurfaced in October and shows up as a genuinely mixed picture in the most recent Drought Monitor. More binding than drought status at this point is cattle biology: a rancher who retains a heifer today waits roughly three years before that decision adds to beef supply, so the herd — 86.2 million head as of January 1, the smallest since 1951 — is not expected to begin rebuilding before 2028, regardless of what the weather does next. The 2021–22 feed-cost spike that compounded the drought has fully unwound (corn is back near $4.10/bushel versus its 2022 peak above $7), but cheaper feed cannot shorten the multi-year rebuild clock.
– Pork (+2.4% 12-month, −0.3% monthly). Retail beef price now runs much higher relative to retail pork price, up from about 1.3 times fifteen years ago, because hog supply can respond to price signals within about a year — sows farrow about twice yearly, and hogs reach market weight in five to six months — rather than cattle’s multi-year cycle. Cheaper feed and heavier market weights have pushed 2026 pork production 1–2 percent above last year, and farm-level hog prices have softened accordingly: lean hog futures were down roughly 9.5 percent year-over-year in mid-July. Retail pork has stayed comparatively firm regardless — 2025’s average retail price was in fact a record high. Part of the explanation is demand-side rather than supply-side: with beef this expensive, some consumers are shifting purchases toward pork, and that substitution-driven demand gives retailers less competitive pressure to pass falling farm and wholesale carcass prices through to the consumer. In a modest way, expensive beef is propping up what consumers pay for pork.
A Timing Caveat
BLS prices PPI inputs as of a single reference date — the Tuesday of the week containing the 13th, which was June 9 this cycle — while CPI prices are collected throughout the month. Both windows closed well before the US-Iran conflict resumed in early to mid-July, when crude prices began climbing back toward $75–$80 a barrel. This report is a clean read of the de-escalated window in place through mid-June; it is not a verdict on where prices settle if the current flare-up continues into the July data, due out on August 12 (CPI) and August 13 (PPI).
The Bottom Line
June’s CPI and PPI both cooled, and the cooling reaches all the way back to Stage 1 — consistent with a genuine, if possibly temporary, easing of the energy shock rather than a one-month statistical blip. But most of the movement inside the food basket this month — dairy’s reversal, the citrus and lettuce climate stories, the tomato tariff baseline, Brazil’s coffee cycle, and the beef–pork divergence — traces to category-specific supply and policy dynamics that would be happening with or without the conflict. The open question is whether June’s quiet is the start of a resolution or a pause before renewed cost pressure re-enters the pipeline; July’s data, reflecting the conflict’s renewed flare-up, will be the first real test. Moreover, substitution and other general equilibrium effects seem to kick in, resulting in more modest oil price responses to the Hormuz closure relative to the first time in March of this year.
Data Sources
U.S. Bureau of Labor Statistics. Consumer Price Index — June 2026. USDL-26-1191. Released July 14, 2026.
U.S. Bureau of Labor Statistics. Producer Price Index — June 2026. PPI Detailed Report. Released July 15, 2026.
Earlier briefs in this series: Foster & Dalheimer (2026), available at ag.purdue.edu/commercialag.