El Niño 2026: Converging Pressures on Vegetable Oil Markets
July 6, 2026
PAERPB-2026-11
Ken Foster, Professor of Agricultural Economics and Director, Purdue Farm Policy Study Group; Bernhard Dalheimer, Assistant Professor of Macroeconomics and Trade; David Ubilava, Associate Professor of Economics, University of Sydney


Key Takeaways
-
- – The ENSO spring predictability barrier has been crossed. As of mid-June 2026, the International Research Institute for Climate and Society (IRI) assigns a 97–98 percent probability to El Niño persisting through the remainder of 2026. Dynamical models now project a peak Niño3.4 anomaly near 2.5–2.6°C, which would rank among the strongest events on record.
- – Vegetable oils — palm oil and soybean oil in particular — are the commodity group where the academic literature most consistently documents material price impacts from El Niño. We focus this brief on the channels where the evidence is strongest.
- – We identify a convergence of two independent pressures on global vegetable oil markets operating simultaneously and in the same direction: the Iran Conflict’s biofuel demand channel (raising soybean oil demand through blending mandates when oil prices rise) and El Niño’s expected supply suppression channel (reducing palm oil yields in Southeast Asia and oilseed output in South Asia).
- – Evidence for large El Niño impacts on global grain markets (wheat, corn, soybeans broadly) is more mixed. Argentina typically experiences above-normal rainfall under El Niño, partially offsetting losses elsewhere. We caution against extrapolating from the vegetable oil case to broad cereal market disruption.
- – Palm oil and oilseed supply consequences accumulate with a 6–24-month lag after the stress event; a peak in late 2026 positions 2027 as the more significant year for agricultural supply impacts. The U.S. 2026 crop season is largely past the window of direct El Niño production risk, consistent with our earlier analysis in Brief #2026-6.
- – Key monitoring indicators: NOAA CPC monthly ENSO updates (www.cpc.ncep.noaa.gov); Malaysian Palm Oil Board (MPOB) production data; India Meteorological Department monsoon progress reports; IRI model plume updates (iri.columbia.edu).
I. Introduction: Building on Brief #2026-6
Extension Brief #2026-6 (Foster, Dalheimer, and Keeney, 2026) identified an intensifying El Niño as a key wildcard for 2026–27 commodity markets, while noting that forecast uncertainty remained substantial through the spring predictability barrier — the period of historically lowest ENSO forecast skill. That barrier has now been crossed. The June 2026 CCSR/IRI model ensemble and IRI’s June 2026 QuickLook indicate an ENSO situation materially stronger than was projected in April. This brief updates that assessment, focusing specifically on the commodity channels where evidence of El Niño’s impact is strongest and where the intersection with the Iran Conflict’s agricultural effects creates the most analytically consequential interactions.
Throughout, we follow the analytical calibration of Ubilava (2012, 2014, 2018), whose published research has documented the ENSO–commodity price relationship across multiple markets and has noted that, even in the current exceptional forecast environment, global commodity market impacts for most commodities are likely to be limited, with vegetable oils representing the primary exception. We treat that calibration as an organizing principle.
II. A Materially Stronger ENSO Signal
Three developments since Brief #2026-6 have materially changed the ENSO assessment. First, the spring predictability barrier has been crossed. The ENSO forecast skill historically reaches its lowest point in the April–May window; forecasts issued after this period are substantially more reliable. Second, the June 2026 CCSR/IRI model plume (Figure 1) shows an exceptional degree of model consensus: essentially all dynamical and statistical models project continued El Niño intensification through the remainder of 2026, with a dynamical model average peak near 2.5–2.6°C in the September–November 2026 season. In the words of Ubilava (LinkedIn, June 2026): “I don’t think climate models have ever been so ‘bullish’ about upcoming El Niño as they are now… It’s not just that all models agree, but that on average they think it is going to be the strongest on record.”
For context, the strongest El Niño events in the modern instrumental record reached Niño3.4 anomalies near 2.5°C (1997–98 and 2015–16). Current ensemble projections place the expected peak in that range or above on many individual model members. The probability of a “very strong” event, formally defined as exceeding 2.0°C in peak Niño3.4, is high under current forecasts.
Third, the subsurface ocean heat content signal is exceptional. The IRI’s May 2026 Technical Update documents that subsurface temperature anomalies in the central–eastern equatorial Pacific are more than twice those observed during the same period in mid-May 2023 — itself a significant El Niño year — representing a substantial heat reservoir available to sustain and intensify developing conditions (IRI, 2026). The Southern Oscillation Index, which is a pressure-based index with negative values indicating El Niño conditions, fell sharply to −11.2 in April 2026 and further to −14.5 in May, reflecting the atmospheric coupling characteristic of a developing, self-reinforcing event.
Figure 1
CCSR/IRI Model Predictions of Enso from Jun 2026
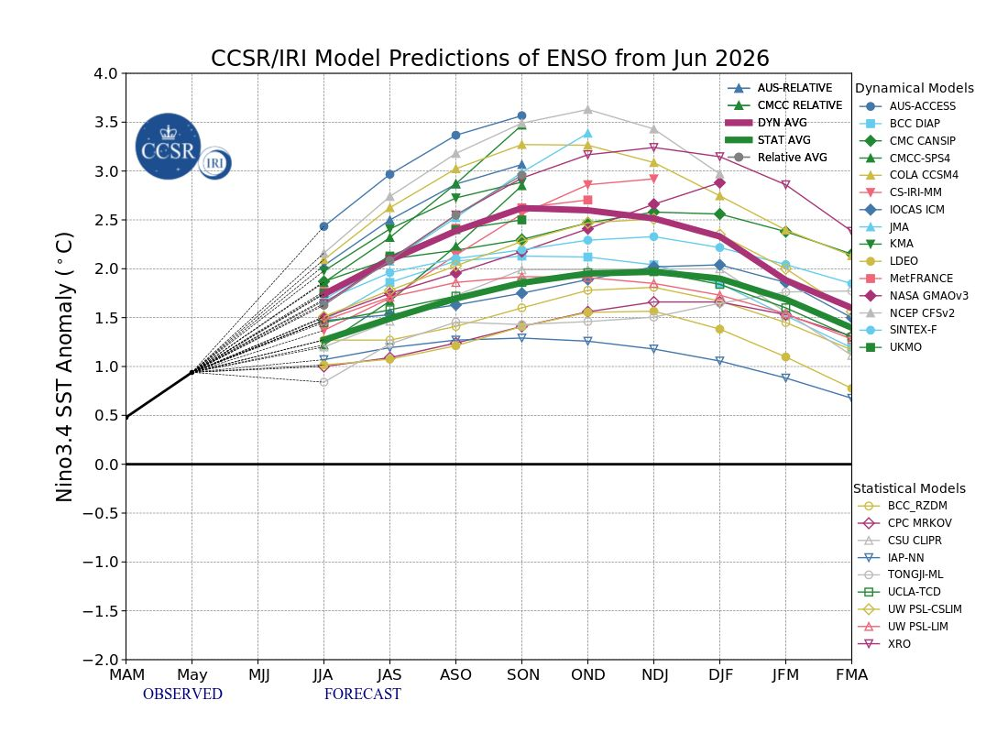
CCSR/IRI Model Predictions of the Niño3.4 Sea Surface Temperature Anomaly from June 2026.
Source: Download from the CCSR/IRI ENSO Forecast, June 2026. International Research Institute for Climate and Society (IRI) and Center for Climate System Research (CCSR), Columbia University. The forecast plume shows individual dynamical and statistical model predictions of the Niño3.4 SST anomaly (°C) from the observed May 2026 value through early 2027, along with dynamical and statistical model
However, even though strong model consensus after the spring barrier is more reliable than before it, the spatial expression of El Niño’s rainfall anomalies across affected regions remains uncertain. Historical events of comparable Pacific intensity have varied considerably in their regional footprint. The directional signal is well established, while the spatial magnitude is not.
III. The Vegetable Oil Channel: Where the Evidence Is Strongest
The academic literature on ENSO and commodity prices consistently identifies vegetable oils as the class most reliably affected by El Niño. Ubilava and Holt (2013) document that El Niño leads to price increases in palm oil, soybean oil, and other vegetable oils. This is the most robustly replicated finding in the ENSO–food price literature across multiple methodological approaches.
The primary mechanism runs through Southeast Asia. Indonesia and Malaysia together account for roughly 90 percent of global palm oil supply. El Niño reduces rainfall in these regions, reducing fresh fruit bunch yields. Critically, the yield impact builds over a 6–24-month lag following the stress event (Kamil et al., 2024), meaning that palm oil production consequences from the June–September 2026 drought stress window will not fully express until 2027. Commodity futures markets price expected future supply in advance, however, so the production risk is already transmitting into forward prices.
Soybean oil’s link to El Niño is indirect but consequential. Ubilava (2018) documents that soybean prices show a modest negative response to El Niño, but soybean oil prices follow a pattern similar to that of other major vegetable oils. The mechanism is substitution between vegetable oils. As palm oil supply decreases, vegetable oil prices increase across the board, particularly soybean oil, which is the primary substitute in food and biodiesel.
India’s monsoon-season oilseed crops — groundnuts, rapeseed, and soybeans planted June–September — face direct yield risk from El Niño’s suppression of the South Asian monsoon. Below-normal monsoon onset would reduce planted area and yields, increasing Asian import demand for vegetable oils and amplifying the palm oil price signal.
Figure 2 shows the current agricultural exposure calendar for key crop systems. Australia’s winter wheat is now being planted under developing El Niño conditions; India’s monsoon season is beginning; and Southeast Asia’s palm oil is beginning to accumulate drought stress. The Argentine soybean crop, which typically benefits from El Niño’s wetter conditions in southern South America, is still months from planting; its partial offsetting effect will emerge later in the cycle.
One potentially moderating factor worth monitoring is the possibility that elevated fuel and fertilizer costs, together with the relative price signals now emerging from vegetable oil markets, may induce some farmers — in Australia, the United States, and South America — to shift acreage toward oilseeds and away from more input-intensive grain crops such as wheat and corn. To the extent such rotations occur, they would add oilseed supply and partially offset the El Niño-driven supply suppression described above, though any meaningful acreage response would need to be substantial to counter a strong production shock and would itself be contingent on whether planting-season conditions allow.
IV. The Convergence: Two Independent Shocks in the Same Market
The analytical contribution of this brief is to identify the convergence of two simultaneously operating, independently motivated pressures on global vegetable oil markets (Figure 3).
The first channel runs through the Iran Conflict. As documented in Extension Briefs #2026-2 and #2026-9, elevated crude oil prices have strengthened the economics of biodiesel and renewable diesel. The EPA’s March 2026 finalization of the “Set 2” RFS rule established record biomass-based diesel volume obligations requiring an estimated 60 percent increase in domestic biodiesel and renewable diesel production relative to 2025 (Foster, Dalheimer, and Keeney, 2026). Soybean oil is the primary domestic feedstock for these fuels. The mandates are legally binding and operate entirely through domestic crush markets, insulated from export tariff dynamics. They represent a structurally elevated demand signal that would persist into 2027, regardless of conflict resolution, given regulatory timelines.
The second channel runs through El Niño. Palm oil yield suppression in Southeast Asia, Indian oilseed supply reduction from monsoon disruption, and the resulting vertical price transmission to soybean oil constitute an independent supply-side constraint on the same vegetable oil complex. These two forces — demand driven by policy and conflict, supply constrained by climate — are operating simultaneously and in the same direction. In commodity markets, when independent demand and supply shocks align directionally, their effects are generally additive. Iizumi et al. (2014) document that multi-shock episodes are when supply-demand imbalances are most acute and most persistent.
Figure 2
Agricultural Exposure Calendar: Key Crop Systems and El Niño Risk, June 2026–June 2027
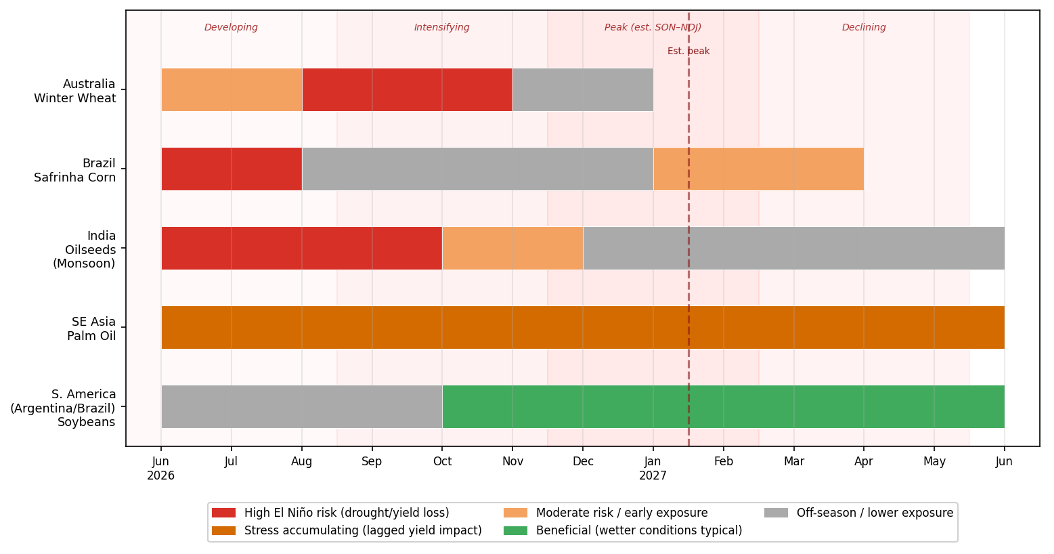
Colors indicate degree of El Niño-related risk: red = high drought or yield-loss risk; orange = stress accumulating with lagged yield impact; light orange = moderate or building risk; green = typically beneficial (wetter conditions); gray = off-season or lower exposure. Background shading indicates approximate El Niño intensity phase based on the current CCSR/IRI forecast trajectory.
Source: Authors’ compilation based on ENSO regional teleconnection literature, crop calendar data, and IRI/NOAA ENSO forecast (June 2026).
The partial offset is Argentina. El Niño typically delivers above-normal rainfall across southern South America during the October–March soybean-growing season, supporting Argentine soybean yields and increasing global availability of soybean oil from the Southern Hemisphere. This could be a meaningful counterweight. However, the scale of palm oil supply at risk — concentrated in Indonesia and Malaysia, which together produce roughly 90 percent of world palm oil — means that even with an Argentine supply boost, the net global vegetable oil balance is likely to tighten in 2026–27.
V. Grains: A More Muted Story
Consistent with Ubilava’s assessment that global commodity impacts for most commodities other than vegetable oils are likely to be limited, the evidence on grain market effects is considerably more mixed and should be interpreted with caution.
The global crop yield literature suggests heterogeneous effects across grains. Cao et al. (2023) find, using historical ENSO data, that El Niño reduced global mean wheat yields by approximately 1.33 percent and maize yields by approximately 0.37 percent, but increased global soybean yields by approximately 1.9 percent on average — a figure that reflects the South American benefit. Iizumi et al. (2014) similarly document significant adverse impacts on wheat yields in parts of Australia, China, and Mexico, leading to price increases, while noting that effects on major producing regions vary by event.
For the 2026 U.S. crop specifically, Brief #2026-6 established that the growing season calendar largely insulates U.S. corn, wheat, and soybeans from direct El Niño production risk. The 2026 crops, in the U.S., will be substantially harvested before El Niño approaches its projected peak intensity. The ENSO influence during corn pollination in late July and early August will derive from a developing, not a fully established, event — and developing-phase effects on the U.S. Corn Belt are considerably weaker and less spatially predictable than mature-phase effects. The historical analog of 2009, a year when a developing El Niño produced broadly favorable Corn Belt conditions, is instructive. There is evidence that El Niño events impact U.S. yield distributions in the subsequent years (Tack & Ubilava, 2013 and 2015).
Figure 3
Converging Pressures on Global Vegetable Oil Markets, 2026–27
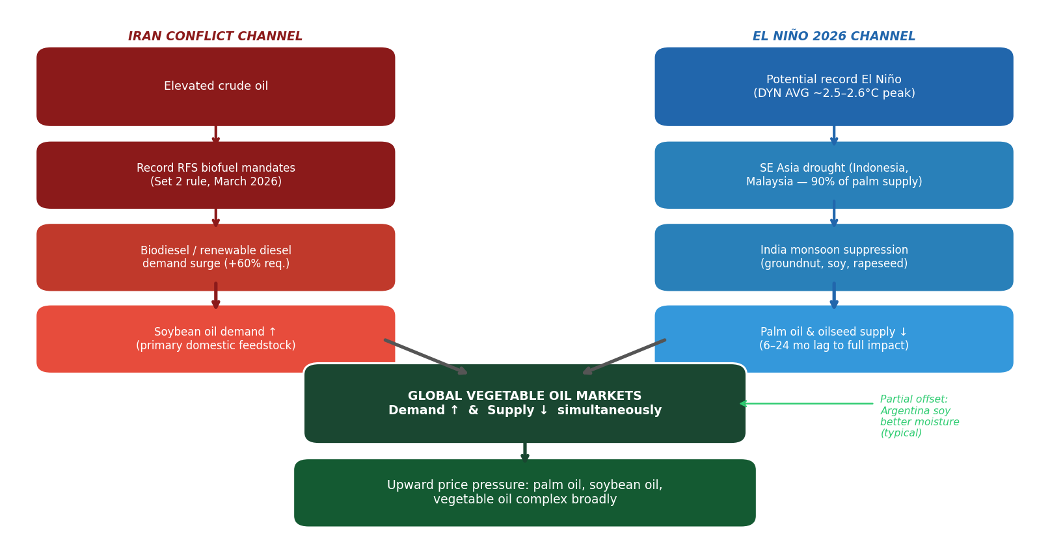
Left chain: Iran Conflict demand channel (elevated crude oil, RFS Set 2 mandates, soybean oil demand increase). Right chain: El Niño supply suppression channel (Southeast Asia palm oil drought, India monsoon suppression, vegetable oil supply decrease). Both channels independently drive upward price pressure on the vegetable oil complex; Argentina’s typically beneficial El Niño rainfall provides a partial offset (right).
Source: Authors’ analysis based on Foster, Dalheimer, and Keeney (2026); Ubilava and Holt (2013); Kamil et al. (2024); IRI ENSO Forecast (June 2026); U.S. Environmental Protection Agency (2026).
For Australia’s winter wheat — the most clearly exposed grain system in the near term — historical strong El Niño events have produced wheat yield declines of 20–40 percent in affected growing regions. This would tighten world wheat markets and modestly redirect import demand toward U.S. and South American supplies, providing some export revenue benefit that partially offsets U.S. producers’ input cost pressures. The production outcome will be largely determined by the August–October growing season under continuing El Niño conditions.
A record-strength El Niño, if it materialized with full expression simultaneously across all historically affected regions, would produce larger-than-average supply reductions in grains. The evidence does not support treating simultaneous full impact as the central expectation; rather, it is a meaningful tail risk — one with a higher probability than in a normal year but not the most likely outcome for any individual region.
VI. What to Watch
NOAA Climate Prediction Center ENSO updates (monthly). The CPC’s monthly ENSO Diagnostic Discussion (www.cpc.ncep.noaa.gov) provides the most authoritative public assessment of El Niño’s development. The June and July 2026 updates are critical for assessing whether intensification continues at its current pace and whether it peaks near an all-time high by the end of the year.
Malaysian Palm Oil Board (MPOB) monthly production data. The MPOB releases monthly statistics on Malaysian palm oil fresh fruit bunch and production. Declining yields in the July–October window would be the first data signal that El Niño is translating into actual supply suppression rather than remaining a forecast risk.
India Meteorological Department monsoon progress. The IMD issues regular monsoon onset and progress reports. Below-normal monsoon onset or cumulative deficit conditions in June–July would signal elevated oilseed production risk for India and increased import demand.
IRI model plume updates. The IRI’s monthly model plume (iri.columbia.edu) provides the best multi-model view of forecast evolution. Continued projection of 2.5°C or above would reinforce the strong-event scenario; any weakening or narrowing of the envelope toward lower values would reduce the severity of the impacts described above.
Soybean oil and palm oil futures markets. Near-term futures prices in Chicago (soybean oil) and Bursa Malaysia (palm oil) are already incorporating El Niño supply risk expectations. A widening premium in longer-dated contracts relative to near-term would signal those markets are pricing increasingly serious production risk into the forward curve.
VII. Bottom Line
The ENSO situation has materially strengthened since Brief #2026-6. A potential record El Niño is now forecast with high model consensus; the spring predictability barrier has been crossed; and we are within the critical agricultural windows for the most exposed crop systems. The most evidence-supported effects may be expected in vegetable oil markets, where palm oil is directly threatened through droughts potentially unfolding in Southeast Asia, and soybean oil is exposed through both direct El Niño impacts in soy-producing regions and vegetable oil price transmission. At the same time, high crude oil prices and U.S. policy incentivize biofuel blending, exacerbating demand for vegetable oils and thereby adding even more upward pressure on prices.
These forces are operating simultaneously and in the same direction in global vegetable oil markets, creating a supply-demand configuration that adds up both forces. We conclude that global grain market impacts, while directionally adverse in several key regions, are likely to be more modest in aggregate and are partially offset by typically above-normal production in Argentina.
The 2027 agricultural supply horizon deserves close attention: palm oil yield suppression accumulates over months, Australia’s 2026–27 marketing-year wheat crop is being planted now under developing El Niño conditions, and the full global oilseed supply consequences may not peak until El Niño’s lagged effects work through. The vegetable oil complex is the market segment most deserving of sustained monitoring in the months ahead — and its dynamics carry direct food security implications for the populations that rely most heavily on affordable vegetable oils as a dietary staple and for farmers producing for those markets.
References
Cao, J., Zhang, Z., Tao, F., Chen, Y., Luo, X., and Xie, J. (2023). “Forecasting global crop yields based on El Niño Southern Oscillation early signals.” Agricultural Systems, 205, 103564. https://doi.org/10.1016/j.agsy.2022.103564
Foster, K., and Dalheimer, B. (2026). “The Iran Conflict and Consumer Food Prices: A Broad but Lagged and Sticky Shock.” Extension Brief #2026-2. Purdue Agricultural Economics Report. https://ag.purdue.edu/commercialag/home/paer-article/the-iran-conflict-and-consumer-food-prices-a-broad-but-lagged-and-sticky-shock
Foster, K., Dalheimer, B., and Keeney, R. (2026). “Commodity Prices at the Crossroads: Trade Policy, the Iran Conflict, and the 2026 U.S. Grain Markets.” Extension Brief #2026-6. Purdue Agricultural Economics Report. https://ag.purdue.edu/commercialag/home/paer-article/commodity-prices-at-the-crossroads-trade-policy-the-iran-conflict-and-the-2026-u-s-grain-markets
Foster, K., and Dalheimer, B. (2026). “The April 2026 CPI and PPI Reports: The Food Price Pipeline Is Opening.” Extension Brief #2026-9. Purdue Agricultural Economics Report. https://ag.purdue.edu/commercialag/home/paer-article/the-april-2026-cpi-and-ppi-reports-the-food-price-pipeline-is-opening-purchasing-power-under-pressure-for-second-consecutive-month
International Research Institute for Climate and Society (IRI). (2026, May 19). ENSO QuickLook and Technical ENSO Update. Columbia University. https://iri.columbia.edu/our-expertise/climate/forecasts/enso/current/
IRI / CCSR. (2026, June). CCSR/IRI Model Predictions of ENSO from June 2026 [forecast plume graphic]. International Research Institute for Climate and Society, Columbia University / Center for Climate System Research. https://iri.columbia.edu/our-expertise/climate/forecasts/enso/current/
Iizumi, T., Luo, J., Challinor, A.J., Sakurai, G., Yokozawa, M., Sakuma, H., Brown, M.E., and Yamagata, T. (2014). “Impacts of El Niño Southern Oscillation on the global yields of major crops.” Nature Communications, 5, 3712. https://doi.org/10.1038/ncomms4712
Kamil, N.N., Xiao, S., Syed Salleh, S.N., Xu, H., and Zhuang, C.C. (2024). “Nonlinear impacts of climate anomalies on oil palm productivity.” Heliyon, 10(16), e35798. https://doi.org/10.1016/j.heliyon.2024.e35798
NOAA Climate Prediction Center. (2026). ENSO Diagnostic Discussions (monthly). National Oceanic and Atmospheric Administration. https://www.cpc.ncep.noaa.gov
Tack, J. and Ubilava, D. (2013). “The effect of El Niño Southern Oscillation on U.S. corn production and downside risk.” Climate Change, 121(4): 689-700. 10.1007/s10584-013-0918-x
Tack, J. and Ubilava, D. (2015). “Climate and agricultural risk: measuring the effect of ENSO on U.S. crop insurance.” Agricultural Economics, 46(2): 245-257.
https://doi.org/10.1111/agec.12154Ubilava, D. (2012). “El Niño, La Niña, and world coffee price dynamics.” Agricultural Economics, 43(1), 17–26. https://doi.org/10.1111/j.1574-0862.2011.00562.x
Ubilava, D. (2014). “El Niño Southern Oscillation and the fishmeal–soybean meal price ratio: regime-dependent dynamics in the aquaculture feed market.” European Review of Agricultural Economics, 41(4), 583–604.
Ubilava, D. (2018). “The role of El Niño Southern Oscillation in commodity price movement and predictability.” American Journal of Agricultural Economics, 100(1), 239-263. https://doi.org/10.1093/ajae/aax060
Ubilava, D. (2026, June). Commentary on ENSO forecast models. LinkedIn post. University of Sydney.
Ubilava, D., and Holt, M.T. (2013). “El Niño Southern Oscillation and its effects on world vegetable oil prices: assessing asymmetries using smooth transition models.” Australian Journal of Agricultural and Resource Economics, 57(2), 273–297. https://doi.org/10.1111/j.1467-8489.2012.00616
U.S. Environmental Protection Agency. (2026, March 27). Renewable Fuel Standard (RFS) Program — Standards for 2026 and 2027: Final Rule (“Set 2”). Federal Register; effective June 15, 2026. https://www.epa.gov/renewable-fuel-standard/final-renewable-fuel-standards-2026-and-2027