The July 2026 CPI and PPI Reports: The Energy Shock Bypasses the Food Pipeline
August 20, 2026
PAERPB-2026-13
Bernhard Dalheimer, Assistant Professor of Macroeconomics and Trade; Ken Foster, Professor of Agricultural Economics and Director, Purdue Farm Policy Study Group


Energy prices are 14.7 percent above year-ago levels, and yet the raw agricultural commodities that sit at the head of the food pipeline are cheaper than they were last July. That combination is the whole story of this month’s release — but it is not evidence that the energy shock missed agriculture. It is evidence of where the shock landed: on the cost side of the farm budget rather than on farm-gate prices, and on the eighty-four cents of the retail food dollar that never reaches the farm. Food prices are moving, in some categories dramatically, but they are not moving because of the energy shock. They are moving because of chicken, eggs, cattle herds, and coffee. As we read a 14.7% energy number and worry about a food-price wave, we should look at what the food data are actually doing before drawing conclusions.
Energy Landed on Costs, Not on Farm-Gate Prices
Whether an energy shock is propagating into agriculture is not settled by asking whether farm-gate prices rose alongside it. Raw commodity prices are set by supply and demand for the commodity itself, not by what it cost to produce. With the crop already in the ground and the herd already on feed, short-run supply is close to fixed, and a rise in fuel or fertilizer costs cannot be passed forward the way a processor passes along a packaging cost. It shows up instead in net returns. Falling farm prices alongside rising energy costs are therefore not evidence that the shock missed agriculture. It is evidence that agriculture must absorb it in the short run.
We are currently in the later stages of crop production, and short-run supply is highly inelastic and fixed, so it is unsurprising to see no pass-through of energy into raw agricultural commodity prices. The cost side of the farm budget carries the shock plainly. Over the twelve months ending in July, nitrogenates rose 47.3 percent and phosphates 8.2 percent, with agricultural chemicals and chemical products up 11.4 percent as a group — the natural-gas-to-ammonia channel that earlier briefs in this series identified in the spring, still open. No. 2 diesel fuel is up 44.2 percent over the year, processed fuels and lubricants sold to nonmanufacturing industries — the category that includes farm fuel — are up 22.3 percent, and truck transportation of freight is up 10.9 percent. What has changed is the monthly direction rather than the level: diesel fell 6.7 percent in July, and farm fuels fell 4.0 percent. The pressure is easing, not accumulating, but it is not gone. If closure of the Strait of Hormuz continues into the fall, then 2027 agricultural supply may be impacted.
CPI energy rose 14.45% year-over-year on a seasonally adjusted basis (14.73% not seasonally adjusted), while PPI farm products — the index of what farmers actually receive for raw commodities — declined on both a monthly and annual basis, in all likelihood a result of continued tariffs and good growing conditions. Unprocessed foodstuffs and feedstuffs are down 1.52% year-over-year; processed foods and feeds are up only 1.13%. Energy is not, on this evidence, the marginal driver of farm-gate prices right now as one would expect mid-production season for crops. 2026 production cannot be substantially altered in response to energy or energy-related input costs.
The second piece of evidence points the same way. Stage 1 intermediate demand, the most upstream stage of the producer price pipeline, is running above year-ago levels. Taken alone, that is an alarming number to see sitting at the top of production chains. But Stage 1 is a broad basket of raw industrial and agricultural inputs, and we know from the farm products index that the agricultural component of it is falling, and food inputs to Stage 1 are up only 5.9% over the year. Whatever is generating a near-double-digit upstream print is coming from the non-food side of that basket, in particular, energy and industrial materials and not from the commodities that become groceries. Over the twelve-month window, the upstream surge is substantial and largely non-agricultural in origin, though the July move ran the other way: food inputs to Stage 1 rose 7.8 percent in the month, after a strong decline in June, while energy inputs fell 4.2 percent. The individual product stories, such as tight coffee and beef supplies, continue to dominate the food price landscape.
The Pipeline’s Stages Have Split — and Food Split From All of Them
Figure 1
PPI Intermediate Demand, Year-Over-Year Change by Production Stage
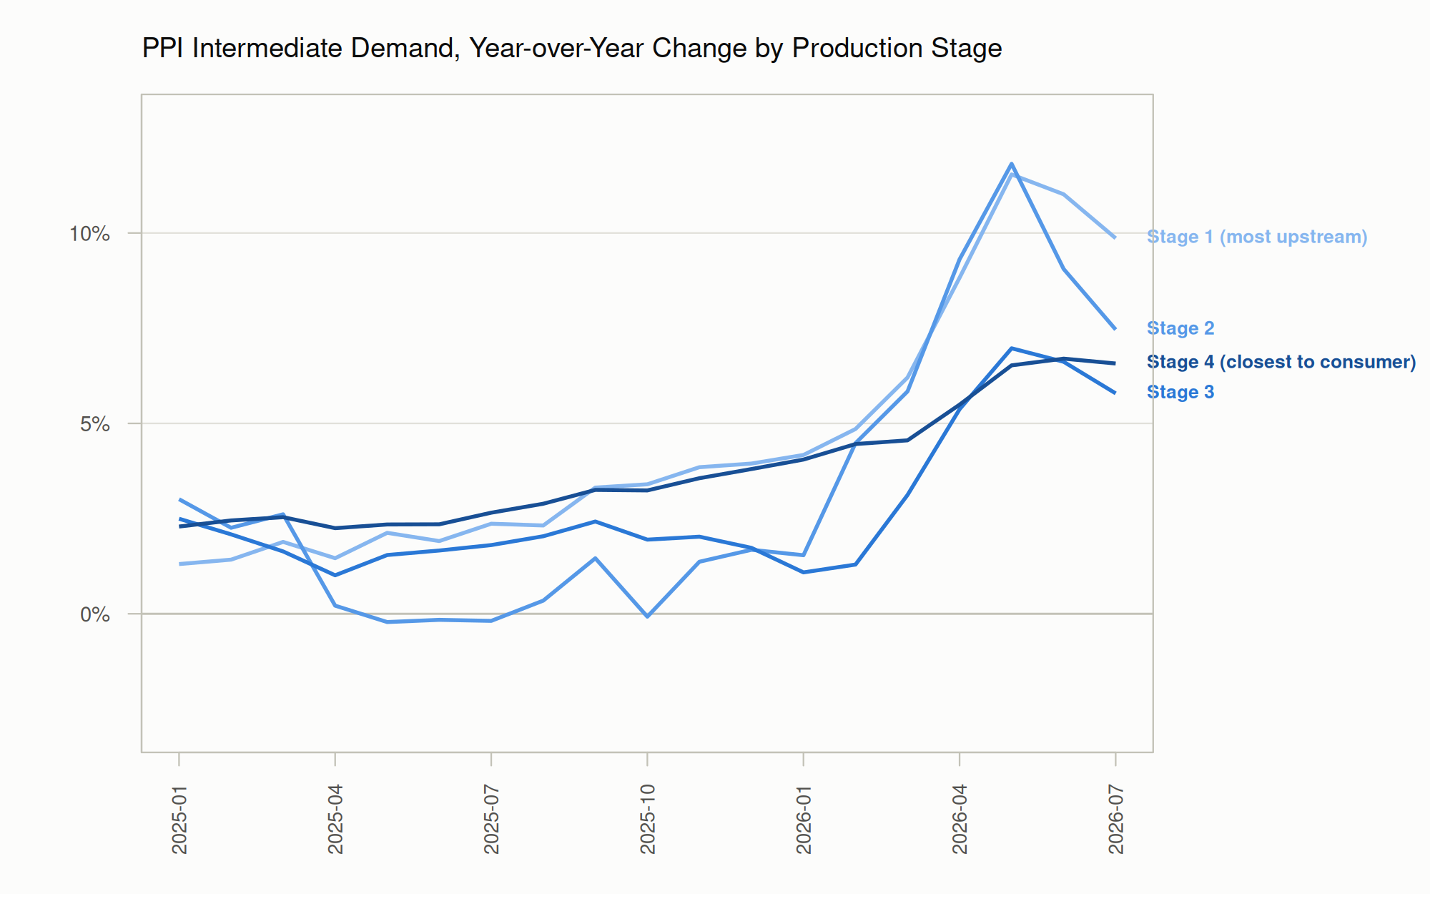
PPI intermediate demand, year-over-year change by production stage, January 2025 through July 2026. Stages 1 and 2 spiked to roughly 11–12% in the spring before cooling toward 8–10% by July, while Stages 3 and 4 climbed more gradually and Stage 4 has yet to turn over.
Figure 1 shows a pipeline that no longer moves as one body. Stages 1 and 2 peaked near 12% in the February-to-May window and have been unwinding since; both fell month over month in July, with Stage 2 down 0.97%. Stage 3 never spiked as hard and has been the steadiest of the four, at 5.79% year over year. Stage 4 — the stage closest to the consumer — tells a different story: it rose gradually across the entire period rather than spiking; it has not clearly peaked; and in July it was the only stage still gaining monthly momentum, up 0.60% month-over-month and 6.57% year-over-year. That is the shape we would expect from a cost shock that entered upstream months ago and is now working its way through to finished goods.
Here is the part that matters for food. In the same month that the broad Stage 4 index accelerated, PPI final demand foods fell by 0.1 percentage points and now sits 0.9% below year-ago levels. Meanwhile, final demand goods less food and energy rose 0.13% on the month and 4.91% on the year. The food lane of the pipeline is running against traffic. Whatever is pushing finished-goods producer prices higher — and something clearly is — food is not part of it. Labor is one place where cost pressure remains genuine: food manufacturing average hourly earnings rose 0.42% in the month and 4.25% over the year, ahead of the 3.15% total private pace. That pressure is significant, but it is landing on processor and retailer margins rather than showing up in what processors are receiving for finished food.
Strong Movements in Food, and No Common Cause
Figure 2
CPI Food Categories: Strong Movements, Year-Over-Year (July 2026)
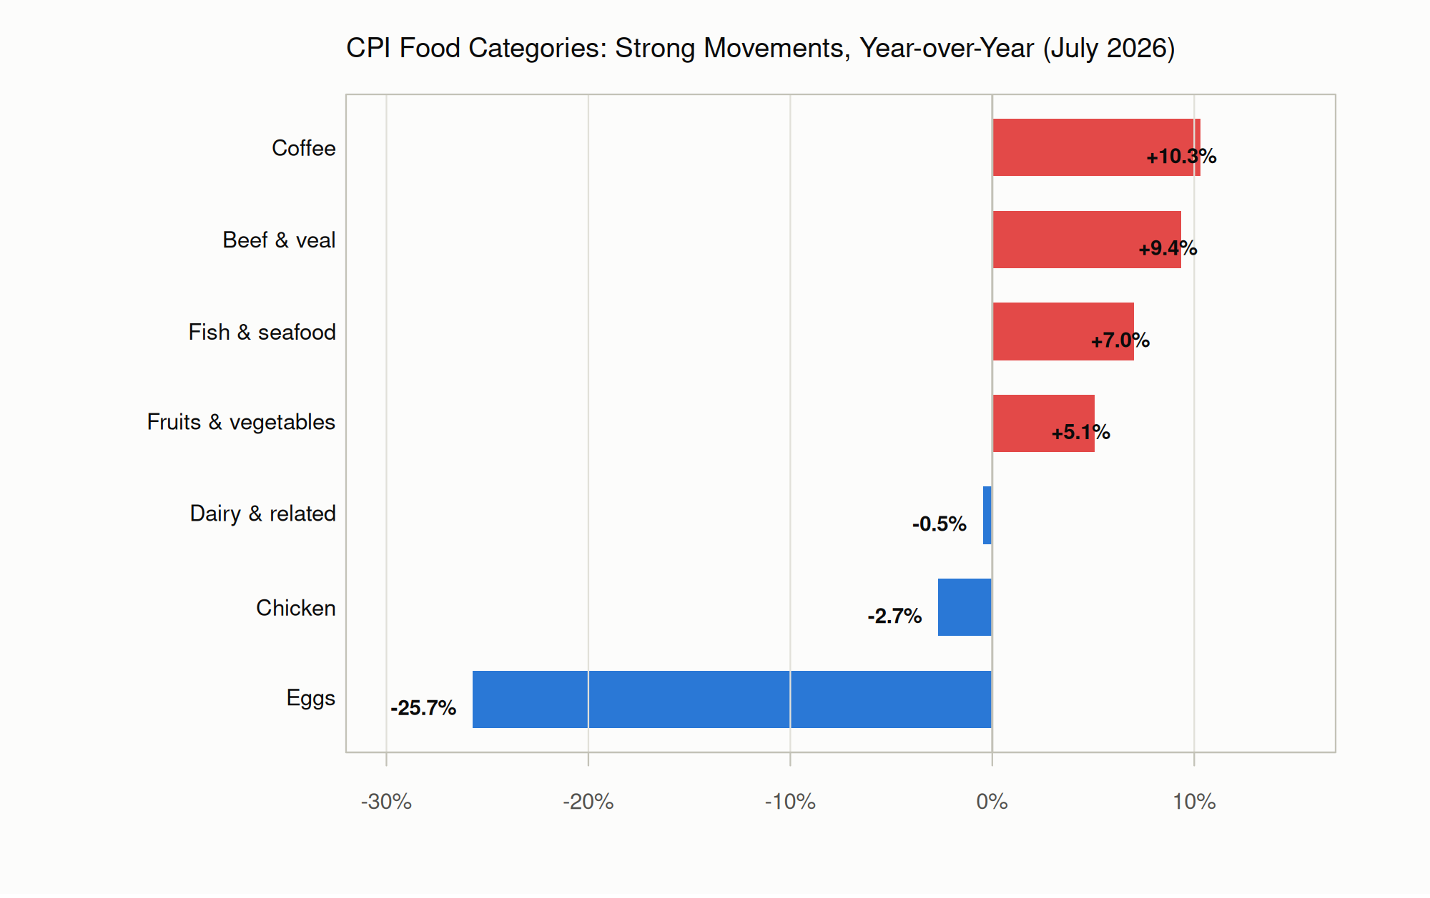
CPI food categories with the strongest year-over-year movements, July 2026. The spread runs from eggs at −25.7% to coffee at +10.3%, roughly 36 percentage points separating the extremes of a single month’s food basket.
If a shared macro cost shock were driving food prices, categories would move together, scaled roughly by how energy- and input-intensive each one is. Figure 2 shows nothing of the kind. The dispersion in July is about 36 percentage points wide, and each end of it has its own well-documented cause.
Eggs, −25.7% year-over-year. The deepest decline in the basket, and a continuation of the flock rebuild following the avian influenza losses. Layer capacity is being restored, and prices are normalizing against an extraordinary year-ago base.
Beef and veal, +9.37%. The second largest increase in the food basket, and still climbing month-to-month at +0.22%. Multi-year cattle herd contraction has tightened supply, and herd rebuilding is slow by construction — heifers retained for breeding are heifers not sent to slaughter, which tightens supply further before it loosens.
Coffee, +10.32%. The largest annual mover, driven by origin supply conditions and trade frictions rather than domestic cost pass-through. Nonalcoholic beverages overall are up 4.11%, with coffee doing most of that work.
Fish and seafood, +7.01%, up 0.44% in the month — an import-heavy category with its own trade and harvest story.
Chicken, −2.67%, and poultry more broadly at −0.48%, both falling on the month. Poultry supply has recovered where eggs have; the two are moving together for the same reason.
Dairy, −0.46%, down 0.13% in the month. Milk supply is comfortable, and dairy is one of the more energy- and transport-intensive categories in the store — which makes its softness a direct rebuttal to the energy pass-through story.
Fruits and vegetables, +5.06%, but down 0.15% in the month, with the annual figure reflecting earlier growing-season and import conditions rather than fresh pressure.
Aggregate meats, poultry, fish, and eggs came in at +1.88% year-over-year and −0.10% on the month. That composite conceals a 35-point internal range. Food at home, overall, was essentially flat in July, down 0.07%, and up 2.68% on the year; food away from home rose 0.31% and is up 3.40%, still carrying more labor cost than grocery shelves do.
It is worth being explicit about what this does and does not revise in our earlier briefs. First, those briefs argued that the conflict-driven energy shock would reach consumer food prices with a lag of roughly three to six months and would do so mainly through processing, packaging, freight, and retailing rather than through the farm gate. Second, the briefs also made the case that this exposure to energy is relatively small compared with regular demand- and supply-side shocks that dominate agriculture and food sectors. The July data are consistent with these arguments, and they sharpen them in one respect. The transmission was real and is still visible in input costs, but it was never large enough to organize the food basket. The categories moving most in July move for reasons that have nothing to do with fuel: a layer flock rebuilding after avian influenza, a cattle herd in the tightest phase of its cycle, coffee origin conditions and trade frictions, and a fresh-vegetable market disrupted by a food-safety event. Energy has been one input among several, and the dispersion in Figure 2 indicates it has not been the organizing one.
Energy is Carrying the Headline While the Core is Calm
All items rose 0.07% in July and stand 3.40% above year-ago levels. Core CPI (all items less food and energy) rose 0.22% on the month and 2.47% over the year. The gap between the two tells us where the headline is coming from, namely energy, and almost exclusively energy, which, despite its towering annual figure, actually fell 1.48% in July on a seasonally adjusted basis. Underneath that, the disinflation that began earlier in the year is intact. PPI final demand was effectively unchanged at −0.03%, though it remains 4.66% above last July.
What is more, headline CPI accelerated sharply after the U.S.-Iran conflict disrupted energy markets earlier this year, peaking at 4.2% in May. Now it has eased for two consecutive months since, to 3.5% in June and 3.4% in July. July’s year-over-year energy comparison is still measured against a base month from before that shock, which is most of why the annual figure remains elevated even as the monthly trend has reversed. On the evidence in these two reports, this is not a fresh energy shock arriving in July, but the last stretch of a shock already explained, moving out of the twelve-month window as the spring run-up rolls out of the comparison. That conclusion carries a caveat the reports themselves impose. Crude moved substantially after mid-month, and neither release is positioned to register it: the PPI reference date was July 14, and CPI collection was already well advanced. Both series are therefore describing an early-July trough. Whether the easing shown here continues or is interrupted will not be visible until the August reports and depends on ongoing conditions in the Strait of Hormuz.
The rest of the economy is cooling alongside it, not just prices. Nonfarm payrolls unexpectedly fell 23,000 in July even as private employers added 30,000. The Federal Reserve held its benchmark rate at its late-July meeting by a 9-3 vote, and futures markets now price roughly 62% odds of another hold in September, up from 54% before the CPI release. Wage growth, running near 3.15% for July, is still behind the 3.4% headline rate but has moved ahead of the 2.5% core rate. The household squeeze hasn’t ended, but has stopped worsening on the measure that excludes food and energy.
How to Read These Numbers
Monthly changes here are seasonally adjusted, since the seasonal pattern in food and energy would otherwise dominate month-to-month comparisons; year-over-year changes are reported not seasonally adjusted, following the convention, because comparing the same month across years already nets out most seasonality. Where we cite both, we say so. The two releases capture the month differently, and for an energy question the difference matters. CPI prices are collected across the whole month, so a move in the last week of July enters the July index only at the end of the collection period and with little weight; most of it lands in August. PPI is stricter. Reported prices are effective on the Tuesday of the week containing the thirteenth day of the month — July 14 this year — so anything that happened in the back half of July is not in this producer price report at all. The July PPI is, in effect, a snapshot of mid-month conditions, and the July CPI is a month-long average weighted toward the same period. Both are constraints when the question is how fast an energy shock transmits. And one month is one month. The decoupling argued here rests on the direction of several independent series pointing the same way, not on any single July print.
What Would Change This Read
The open question is whether food has now processed the initial oil shock episode or merely lagging it. The lag hypothesis is not unreasonable, as fuel and freight costs take only months to work through contracts, and Stage 4 has not yet turned over, while fertilizer-driven effects might follow even at later stages. The reading here would be confirmed by farm input costs continuing to ease — fertilizer and diesel rolling over on a monthly basis — while farm receipts stabilize, which would mark the margin squeeze as having passed its worst. It would be complicated by the opposite pattern: input costs re-accelerating while receipts stay soft, which would extend the squeeze into the fall marketing season. Note that farm-gate prices turning up would not by itself indicate that a cost shock had “reached the farm gate,” since output prices respond to supply and demand rather than to costs; the place to watch for the shock is the input side, and the place to watch for its consequences is net returns. The August CPI and PPI reports, due September 11 and September 10 respectively, will be the first to capture late-July energy prices in full, and will therefore be the first clean test of whether the easing described here has continued. Watch farm products and final demand foods first. The retail categories will follow whichever way those two go.
Data Sources
U.S. Bureau of Labor Statistics. Consumer Price Index — July 2026. USDL-26-1191. Released August 12, 2026.
U.S. Bureau of Labor Statistics. Producer Price Index — July 2026. PPI Detailed Report. Released August 13, 2026.
Earlier briefs in this series: Foster & Dalheimer (2026), available at ag.purdue.edu/commercialag.