The August 2026 CPI and PPI Reports: The Late-July Energy Spike Arrives, and the Food Pipeline Still Holds
September 16, 2026
PAERPB-2026-15
Ken Foster, Professor of Agricultural Economics and Director, Purdue Farm Policy Study Group; Bernhard Dalheimer, Assistant Professor of Macroeconomics and Trade


Brief #2026-13 closed by naming a specific, falsifiable test: crude oil moved sharply after both July reports had already gone to press, and neither release was positioned to register it. The August data are that test. Energy costs surged across both reports this month — diesel fuel up 24.1 percent, gasoline up 3.9 percent — in a single month. At the same time, food inflation sat almost exactly where it sat in July, and the most upstream producer-price stage swung through a wider range than the stage nearest the consumer has moved in three months combined. A real, measurable energy shock landing squarely in the data, alongside a food pipeline that barely moved, is the sharpest evidence yet for the thesis this series has been building since spring.
The Predicted Test
Brief #2026-13 flagged a specific limitation in the July data: CPI collection was already well advanced, and PPI’s single reference date (July 14) fell before crude prices moved substantially in the back half of the month. Both releases described an early-July trough. The brief was explicit that “the August CPI and PPI reports […] will be the first to capture late-July energy prices in full, and will therefore be the first clean test of whether the easing described here has continued.”
It has not continued. CPI energy rose 2.1 percent in August after falling 1.5 percent in July, and gasoline swung from −2.9 percent to +3.9 percent — accounting for over a third of the entire monthly all-items increase on its own. On the producer side, the move is larger. Diesel fuel jumped 24.1 percent in a single month, driving more than a third of the rise in final demand goods and nearly two-thirds of the rise in processed goods for intermediate demand. PPI final demand overall accelerated to +0.4 percent in August, from +0.1 percent in July and −0.1 percent in June. This is not a new, independent shock. It is the delayed arrival, in the data, of the same late-July event Brief #13 identified but could not yet measure.
One nuance is worth mentioning. The “core” producer-price measure — final demand less foods, energy, and trade services — actually decelerated slightly to +0.3 percent in August from +0.4 percent in July, indicating that August’s PPI acceleration is concentrated in energy only.
The Pipeline’s Stages, Updated
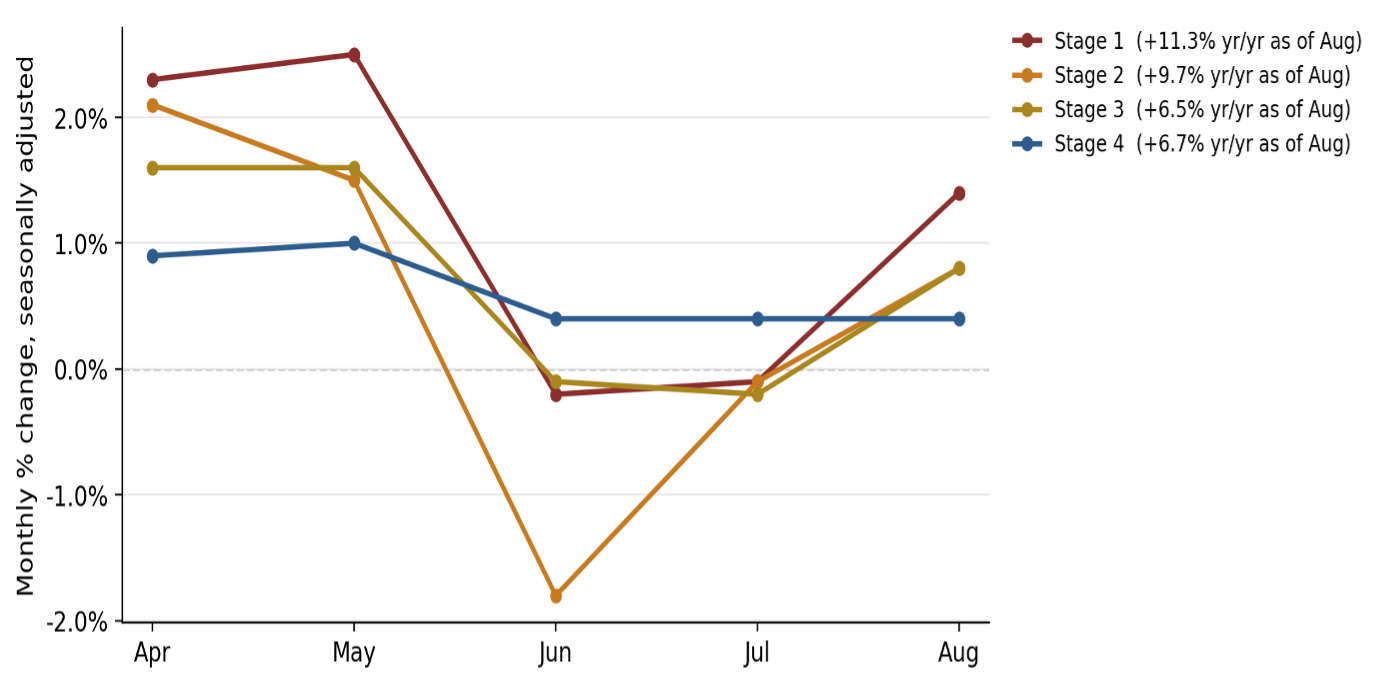
Figure 1 updates the stage-by-stage view this series has tracked since the spring. Stage 1 intermediate demand — prices for the earliest, most commodity-like inputs — swung from −0.1 percent in July to +1.4 percent in August, the sharpest reversal of any stage. Stage 2 and Stage 3 moved in the same direction, both to +0.8 percent. Stage 4, the stage closest to final demand, has now held at +0.4 percent for three consecutive months — June, July, and August — even as Stage 1 traveled through a 2.7-point range over the same window. That is the cleanest illustration yet of the dampening this series has argued for. The shock is large and immediate furthest upstream, and it is being absorbed and diluted, not transmitted, by the time it reaches the stage nearest the consumer.
Figure 1
PPI intermediate demand by production stage, monthly percent change, seasonally adjusted
Source: U.S. Bureau of Labor Statistics, PPI Detailed Report, Data for August 2026.
One qualifier on the year-over-year figures noted in the legend: Stage 4’s 12-month change (6.7 percent) has edged just above Stage 3’s (6.5 percent), a small crack in what has otherwise been a clean ordering by stage. The monthly data in Figure 1 still show Stage 4 as by far the most stable of the four, but it is worth watching whether that ordering holds up as more months of data accumulate.
Food: Still Quiet, With One Loud Exception
CPI food-at-home was unchanged in August, and food overall rose 0.1 percent — identical to July’s reading. Two straight months at that pace is itself informative: compounded over a full year, a steady 0.1 percent monthly rate works out to roughly 1.2 percent annual food inflation, well below both the current all-items rate (3.4 percent) and the pace food itself was running in the spring. The producer side tells the same story with more texture. PPI final demand foods rose just 0.1 percent in August, but that followed two consecutive monthly declines (−0.6 percent in June, −0.9 percent in July), and its 12-month change has fallen to just 0.1 percent — essentially flat, and a fraction of what it was earlier this year. Thus, it still appears that factors other than the Iran Conflict energy shock will be the important drivers of food price inflation, but a continued conflict is not helpful.
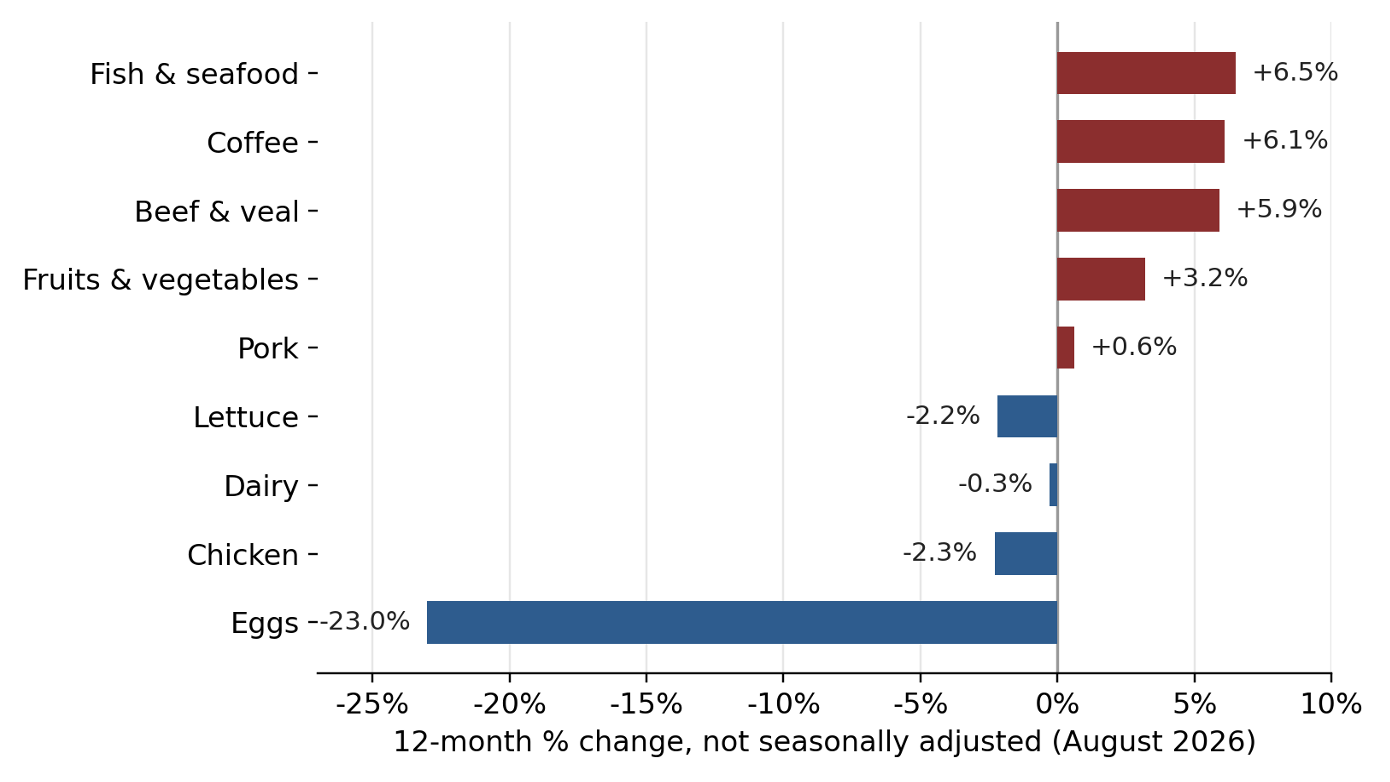
The roughly 29-point spread in Figure 2, and the fact that none of it lines up with which categories use the most energy, is itself an argument against a broad energy pass-through story. Dairy — one of the more transport- and refrigeration-intensive categories on the retail shelf — sits essentially flat at −0.3 percent even as diesel spiked 24 percent at the wholesale level. Some of that could be delayed pass-through as existing contracts expire, but each end of the range has its own well-documented cause instead.
Figure 2
CPI food categories with the strongest 12-month movements, August 2026
Source: U.S. Bureau of Labor Statistics, Consumer Price Index News Release, August 2026 (USDL-26-1496).
Eggs, −23.0 percent. Still the single largest mover in the basket, a continuing flock rebuild against an extraordinarily low year-ago base, though the index itself rose 2.9 percent in August as that rebuild normalizes.
Lettuce, −2.2 percent — the sharpest reversal in this series to date. Twelve-month lettuce inflation has gone from +32.1 percent in June to +7.5 percent in July to outright negative in August, as a cyclospora-linked demand shock and production catching up have more than erased June’s heat- and disease-driven supply decline. The monthly index is still falling (−6.2 percent in August, after −16.4 percent in July), though the pace of decline is easing, consistent with fading supply and demand shocks.
Beef and veal, +5.9 percent — decelerating fast. Twelve-month beef inflation has fallen from 11.8 percent in June to 9.4 percent in July to 5.9 percent in August, and the index itself has now declined for two straight months (−0.8 percent in July, −1.0 percent in August). This softening was already underway before the August 21 beef import waiver examined in Brief #2026-14 could plausibly show up in this data — worth watching whether the waiver adds to a cooling trend already in motion, rather than starting one. Softer demand, as consumers face falling real wages and substitute other, less expensive proteins, as well as the reopened border allowing Mexican cattle imports, likely explain much of the decline in beef price inflation.
Coffee, +6.1 percent. Continuing to ease each month (12.9 percent in June, 10.3 percent in July, 6.1 percent in August), consistent with the improving Brazilian harvest outlook discussed in earlier briefs.
Fish and seafood, +6.5 percent — the largest mover in Figure 2, and the least single-cause. Roughly 80 percent of U.S. seafood is imported, so the category is unusually exposed to trade policy. Whitefish (cod, pollock, haddock) has carried Section 301 tariffs into 2026, and a further round of tariffs, reportedly worth up to $2.9 billion, was proposed in June. Layered on top are supply constraints unrelated to tariffs — reduced Icelandic and Canadian haddock quotas and a new marine-mammal-protection import rule that took effect January 1. Plus, there is a demand story, with premium items like crab and lobster near record-high prices and with no apparent reduction in their quantities demanded.
Chicken, −2.3 percent, and pork, +0.6 percent, both remain well below the all-items pace, extending patterns discussed in prior briefs — poultry, recovering alongside layer flocks, and pork, continuing to reflect ample supply from a hog cycle that responds to price signals far faster than cattle but perhaps experiencing some price inflation due to substitution away from beef by consumers.
How to Read These Numbers
As in prior briefs: monthly changes are seasonally adjusted; 12-month changes are not, following convention. CPI prices are collected across the month; PPI prices are effective as of a single reference date, the Tuesday of the week containing the 13th — August 11 this cycle. Unlike July, this reference date falls well after the late-July oil price spike, so the August PPI is not subject to the same truncation caveat as July’s. It is a genuine read on conditions running into mid-August, not merely an early-month snapshot.
What Would Change This Read
The open question is no longer whether a fresh energy shock is visible — it is now clearly present at Stage 1 and in the August CPI energy data. The question is whether it eventually works down to Stage 4 and to food, with the three-to-six-month lag this series has argued for from the start, or whether the dampening holds the way it has for the past three months, regardless of how large the upstream swing is. This month, we’re already seeing a renewed energy price surge, with record-high diesel prices. Crude energy markets have been elevated for 6 months, and to date, the momentum suggests further increases rather than deceleration. Stage 4 and PPI final demand foods are the two series to watch first. If either accelerates meaningfully in the September data, that would be the clearest sign yet that the pipeline has started to carry this shock rather than absorb it. The September CPI and PPI reports, due October 14 and October 15, and the duration and severity of the current oil price surge will be the next tests.
Data Sources
U.S. Bureau of Labor Statistics. Consumer Price Index — August 2026. USDL-26-1496. Released September 11, 2026.
U.S. Bureau of Labor Statistics. Producer Price Index — August 2026. PPI Detailed Report. Released September 10, 2026.
Earlier briefs in this series: Dalheimer & Foster and Foster & Dalheimer (2026), available at ag.purdue.edu/commercialag.