Do Federal Medicaid Outlays Cause Redistribution Across U.S. Counties? Evidence from the ACA
May 15, 2026
PAERPB-2026-07
Laura Montenovo, Assistant Professor


Based on joint research with Kosali Simon and Coady Wing, published in Public Budgeting & Finance
Key Findings
– Beyond expanding coverage, the ACA Medicaid expansion reallocated substantial federal resources across U.S. counties.
– Differences in local demographics led to highly uneven per-capita inflows, ranging from about $360 per adult in expansion states to over $550 per adult in non-expansion states under expansion.
– Counties with more low-income and uninsured adults experienced the largest increases in federal Medicaid funding following the expansion.
– Many of the counties with the highest estimated per-capita gains are located in states that did not expand Medicaid and would have received above-average transfers (over $550 per adult) if they had expanded.
– Higher-income counties contributing more in federal income taxes received smaller ACA-related transfers, while lower-income counties received larger per-capita gains.
The Affordable Care Act (ACA) Medicaid expansion functioned not only as a health insurance policy but also as a large intergovernmental transfer system, reallocating substantial federal resources across U.S. counties.
Because eligibility varied sharply by local demographics, counties experienced highly uneven per-capita inflows of federal Medicaid dollars. Counties with higher shares of low-income and uninsured adults received the largest transfers, indicating that federal funds flowed disproportionately toward areas with greater economic and health needs.
At the same time, many of the counties estimated to gain the most from Medicaid expansion are located in states that chose not to expand. Had these states expanded, their counties would have received larger per-capita federal transfers than the average county in expansion states.
Medicaid Expansion and the Geography of Federal Spending
Medicaid is jointly financed by the federal and state governments. Under the ACA expansion for low-income, childless adults, the federal government covers 90 percent of program costs—an unusually high matching rate in intergovernmental fiscal arrangements.
As a result, Medicaid expansion represents one of the largest recent injections of federal dollars into local economies. In 2023 alone, Medicaid accounted for over $800 billion in combined federal and state spending, exceeding total federal spending on SNAP, the Earned Income Tax Credit, and housing assistance programs combined.
Importantly, this spending is not evenly distributed. Counties differ substantially in poverty rates, uninsured rates, health conditions, and demographic composition. Prior to the ACA, some counties had uninsured rates as high as one in three adults, while others had rates below one in twenty. When eligibility expanded in 2014, these differences translated into large disparities in federal funding flows across counties.
Measuring County-Level Transfers
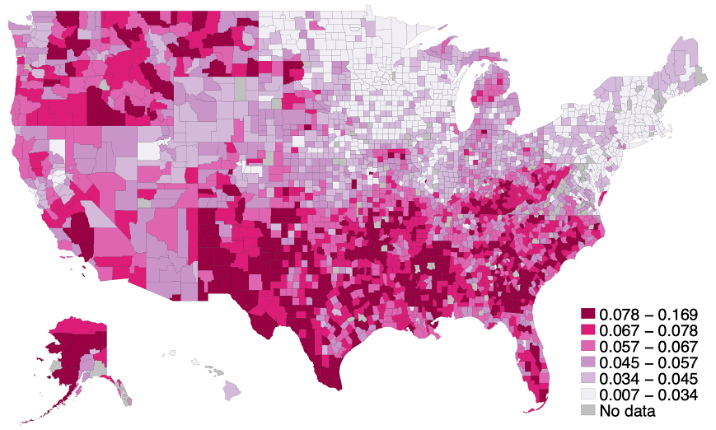
Our analysis provides county-level estimates of per-capita federal Medicaid transfers generated by the ACA expansion. These estimates are based on the number of newly eligible individuals residing in each county and are constructed for both expansion states and for non-expansion states under a counterfactual scenario in which they adopted the expansion. Figure 1 shows the geographic distribution of counties by their share of newly eligible adults. Counties with higher shares experienced larger increases in federal Medicaid funding following the expansion.
Figure 1
Geographical Distribution of the newly eligible population share, as the fraction of each county’s 2010 non-disabled, non-elderly, and childless population with income up to the 138% of the Federal Poverty Line
Magnitude of Federal Transfers
The results show that Medicaid expansion generated substantial federal funding inflows to counties in states that expanded.
On average, counties received approximately $500 more per adult per year in federal transfers attributable to the ACA. However, these averages mask important differences. In fact, in expansion states, estimated transfers are about $360 per adult per year, while in non-expansion states, estimated transfers would exceed $550 per adult if expansion were adopted.
These per-capita amounts translate into large aggregate flows. For example, a county with 50,000 adults would receive roughly $18 million annually in an expansion state, compared to more than $27 million if located in a non-expansion state that expanded Medicaid. Overall, the estimates indicate that many of the counties with the highest potential gains are located in states that have not expanded Medicaid.
Redistribution Across Counties
The study also examines how these estimated transfers correlate with county economic conditions, using measures such as federal income taxes and adjusted gross income. Our findings also show that the ACA Medicaid expansion increased redistribution across counties with different economic characteristics.
Counties contributing more to federal income taxes generally receive smaller ACA-related Medicaid transfers. In contrast, lower-income counties receive larger per-capita transfers. This results in a strong negative correlation between county-level tax contributions and Medicaid transfers.
Policy Relevance
Counties differ substantially in their reliance on federal Medicaid funding, particularly dollars associated with the ACA expansion. Some counties receive a significant share of their health care financing through these funds, while others experience minimal effects.
The ACA Medicaid expansion reshaped the geography of federal public spending. Counties differ widely in their exposure to the expansion, and these differences translate into substantial variation in federal funding inflows. The expansion directed larger amounts of federal dollars toward counties with greater economic and health needs, including many rural and medically underserved areas. At the same time, it generated redistribution across counties with different income levels and tax contributions.
Understanding the geographic distribution of these funding flows is central to assessing the implications of current and future Medicaid policy changes.
The Medicaid program is currently undergoing financing and administrative changes during the 2025–2026 period. These include the phaseout of enhanced federal incentives for newly expanding states, new federal limits on state financing mechanisms, and changes to eligibility verification processes that may reduce enrollment. As our study suggests, the effects of these changes are likely to vary considerably across counties, reflecting differences in population composition and reliance on Medicaid expansion funding.
For more information
The results presented in this brief are from a larger study published in the journal Public Budget and Finance and available at https://onlinelibrary.wiley.com/doi/10.1111/pbaf.70013.