Farm Income Outlook for Indiana
March 23, 2026
PAER-2026-07
Author: Michael Langemeier, Professor of Agricultural Economics
![]()
![]()
![]()
![]()
![]()
A recent report written in collaboration with the Rural and Farm Finance Policy Analysis Center at the University of Missouri (Jo et al., 2025) discusses trends in Indiana farm income, focusing on crop and livestock receipts, expenses and net farm income in 2024, 2025 and 2026. This article summarizes income statement information discussed in the report.
Table 1 presents information pertaining to receipts, expenses and net farm income for Indiana for 2024, 2025 and 2026. Cash farm receipts increased $232 million from 2024 to 2025 but are expected to decline by $1,033 million in 2026. The large drop in crop receipts in 2025 was offset by a large increase in livestock receipts and government payments. The large decline in projected cash farm receipts in 2026 is primarily due to large decreases in livestock receipts and government payments. After declining in 2025, crop receipts are expected to decline further in 2026.
Table 1
Farm Income Projections for Indiana
| 2024 | 2025 | 2026 | Change (million $) | ||||||
|---|---|---|---|---|---|---|---|---|---|
| million $ | million $ | million $ | 24/25 | 25/26 | |||||
| Cash Farm Receipts | 16,141 | 16,373 | 15,340 | 232 | -1,033 | ||||
| Crop Receipts | 9,035 | 8,523 | 8,436 | -512 | -87 | ||||
| Corn | 4,338 | 4,282 | 4,151 | -56 | -131 | ||||
| Soybeans | 3,930 | 3,513 | 3,526 | -417 | 13 | ||||
| Wheat | 126 | 98 | 124 | -28 | 26 | ||||
| Livestock Receipts | 6,198 | 7,071 | 6,165 | 873 | -906 | ||||
| Hogs and Pigs | 1,516 | 1,773 | 1,712 | 257 | -61 | ||||
| Poultry and Eggs | 2,686 | 3,282 | 2,373 | 596 | -909 | ||||
| Dairy | 1,058 | 1,041 | 1,061 | -17 | 20 | ||||
| Other Cash Receipts | 909 | 779 | 739 | -130 | -40 | ||||
| Government Programs | 118 | 891 | 610 | 773 | -281 | ||||
| Gross Cash Income | 16,260 | 17,264 | 15,950 | 1,004 | -1,314 | ||||
| Accrual Adjustments | 89 | 545 | 170 | 456 | -375 | ||||
| Gross Farm Income | 16,349 | 17,809 | 16,120 | 1,460 | -1,689 | ||||
| Total Expenses | 13,089 | 13,095 | 13,016 | 6 | -79 | ||||
| Net Farm Income | 3,260 | 4,714 | 3,104 | 1,454 | -1,610 | ||||
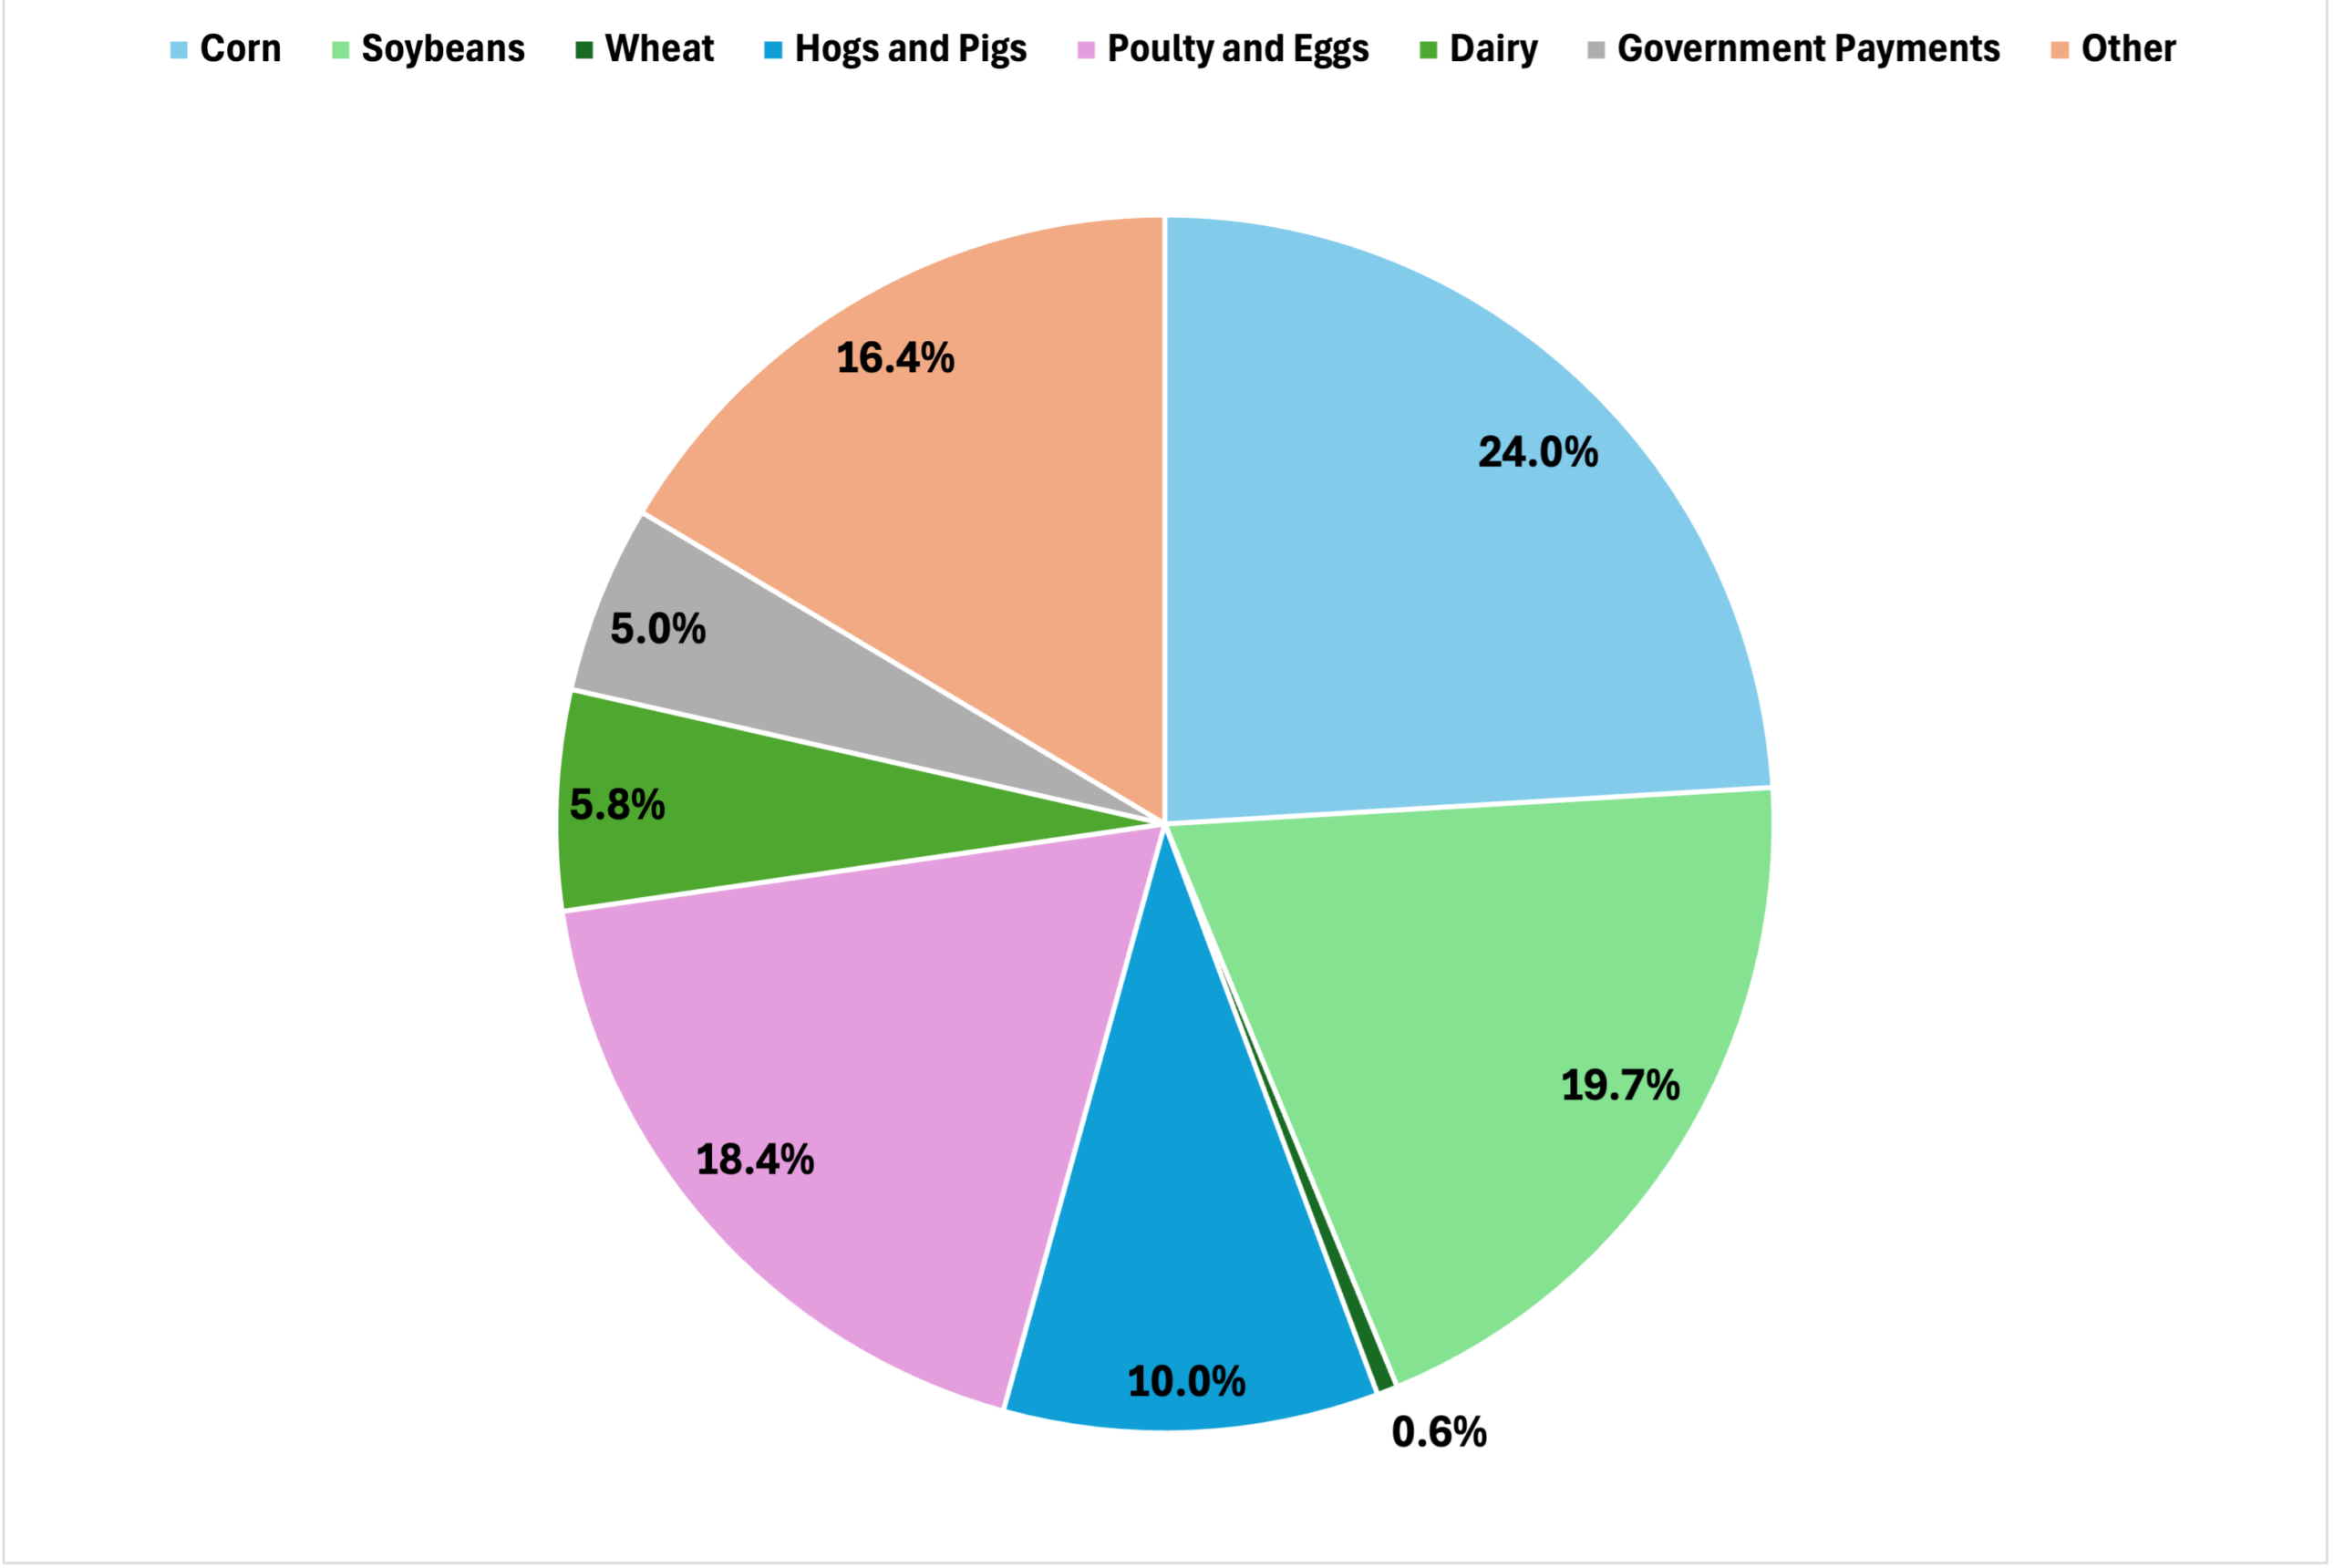
Cash receipts for corn, soybeans and wheat are illustrated in Table 1. These three crops represent the largest sources of crop revenue. Likewise, hogs and pigs, poultry and eggs, and dairy represent the three largest sources of livestock revenue. There are other sources of crop and livestock revenue, so the revenue for the three crop and three livestock items does not sum to the totals for crop and livestock receipts. The relative importance of different sources of receipts to farm revenue in Indiana in 2025 is depicted in Figure 1. Corn, soybeans and wheat are projected to account for approximately 45% of total revenue. Hogs and pigs, poultry and eggs, and dairy are expected to account for another 34% of total revenue. Though expected to be much higher in 2025 than they were in 2024, government payments still accounted for only 5% of total revenue in 2025.
Figure 1
Sources of Farm Revenue in Indiana, 2025
After a very small increase in 2025, total expenses are expected to decline by $79 million in 2026 (i.e., less than 1%). Unfortunately, information that would allow us to assign expenses to individual enterprises or crop versus livestock production is not available.
In addition to showing net farm income for each year, the last line in Table 1 illustrates the change in Indiana net farm income from 2024 to 2025 as well as the change from 2025 to 2026. Approximately 53% of the increase in net farm income from 2024 to 2025 can be attributed to an increase in government payments. The large increase in government payments in 2025 can primarily be attributed to financial assistance to mitigate the effects of economic losses and disaster-related losses. The projected change in government payments for 2026 does not include the recently announced “bridge payments.” These payments will increase expected government payment receipts and projected net farm income for 2026.
References
Jo, H., Wongpiyabovorn, O., Plastina, A., Langemeier, M. “Fall 2025 Farm Income Outlook for Indiana.” RaFF Report 2025-17, Rural and Farm Finance Policy Analysis Center, University of Missouri, Columbia, October 2025. Available at raff.missouri.edu/farm-income/
![]()
![]()
![]()
![]()
![]()
