More milk, consolidation continues, but still an improved 2020 price outlook
December 18, 2019
PAER-2019-18
Author: Nicole Olynk Widmar, Professor of Agricultural Economics


Milk production forecasts for 2019 and 2020 have been raised to 218.6 billion pounds (+0.4 billion) and 222.4 billion pounds (+0.8 billion), respectively, per the November 15th, 2019 United States Department of Agriculture (USDA) Economic Research Service (ERS) release. Fundamentally aggregate milk production is a product of cow numbers and milk yield per cow; whilst cow number growth has slowed, the higher average production per cow is currently expected to offset cow numbers. USDA National Agricultural Statistics Service (NASS) estimated September 2019 production 1.3% higher than 2018, whereas September cow numbers were 2,000 head lower than August 2019 (at 9.315 million head).
Given the challenging market situation facing dairy producers, the ending stocks for dairy products have been closely monitored and heavily reported on in 2019. September ending stocks (as reported in November) were significantly (159 million pounds on a milk-fat basis) higher for 2019 than they were a year earlier (Sept 2018). August 2019 was up, by comparison, only 21 million pounds over August 2018, indicating an acceleration in ending stock growth from August to September. Speaking to specific products, ending stocks were up year-over-year notably for butter (7.0%), dry whey (14.0%), whey protein concentrate (5.9%), and lactose (38.8%). Lending strength to the milk and dairy markets has been domestic use; Quarter 3 2019 saw a 0.2% increase over Quarter 3 2018 on a milk-fat basis (0.9% higher on a skim-solids basis). Speaking to product- specific forecasts, USDA ERS is projecting $1.685 per pound for cheddar cheese, bolstered by growth in domestic use, and $2.32 per pound for butter also continuing to be supported by domestic demand.
Cost of production on farm remains top-of-mind for dairy producers. Table 1 combines data across dairy farm sizes as reported by USDA ERS costs and returns per hundredweight of milk by dairy farm size category for years 2016-2018.2 Feed costs remain the single largest expense, comprising 76% of operating costs in 2016, and 75% of total operating costs in 2017-2018. The value of production less operating costs fell rather substantially in 2018, which fueled the concerns regarding dairy farm survival which have been discussed broadly in both farm and popular press. Feed price outlooks have been uncertain as major weather events have plagued much of the growing regions of the country in 2019, ranging from flooding and prevented planting to snowstorms pre-harvest. As of the November USDA outlook corn prices were raised 5 cents to $3.85/bu, soybean meal was forecast unchanged from October at $325/ short ton, and the 5-sate weighted average for premium alfalfa hay in Sept was $204/short ton, which was down slightly from August. As always, hay markets are expected to be highly variable across regions. Hay prices are notoriously difficult to forecast nationally as production and availability vary widely, and transport is difficult due to sheer bulkiness and handling difficulty.
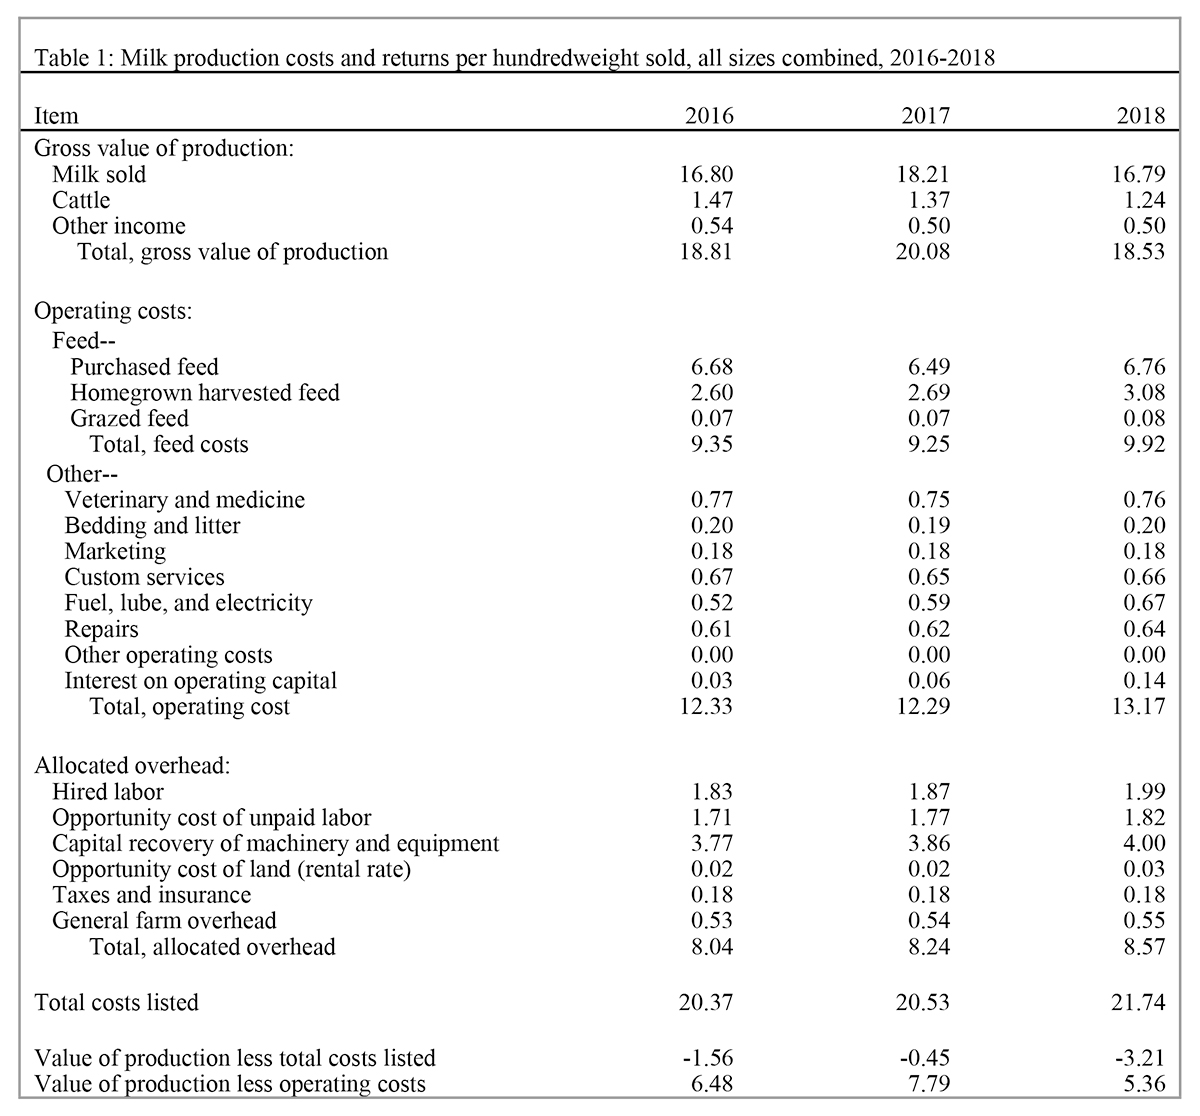
Table 1: Milk production costs and returns per hundredweight sold, all sizes combined, 2016-2018
Much attention has been placed on dairy farm closures and continued consolidation in the dairy industry. Even outside of farm-press there has been growing attention on the number of dairy herds of various sizes over time. Bloomberg had an Economics piece by Justin Fox in June 2019 entitled “A Productivity Revolution is Wiping Out (Most) Dairy Farms” that employed University of Wisconsin Center for Dairy Profitability Data to explain that big dairies are more profitable. There are a number of reasons why spreading overhead costs over more heads of cattle, as well as having increased capital available for investment in efficient equipment and/or technology may contribute to this fact. Furthermore, and as articulated by Cornell’s Andrew Navokovic in the Bloomberg article, there is a chicken-and-an-egg phenomena. Better managed dairies are likelier to invest in growth (get larger) in the first place. Regardless of the reasoning, explicit investigation into costs and returns by farm size (measured in number of cows) has become central to dairy industry conversations. Total costs, total operating costs, and total gross value of production on a per cwt basis are presented in Figure 1 across farm sizes; in graphical form the higher costs per cwt for smaller farms is easily evident.
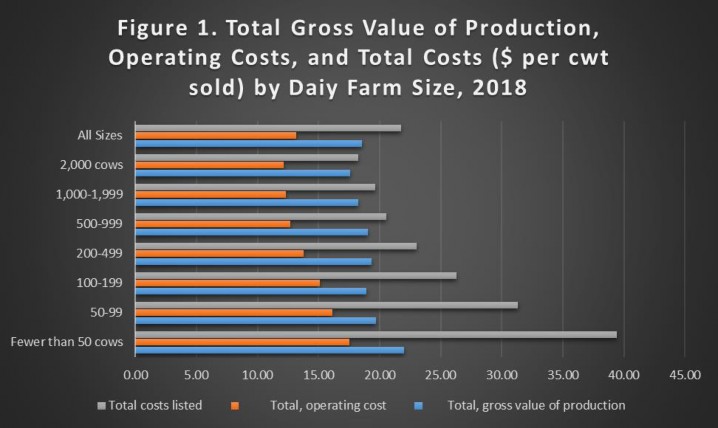
Note: Data was collected from https://www.ers.usda.gov/data-products/milk-cost-of-production-estimates/ where it is referenced as being “Compiled by ERS using Agricultural Resource Management Survey data and other sources.” Graphic was developed by Nicole Widmar by presenting only total values (excluding specific line-item costs) for 2018 data only. 2016 through 2018 data are available for download at the link provided.
Looking ahead to 2020 … The USDA raised Class III milk price forecast for 2020 to $17.50 per cwt while lowering the Class IV milk price forecast to $15.95 per cwt. In total, the all-milk price forecast for 2020 is unchanged at $18.85 per cwt as a higher Class III price forecast is largely offset by a lower Class IV.